[SAF] French Stock ReversalOn this very strong French Stock I waited this level for a long time and it has been my main profit level from years ago. Now I am looking for a corrective move to then enter back on it for the long terme.
I am now trying to play the short side of the correction on the TLB anticipation. This is my f
Next report date
—
Report period
—
EPS estimate
—
Revenue estimate
—
10.3 EUR
−667.00 M EUR
27.72 B EUR
338.59 M
About Safran SA
Sector
Industry
CEO
Olivier Andriès
Website
Headquarters
Paris
Founded
1956
IPO date
Sep 19, 2011
Identifiers
2
ISIN FR0000073272
Safran SA engages in the design, manufacture, and sale of aircraft, defense, and communication equipment and technologies. It operates through the following segments: Aerospace Propulsion, Aircraft Equipment, Defense, and Aerosystems, Aircraft Interiors. The Aerospace Propulsion segment designs, develops, produces, and markets propulsion and mechanical power transmission systems for commercial aircraft, military transport, training and combat aircraft, civil and military helicopters, and drones. The Aircraft Equipment, Defense, and Aerosystems segment covers the full life cycle of systems and equipment for civil and military aircraft and helicopters; and is involved in landing gear and brakes, nacelles and reversers, avionics, security systems, onboard computers, and fuel systems. The Aircraft Interiors segment engages in the manufacture of Cabin interiors for regional, medium-haul, long-haul, business and military aircraft. The Aircraft Interiors segment is composed of aircraft seats for passengers and crew, cabin equipment, overhead bins, class dividers, passenger service units, cabin interior solutions, chilling systems, galleys, electrical inserts and trolleys, and cargo equipment. The company was founded on August 16, 1924 and is headquartered in Paris, France.
Related stocks

Safran SA (SAF.pa) bearish scenario:The technical figure Pennant can be found in French company Safran SA (SAF.pa) at daily chart. Safran S.A. is a French multinational aircraft engine, rocket engine, aerospace-component and defense corporation. Employing over 95,000 people and generating 24.64 billion euros in sales in 2019, Safran o

Short Entry Prediction SAF 23-07-2021Short entry for SAF predicted by our AI algorithm. The time horizon of the prediction is approximately 5 days.

Will SAFRAN Stock still in trading range ?Safran Stock is in trading range since beginning of June. Next days could be decisive to have a clear view (Buy or Sell).
In any case, if stock price is going up, it will have as first goal 103.3 level, maybe 115.3 if first level is broken with high momentum.

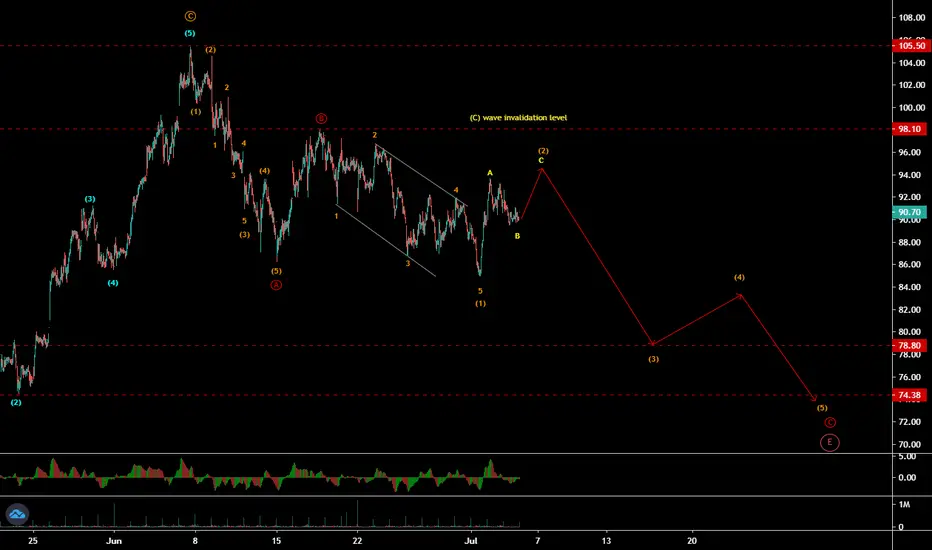
Safran SA (SAF) - Bears waiting for opportunity to take overSafran SA (SAF - France) is in ABC correction down in 60 min time frame (or impulse wave (C) wave down in 4 hr time frame). It has completed 1st wave of C down in leading diagonal structure and correcting in 2nd wave up in abc wave and b is in progress, so wait for its completion with invalidation l

SAFRAN - buy pullbackAeronautics and luxury are the driving force of the french index, among the strongest bluchip index in Europe up 26.5% in 2019.
Safran 10% pullback on rising trendline is buying opportunity. Support at 134.9, and 131 (gap fill).
Bull trend is intact: rising 200D MA, and ichimoku cloud an dtrend c


LONG SAFExpecting bounce from extremely oversold weekly and daily levels. If stop breached, be prepared to catch new daily reversal on lower levels with a tight stop.


See all ideas
Summarizing what the indicators are suggesting.
Neutral
SellBuy
Strong sellStrong buy
Strong sellSellNeutralBuyStrong buy
Neutral
SellBuy
Strong sellStrong buy
Strong sellSellNeutralBuyStrong buy
Neutral
SellBuy
Strong sellStrong buy
Strong sellSellNeutralBuyStrong buy
An aggregate view of professional's ratings.
Neutral
SellBuy
Strong sellStrong buy
Strong sellSellNeutralBuyStrong buy
Neutral
SellBuy
Strong sellStrong buy
Strong sellSellNeutralBuyStrong buy
Neutral
SellBuy
Strong sellStrong buy
Strong sellSellNeutralBuyStrong buy
Displays a symbol's price movements over previous years to identify recurring trends.
FR14002G3
Safran SA 0.75% 17-MAR-2031Yield to maturity
2.83%
Maturity date
Mar 17, 2031
FR14002G4
Safran SA 0.125% 16-MAR-2026Yield to maturity
2.37%
Maturity date
Mar 16, 2026
See all SAF bonds
Frequently Asked Questions
The current price of SAF is 301.0 EUR — it has increased by 0.80% in the past 24 hours. Watch Safran SA stock price performance more closely on the chart.
Depending on the exchange, the stock ticker may vary. For instance, on EURONEXT exchange Safran SA stocks are traded under the ticker SAF.
SAF stock has fallen by −1.51% compared to the previous week, the month change is a 1.28% rise, over the last year Safran SA has showed a 26.52% increase.
We've gathered analysts' opinions on Safran SA future price: according to them, SAF price has a max estimate of 382.00 EUR and a min estimate of 257.00 EUR. Watch SAF chart and read a more detailed Safran SA stock forecast: see what analysts think of Safran SA and suggest that you do with its stocks.
SAF stock is 1.44% volatile and has beta coefficient of 1.16. Track Safran SA stock price on the chart and check out the list of the most volatile stocks — is Safran SA there?
Today Safran SA has the market capitalization of 124.57 B, it has decreased by −2.00% over the last week.
Yes, you can track Safran SA financials in yearly and quarterly reports right on TradingView.
Safran SA is going to release the next earnings report on Feb 13, 2026. Keep track of upcoming events with our Earnings Calendar.
SAF earnings for the last half-year are 3.80 EUR per share, whereas the estimation was 3.81 EUR, resulting in a −0.29% surprise. The estimated earnings for the next half-year are 4.34 EUR per share. See more details about Safran SA earnings.
Safran SA revenue for the last half-year amounts to 14.77 B EUR, despite the estimated figure of 14.76 B EUR. In the next half-year revenue is expected to reach 16.74 B EUR.
SAF net income for the last half-year is 5.04 B EUR, while the previous report showed −724.00 M EUR of net income which accounts for 796.82% change. Track more Safran SA financial stats to get the full picture.
Yes, SAF dividends are paid annually. The last dividend per share was 2.90 EUR. As of today, Dividend Yield (TTM)% is 0.96%. Tracking Safran SA dividends might help you take more informed decisions.
As of Jan 31, 2026, the company has 99.36 K employees. See our rating of the largest employees — is Safran SA on this list?
EBITDA measures a company's operating performance, its growth signifies an improvement in the efficiency of a company. Safran SA EBITDA is 5.59 B EUR, and current EBITDA margin is 17.63%. See more stats in Safran SA financial statements.
Like other stocks, SAF shares are traded on stock exchanges, e.g. Nasdaq, Nyse, Euronext, and the easiest way to buy them is through an online stock broker. To do this, you need to open an account and follow a broker's procedures, then start trading. You can trade Safran SA stock right from TradingView charts — choose your broker and connect to your account.
Investing in stocks requires a comprehensive research: you should carefully study all the available data, e.g. company's financials, related news, and its technical analysis. So Safran SA technincal analysis shows the neutral today, and its 1 week rating is buy. Since market conditions are prone to changes, it's worth looking a bit further into the future — according to the 1 month rating Safran SA stock shows the strong buy signal. See more of Safran SA technicals for a more comprehensive analysis.
If you're still not sure, try looking for inspiration in our curated watchlists.
If you're still not sure, try looking for inspiration in our curated watchlists.