SAGA - 50%+ bullish wave awaited!LSE:SAGA - Daily view looks ready for a 50%+ move 📈
Patience is key.

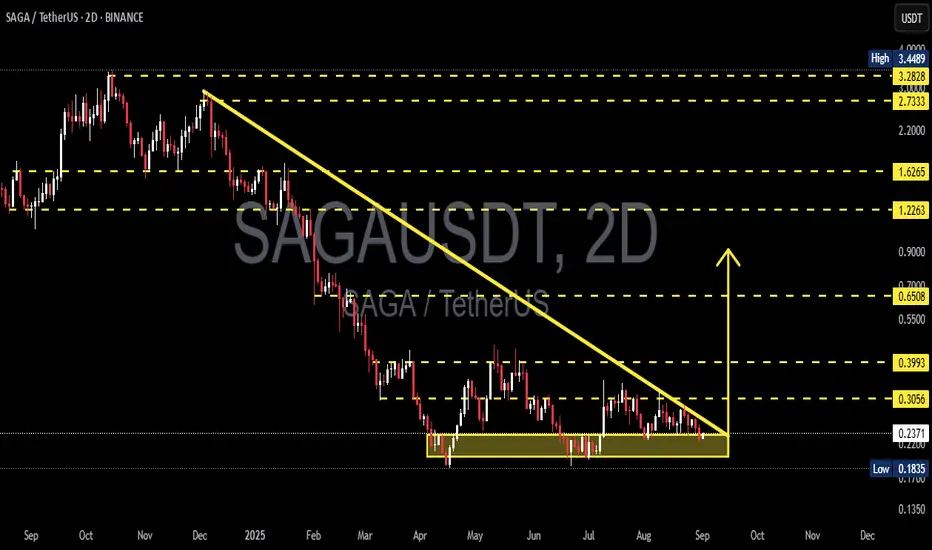
SAGAUSDT — Descending Triangle: Preparing for a Major Move?📌 Market Context
On the 2D timeframe, SAGA/USDT has been in a prolonged downtrend since late 2024 into early 2025. Recently, price action has formed a descending triangle: consistent lower highs pressing down against a flat demand zone at 0.22–0.24.
This structure reflects seller dominance (lower
SAGAUSDT 1D#SAGA is moving inside a symmetrical triangle on the daily chart. Consider buying some #SAGA at the current price and near the support level of $0.2493.
In case of a breakout, the potential targets are:
🎯 $0.3206
🎯 $0.3525
🎯 $0.3978
🎯 $0.4556
⚠️ As always, use a tight stop-loss and apply proper r

SAGAUSDTLets gooooo!!!! high and higher.Just focus on the manipulation in market weekly and daily and you will understand the secret of marker :) Good luck!!

SAGAUSDTlet see what will happen my expactation it is. it is doing w and high. there is idm level and below of it exist fvg and order block when you check daily and weekly you will see the level which i mention

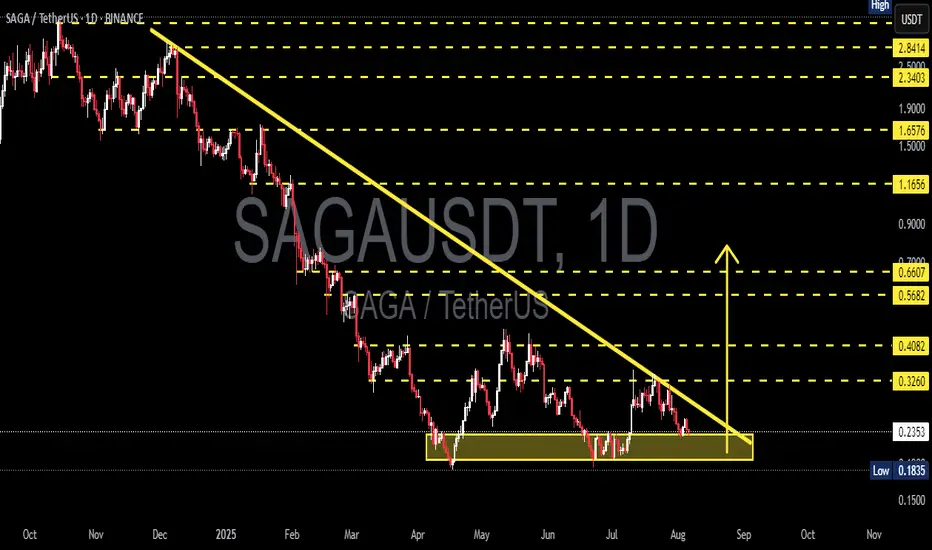
SAGA/USDT – Endgame of Descending Triangle, Big Move Coming!🧠 Overview:
SAGA/USDT has been forming a Descending Triangle pattern for nearly 6 months, reflecting sustained selling pressure while maintaining strong horizontal support between $0.2352 – $0.1835. The price is now approaching the apex of the triangle, suggesting that a major move is imminent — ei
SAGAUSDTNow is the time to buy and hold with low risk.
Target: 0.70
Stop-loss: Weekly candle close below 0.17
I'm just sharing my personal opinion to help us all better understand the market’s potential.
Always do your own research before investing — don’t rely solely on my view as a beginner, or anyone el

SAGAUSDT – Testing Major Trendline Resistance: Breakout?Chart Description:
SAGAUSDT (SAGA vs USDT) is currently retesting a long-term descending trendline (yellow line) that has acted as strong resistance since November 2024. The price is now approaching a critical zone, with potential for either a breakout or a strong rejection, which could define the

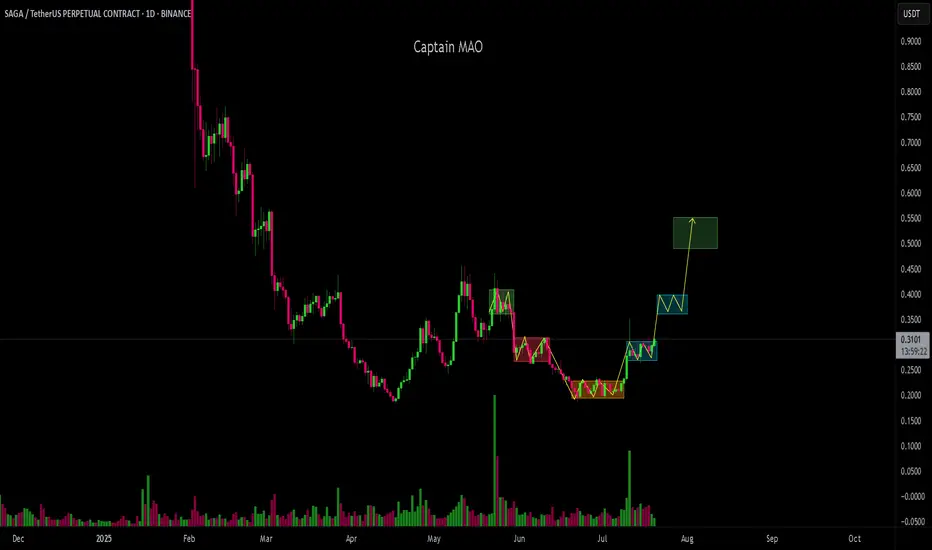
SAGA/USDT - MMM forming a clear (MMM) structure. After completing the accumulation phase, price made a strong move up and is now in the re-accumulation phase, showing signs of strength with higher lows and tightening consolidation.
Currently it’s on the verge of breaking out from re-accumulation, supported by gro
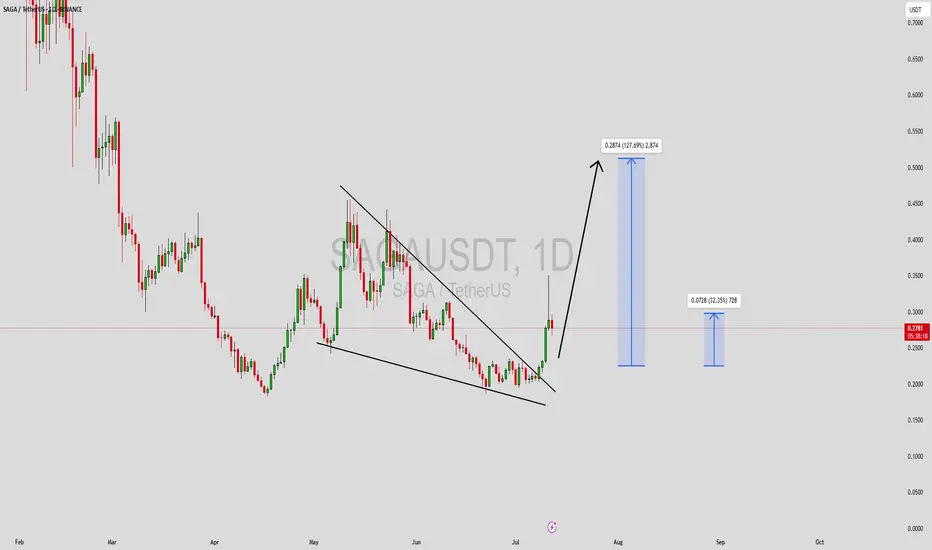
SAGAUSDT Forming Falling WedgeSAGAUSDT is showing promising signs of a trend reversal as it completes a falling wedge pattern, which is a widely respected bullish continuation signal in crypto trading. This chart structure suggests that the recent downtrend could be coming to an end, with the price poised for a strong upward bre
See all ideas
Summarizing what the indicators are suggesting.
Oscillators
Neutral
SellBuy
Strong sellStrong buy
Strong sellSellNeutralBuyStrong buy
Oscillators
Neutral
SellBuy
Strong sellStrong buy
Strong sellSellNeutralBuyStrong buy
Summary
Neutral
SellBuy
Strong sellStrong buy
Strong sellSellNeutralBuyStrong buy
Summary
Neutral
SellBuy
Strong sellStrong buy
Strong sellSellNeutralBuyStrong buy
Summary
Neutral
SellBuy
Strong sellStrong buy
Strong sellSellNeutralBuyStrong buy
Moving Averages
Neutral
SellBuy
Strong sellStrong buy
Strong sellSellNeutralBuyStrong buy
Moving Averages
Neutral
SellBuy
Strong sellStrong buy
Strong sellSellNeutralBuyStrong buy
Displays a symbol's price movements over previous years to identify recurring trends.