14% Upside moveStock has been consolidating for ~600 days.
All key moving averages (20D / 50D / 200D) have given a bullish crossover.
A clean pivot low is formed, offering a well-defined stop loss.
Structure looks strong for an upside move, supported by the metal sector trend.
Entry: 153
Stop Loss: 143
Target: 17
Next report date
—
Report period
—
EPS estimate
—
Revenue estimate
—
6.19 INR
23.72 B INR
1.02 T INR
1.44 B
About Steel Authority of India Limited
Sector
Industry
Website
Headquarters
New Delhi
Founded
1954
Identifiers
2
ISIN INE114A01011
Steel Authority of India Ltd. engages in the manufacture and sale of steel and steel products. It offers flat products such as hot rolled coils, hot rolled plates, cold rolled coils, pipes, and electrical sheets, and long products such as thermo mechanical bars and wire rods. The firm operates through the following segments: BSP, DSP, RSP, BSL, ISP, ASP, SSP, VISL, and Others. The company was founded on January 19, 1954 and is headquartered in New Delhi, India.
Related stocks

Review and plan for 7th Jaunary 2026Nifty future and banknifty future analysis and intraday plan.
sail- analysed.
This video is for information/education purpose only. you are 100% responsible for any actions you take by reading/viewing this post.
please consult your financial advisor before taking any action.
----Vinaykumar hi

SAIL: is on fire after a Buy Signal SAIL: is on fire after a Buy Signal
( Not a Buy / Sell Recommendation
Do your own due diligence ,Market is subject to risks, This is my own view and for learning only .)

SAIL : A 20% upside opportunityNSE:SAIL
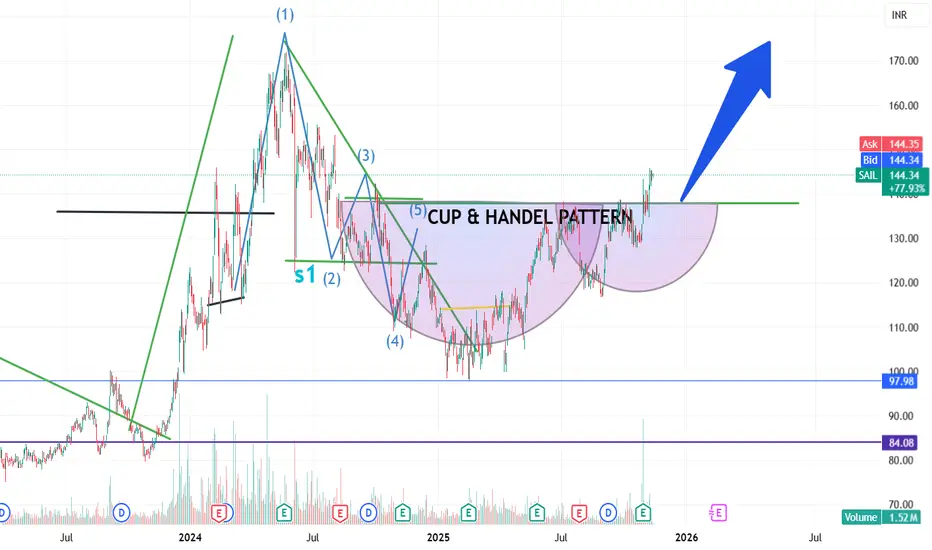
Deep pockets are moving to Metals. So far it has been precious and commercial metals like Gold and Silver. No more meaningful value remains in these counters. Therefore, alternative industrial metals offer better prospects.
A clear Cup and Handle formation is developing in SAIL.
Buy Z

SAIL...Sailing highSail gave a good price breakout...tgt is calculated which is the breath of the pattern..Its posted on the chart....Metals are in vogue..so along with this price breakout...Expect tgt to be achieved within a few months...All the best.

Steel Authority of India (SAIL) ViewOn a strong Trend line, this is how i think the stock can behave however beware of India Vix right now is is below 10 (very choppy markets) this move could take time to play out.
I personally am bullish here.

SAIL Analysis - Chart Structure Turning Strong - Metal Cycle SAIL (Steel Authority of India Ltd) is showing an interesting long-term setup:
🔹 Price reclaiming major moving averages on the weekly
🔹 Multiple higher lows forming since 2020
🔹 Heavy volume build-up at current accumulation range
🔹 Previous cycle resistance zones aligning near ₹253 → ₹305 → ₹465
M

SAIL: 2h Analysis - Anticipating Bounce from Demand ZoneSAIL: 2h Analysis - Anticipating Bounce from Demand Zone 🚀
Symbol: SAIL (Steel Authority of India Limited)
Exchange: NSE
Timeframe: 2-Hour
Current Price: \text{INR } 138.55
Analysis:
SAIL has experienced a sharp pullback after a strong uptrend, with the price moving below the short-term SMAs (9 &

BREAKING CHART ALERT! | SAIL on the verge of a major breakout!
After months of base-building, SAIL is showing a classic Cup & Handle formation on the daily chart — a pattern often seen before powerful rallies.
The stock has broken above the ₹143–145 neckline zone with rising volumes, hinting that the bulls are taking charge again. This breakout could mark th
SAIL : After a Buy Signal , hoping it to close above 145SAIL : After a Buy Signal , hoping it to close above 145 which would be an important level to cross.
( Not a Buy / Sell Recommendation
Do your own due diligence ,Market is subject to risks, This is my own view and for learning only .)

See all ideas
Summarizing what the indicators are suggesting.
Neutral
SellBuy
Strong sellStrong buy
Strong sellSellNeutralBuyStrong buy
Neutral
SellBuy
Strong sellStrong buy
Strong sellSellNeutralBuyStrong buy
Neutral
SellBuy
Strong sellStrong buy
Strong sellSellNeutralBuyStrong buy
An aggregate view of professional's ratings.
Neutral
SellBuy
Strong sellStrong buy
Strong sellSellNeutralBuyStrong buy
Neutral
SellBuy
Strong sellStrong buy
Strong sellSellNeutralBuyStrong buy
Neutral
SellBuy
Strong sellStrong buy
Strong sellSellNeutralBuyStrong buy
Displays a symbol's price movements over previous years to identify recurring trends.
Frequently Asked Questions
The current price of SAIL is 155.56 INR — it has decreased by −1.73% in the past 24 hours. Watch Steel Authority of India Limited stock price performance more closely on the chart.
Depending on the exchange, the stock ticker may vary. For instance, on NSE exchange Steel Authority of India Limited stocks are traded under the ticker SAIL.
SAIL stock has risen by 0.02% compared to the previous week, the month change is a 13.76% rise, over the last year Steel Authority of India Limited has showed a 45.72% increase.
We've gathered analysts' opinions on Steel Authority of India Limited future price: according to them, SAIL price has a max estimate of 175.00 INR and a min estimate of 90.00 INR. Watch SAIL chart and read a more detailed Steel Authority of India Limited stock forecast: see what analysts think of Steel Authority of India Limited and suggest that you do with its stocks.
SAIL reached its all-time high on Dec 6, 2007 with the price of 293.00 INR, and its all-time low was 3.95 INR and was reached on Sep 17, 2001. View more price dynamics on SAIL chart.
See other stocks reaching their highest and lowest prices.
See other stocks reaching their highest and lowest prices.
SAIL stock is 5.37% volatile and has beta coefficient of 1.44. Track Steel Authority of India Limited stock price on the chart and check out the list of the most volatile stocks — is Steel Authority of India Limited there?
Today Steel Authority of India Limited has the market capitalization of 614.83 B, it has decreased by −0.40% over the last week.
Yes, you can track Steel Authority of India Limited financials in yearly and quarterly reports right on TradingView.
Steel Authority of India Limited is going to release the next earnings report on Jan 30, 2026. Keep track of upcoming events with our Earnings Calendar.
SAIL earnings for the last quarter are 1.60 INR per share, whereas the estimation was 0.68 INR resulting in a 135.29% surprise. The estimated earnings for the next quarter are 0.91 INR per share. See more details about Steel Authority of India Limited earnings.
Steel Authority of India Limited revenue for the last quarter amounts to 267.04 B INR, despite the estimated figure of 252.17 B INR. In the next quarter, revenue is expected to reach 271.51 B INR.
SAIL net income for the last quarter is 4.19 B INR, while the quarter before that showed 7.45 B INR of net income which accounts for −43.76% change. Track more Steel Authority of India Limited financial stats to get the full picture.
Steel Authority of India Limited dividend yield was 1.39% in 2024, and payout ratio reached 27.86%. The year before the numbers were 1.49% and 26.94% correspondingly. See high-dividend stocks and find more opportunities for your portfolio.
As of Jan 27, 2026, the company has 126.98 K employees. See our rating of the largest employees — is Steel Authority of India Limited on this list?
EBITDA measures a company's operating performance, its growth signifies an improvement in the efficiency of a company. Steel Authority of India Limited EBITDA is 108.10 B INR, and current EBITDA margin is 10.94%. See more stats in Steel Authority of India Limited financial statements.
Like other stocks, SAIL shares are traded on stock exchanges, e.g. Nasdaq, Nyse, Euronext, and the easiest way to buy them is through an online stock broker. To do this, you need to open an account and follow a broker's procedures, then start trading. You can trade Steel Authority of India Limited stock right from TradingView charts — choose your broker and connect to your account.
Investing in stocks requires a comprehensive research: you should carefully study all the available data, e.g. company's financials, related news, and its technical analysis. So Steel Authority of India Limited technincal analysis shows the strong buy rating today, and its 1 week rating is strong buy. Since market conditions are prone to changes, it's worth looking a bit further into the future — according to the 1 month rating Steel Authority of India Limited stock shows the strong buy signal. See more of Steel Authority of India Limited technicals for a more comprehensive analysis.
If you're still not sure, try looking for inspiration in our curated watchlists.
If you're still not sure, try looking for inspiration in our curated watchlists.