Sandbox (SAND): Looking For Break of 200EMASandbox has been in a downtrend for quite some time, and currently we are looking for proper upward movement, which could give us a decent switch in trend and an opportunity for long positions.
So as of now we have to wait and once we get that last confirmation of breakout, then we will be looking

SAND is Ready for 130% + Up Move SAND is making a Triangle pattern at Support zone and It is Ready for Breakout from that pattern . and at the same time Altcoin Season Index is at 74 , when it is >75 it is sign of very bullish in altcoins and Breakouts will have very high potential to give a big move .
and at the same time Bitcoin

SANDUSDT.P stuck in $0.26–0.35 range — breakout soon?Introduction: SAND is coiling in a tight $0.30–0.33 box; reaction will set next swing.
Trend: Higher lows since $0.27, rising into supply.
Levels: Resist $0.33, ATH targets $0.35–0.38; support $0.30, then $0.292/$0.275.
Pattern: Range box; break/close outside decides.
Indicators: Price above EMAs;

Sand Short to 0.23$Sand Short to 0.2308
Enter 0.345
SL 0.3609
TP 0.23
Sand will retest Symmetrical Triangle's top.
SL would have manually in case of wick above the top
Low leverage can enter now

SANDUSDT UPDATE#SAND
Update
SAND Technical Setup
Pattern: Falling Wedge Pattern
Current Price: $0.280
Target Price: $0.38
Target % Gain: 40.33%
Technical Analysis: SAND is trading inside a long-term falling wedge on the daily chart, showing signs of accumulation at the lower trendline. A recent bounce highl

BIG PUMP COMING ON SAND!SAND is looking like a classic market cycle, ready for a strong recovery and bull run. I expect a significant pump on this coin soon. This is a prime opportunity to buy at these levels.
A huge vertical move is coming—mark my words.
As always, stay profitable.
Dalin Anderson


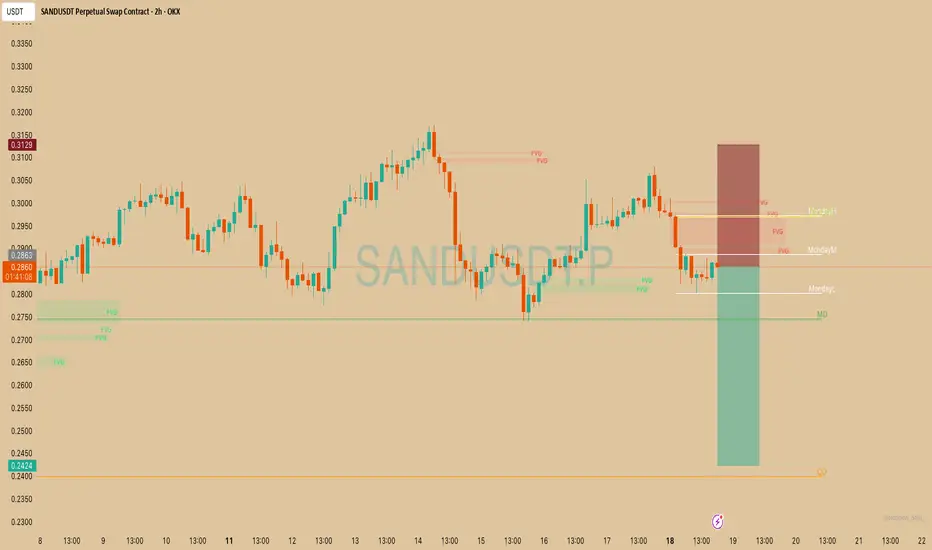
SAND SHORT SETUP1. Trade Direction: Short
The trader is betting on price going down.
The red box marks the stop-loss zone above, and the green box shows the take-profit zone below.
2. Key Levels on Chart
Monday High (MondayH), Monday Mid (MondayM), Monday Low (MondayL)
→ Weekly reference points used for intraday/we
SAND Breakout Alert!🚨 SAND Breakout Alert! 🚨
SAND is currently testing the red resistance zone 🔴
If price breaks out, the first target will be the green line level 🎯
A confirmed breakout here would signal bullish continuation and could push price higher ✅

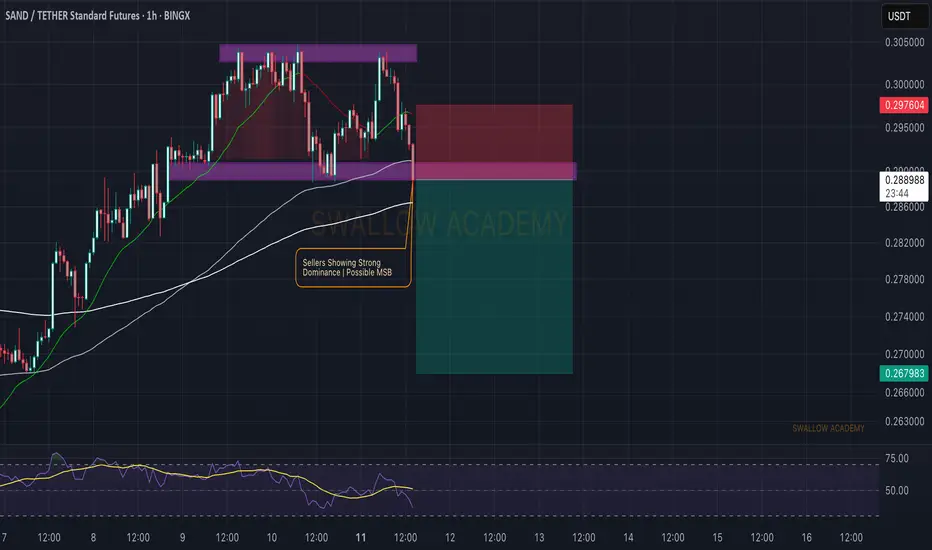
The Sandbox (SAND): Potential Breakdown + Downside Movement |SAND looks like it's about to break and form the MSB that might result in a good 7% downward movement for us.
Now the week has started pretty sharp on the markets, which seemed like a liquidity grab and more of a liquidity drag as well so what we are looking at is the MSB here, which might be a go
See all ideas
Summarizing what the indicators are suggesting.
Oscillators
Neutral
SellBuy
Strong sellStrong buy
Strong sellSellNeutralBuyStrong buy
Oscillators
Neutral
SellBuy
Strong sellStrong buy
Strong sellSellNeutralBuyStrong buy
Summary
Neutral
SellBuy
Strong sellStrong buy
Strong sellSellNeutralBuyStrong buy
Summary
Neutral
SellBuy
Strong sellStrong buy
Strong sellSellNeutralBuyStrong buy
Summary
Neutral
SellBuy
Strong sellStrong buy
Strong sellSellNeutralBuyStrong buy
Moving Averages
Neutral
SellBuy
Strong sellStrong buy
Strong sellSellNeutralBuyStrong buy
Moving Averages
Neutral
SellBuy
Strong sellStrong buy
Strong sellSellNeutralBuyStrong buy
Displays a symbol's price movements over previous years to identify recurring trends.