State Bank of India SBIN– Bullish Buy on Dips StrategyTimeframe: Daily
Trend: Primary uptrend intact
SBI continues to trade within a rising trend structure, respecting the ascending trendline formed from previous higher lows. Price has retraced after a strong impulse move and is currently hovering near a confluence support zone, making this a classic
State Bank of India
No trades
Key facts today
Next report date
—
Report period
—
EPS estimate
—
Revenue estimate
—
10.53 USD
9.17 B USD
77.85 B USD
About State Bank of India
Sector
Industry
CEO
Rana Ashutosh Kumar Singh
Website
Headquarters
Mumbai
Founded
1921
IPO date
Nov 3, 1994
Identifiers
3
ISIN US8565522039
State Bank of India engages in the provision of public sector banking, and financial services statutory body. It operates through the following segments: Treasury, Corporate/Wholesale Banking, Retail Banking, and Other Banking Business. The Treasury segment includes the investment portfolio and trading in foreign exchange contracts and derivative contracts. The Corporate/Wholesale Banking segment consists of lending activities of Corporate Accounts Group, Commercial Clients Group, and Stressed Assets Resolution Group that provides loans and transaction services to corporate and institutional clients and further include non-treasury operations of foreign offices. The Retail Banking segment refers to the retail branches, which primarily includes personal banking activities including lending activities to corporate customers. The Other Banking business segment focuses on the operations of all the non-banking subsidiaries and joint ventures of the group. The company was founded on January 27, 1921 and is headquartered in Mumbai, India.
Related stocks

SBIN - STWP Equity Snapshot📊 SBIN – STWP Equity Snapshot
Ticker: NSE: SBIN
Sector: 🏦 Banking (PSU)
CMP: 1,055.00 ▲ (+2.30% | 27 Jan 2026)
Learning Rating: ⭐⭐⭐⭐☆ (Bullish with Momentum Strength)
Chart Pattern Observed: 📈 Continuation Structure with Breakout Attempt
Candlestick Pattern Observed: Strong Bullish Expansion Candle

Tradingview on SBINSBIN 1048 has managed to close above resistance 1044. If this support violates it could drop to 1019,986. If support sustains it could move to 1080

SBI - Powerful Inverse Head & Shoulders Breakout RecoveryA textbook example of an Inverse Head and Shoulders breakout on the weekly chart of SBI. The stock successfully achieved the measured move target of +21% following the neckline breach. Currently, it is showing strong momentum supported by short-term EMAs.

Sbi bank intraday analysis 30-12-2025SBI Quick Summary
Upper Trigger: 967.55
Lower Trigger: 962.55
Above 967.55: sustain + volume = upside
Below 962.55: sustain + volume = downside
Fast reject: fake move
No-trade zone: 963.50 – 966.50

State Bank of India Ltd for 10th Dec #SBIN State Bank of India Ltd for 10th Dec #SBIN
Resistance 960 Watching above 961 for upside momentum.
Support area950-953 Below 950 gnoring upside momentum for intraday
Watching below 948 for downside movement...
Above 960 ignoring downside move for intraday
Charts for Educational purposes only.
Ple

SBI COMING 965 ANAYLSISSBI recently traded in the ₹947–₹972 range, with a 52-week high of ₹999 and low of ₹680.
The ₹965 level aligns closely with the 20-day moving average (DMA), making it a key pivot point.

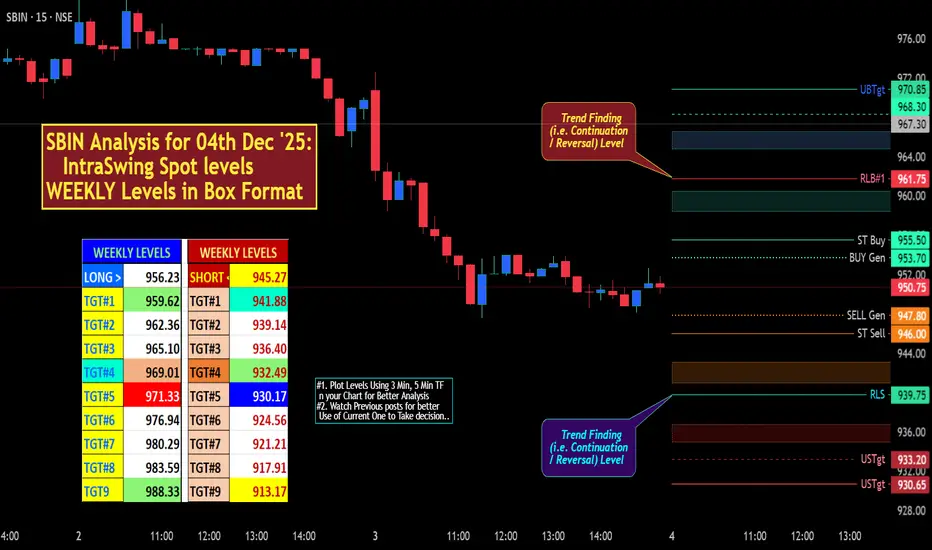
SBIN Analysis for 04th Dec '25: IntraSwing & WEEKLY Levels
Published on Request of Follower.
SBIN Analysis for 04th Dec '25: IntraSwing Spot levels
WEEKLY Levels in Box Format . Can also used in Short to Medium Term Level
Weekly Level Screen Shot:
[ Level Interpretation / description:
L#1: If the candle crossed & stays above the “Buy Gen”, i
SBIN - 1043 / 1139SBIN is flying high. Most of us will be expecting this is the limit. Its not done yet.
The best levels are 1043 (90% chance).
If you want to hold further the next resistance level is 1139. the stock will show some retracement after the level of 1139.

State Bank of India Ltd for 6th Nov #SBIN State Bank of India Ltd for 6th Nov #SBIN
Resistance 960 Watching above 961 for upside momentum.
Support area 950-953 Below 950 gnoring upside momentum for intraday
Watching below 950 for downside movement...
Above 960 ignoring downside move for intraday
Charts for Educational purposes only.
Ple

See all ideas
Summarizing what the indicators are suggesting.
Neutral
SellBuy
Strong sellStrong buy
Strong sellSellNeutralBuyStrong buy
Neutral
SellBuy
Strong sellStrong buy
Strong sellSellNeutralBuyStrong buy
Neutral
SellBuy
Strong sellStrong buy
Strong sellSellNeutralBuyStrong buy
An aggregate view of professional's ratings.
Neutral
SellBuy
Strong sellStrong buy
Strong sellSellNeutralBuyStrong buy
Neutral
SellBuy
Strong sellStrong buy
Strong sellSellNeutralBuyStrong buy
Neutral
SellBuy
Strong sellStrong buy
Strong sellSellNeutralBuyStrong buy
Displays a symbol's price movements over previous years to identify recurring trends.
770SBI38
State Bank of India 7.7% 19-JAN-2038Yield to maturity
8.34%
Maturity date
Jan 19, 2038
834SBIPERP
State Bank of India 8.34% PERPYield to maturity
7.92%
Maturity date
—
772SBIPER
State Bank of India 7.72% PERPYield to maturity
7.57%
Maturity date
—
751SBI32
State Bank of India 7.51% 06-DEC-2032Yield to maturity
7.32%
Maturity date
Dec 6, 2032
772SBI31
State Bank of India 7.72% PERPYield to maturity
7.30%
Maturity date
—
798SBIPERP
State Bank of India 7.98% PERPYield to maturity
7.26%
Maturity date
—
733SBI39
State Bank of India 7.33% 20-SEP-2039Yield to maturity
7.20%
Maturity date
Sep 20, 2039
755SBIPERP
State Bank of India 7.55% PERPYield to maturity
7.20%
Maturity date
—
775SBIPER
State Bank of India 7.75% PERPYield to maturity
7.15%
Maturity date
—
754SBI38
State Bank of India 7.54% 01-AUG-2038Yield to maturity
7.07%
Maturity date
Aug 1, 2038
680SBI35
State Bank of India 6.8% 21-AUG-2035Yield to maturity
6.07%
Maturity date
Aug 21, 2035
See all SBKFF bonds