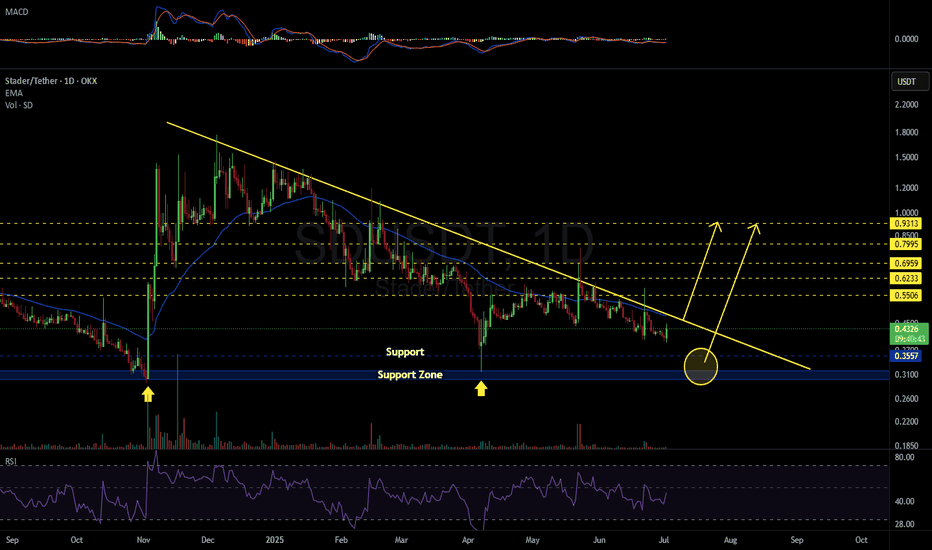
SDUSDT 1DConsider buying some #SD at the current price and near its support levels.
If a breakout occurs above the descending resistance and the daily EMA50, the targets are:
🎯 $0.5506
🎯 $0.6233
🎯 $0.6959
🎯 $0.7995
🎯 $0.9313
Support levels:
🛡 $0.3557
🛡 $0.3189
🛡 $0.2998
⚠️ As always, use a tight stop-loss
SD/Tether USD Cryptocurrency Quote | Chart & Forecast SummaryKey Indicators On Trade Set Up In General
1. Push Set Up
2. Range Set up
3. Break & Retest Set Up
Notes On Session
# SD / Tether USD Cryptocurrency Quote
- Double Formation
* (Downtrend Argument)) | Completed Survey
* 0.236 & 0 Retracement Area | Subdivision 1
- Triple Formation
* ((Triangle Struct
Potential Bullish Reversal for Stader (SD/USDT)#SD/USDT #Analysis
Description
---------------------------------------------------------------
+ The chart shows a descending channel pattern forming since the peak in end of 2023. The price has respected the upper and lower bounds of this channel multiple times, indicating a strong bearish trend w
SDUSDT-Symmetrical Triangle #SD/USDT
Massive Accumulation inside of Symmetrical Triangle💁♂️
Full Send🚀
FA
1 20% of Total Supply Zone will be burned - 25th June
2 SD Quarterly buybacks - live
3 Reward capping - Today
4 Insurance coverage against Slashing fee - soon
5 RWA , bitcoin staking - incoming
SDStader (SD) token is the native governance and value accrual token for Stader. Stader has established key mechanics that make SD tokens intrinsically tied to the Stader platform.
Value Capture for SD Token:
Stader charges a % of rewards as fees and the fees is the key revenue source for Stader pla
See all ideas
Summarizing what the indicators are suggesting.
Oscillators
Neutral
SellBuy
Strong sellStrong buy
Strong sellSellNeutralBuyStrong buy
Oscillators
Neutral
SellBuy
Strong sellStrong buy
Strong sellSellNeutralBuyStrong buy
Summary
Neutral
SellBuy
Strong sellStrong buy
Strong sellSellNeutralBuyStrong buy
Summary
Neutral
SellBuy
Strong sellStrong buy
Strong sellSellNeutralBuyStrong buy
Summary
Neutral
SellBuy
Strong sellStrong buy
Strong sellSellNeutralBuyStrong buy
Moving Averages
Neutral
SellBuy
Strong sellStrong buy
Strong sellSellNeutralBuyStrong buy
Moving Averages
Neutral
SellBuy
Strong sellStrong buy
Strong sellSellNeutralBuyStrong buy
Displays a symbol's price movements over previous years to identify recurring trends.


