SEIUSDT 1D#SEI is moving inside a bullish pennant pattern on the daily chart. Consider buying some #SEI here at the current price and near the support zone. In case of a breakout above the pattern, the potential targets are:
🎯 $0.3522
🎯 $0.3790
🎯 $0.4057
🎯 $0.4438
🎯 $0.4923
⚠️ Always remember to use a tight stop-loss and follow proper risk management.
SEIUSDT.3S trade ideas

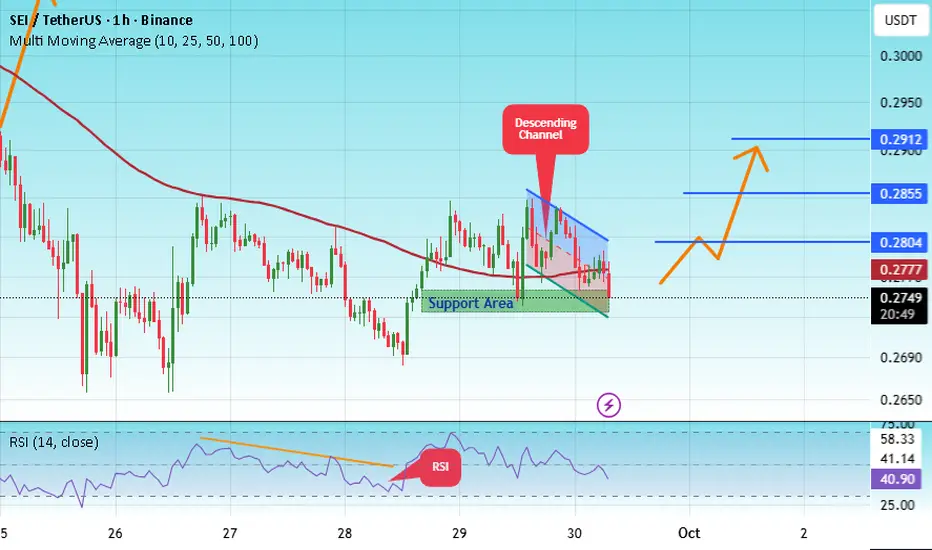
#SEI/USDT — Triangle Pattern Breakout Ahead?#SEI
The price is moving within a descending channel on the 1-hour frame, adhering well to it, and is heading for a strong breakout and retest.
We have a bearish trend on the RSI indicator that is about to be broken and retested, which supports the upward breakout.
There is a major support area in green at 0.2736, representing a strong support point.
We are heading for consolidation above the 100 moving average.
Entry price: 0.2756
First target: 0.2804
Second target: 0.2855
Third target: 0.2912
Don't forget a simple matter: capital management.
When you reach the first target, save some money and then change your stop-loss order to an entry order.
For inquiries, please leave a comment.
Thank you.
SEI/USDT — Bullish Flag at Demand Zone, Ready for Another Rally?📌 Overview
SEI/USDT recently completed a strong rally in mid-2025, forming a powerful flagpole. Since then, the price has been consolidating within a bullish flag pattern — a technical setup that often signals trend continuation after a healthy pause.
Currently, the price is trading around 0.2944 USDT, holding above key demand zones and Fibonacci levels. This suggests the market is in an accumulation phase, storing energy for its next major move.
---
📊 Pattern & Key Levels
Main structure: Bullish Flag (downward-sloping channel following a sharp rally).
Critical support:
0.2680 (Fib 0.5)
0.2437 (Fib 0.618)
These levels act as the structural foundation of the flag. As long as they hold, the bullish outlook remains intact.
Immediate resistance:
0.3462 – 0.3705 (intra-flag resistance, early breakout confirmation zone).
0.4727 – 0.5104 (major supply area, mid-term target).
Theoretical target:
A confirmed breakout projects the flagpole extension, pointing toward 0.60 – 0.73 in the medium term.
---
🚀 Bullish Scenario (Base Case)
1. Breakout confirmation: A 2D candle close above the upper flag trendline with strong volume.
2. Upside targets:
0.3462 – 0.3705 → breakout validation.
0.4727 – 0.5104 → significant supply zone.
0.60 – 0.73 → projected continuation target from the flagpole.
3. Healthy retest: A breakout followed by a pullback to retest the flag’s upper boundary and hold would strengthen the bullish case.
---
⚠️ Bearish Scenario (Risk Case)
If the price closes below 0.2437, the bullish flag structure will be invalidated.
Downside levels to watch:
0.21 (lower channel support).
0.13 (historical low and extreme demand zone).
This scenario remains less likely while the demand zone holds, but risk management is crucial.
---
✨ Conclusion & Insight
SEI is currently in a healthy consolidation phase after a strong rally, forming a textbook bullish flag.
The zone around 0.2680 – 0.2437 is the last line of defense for bulls.
If the breakout is confirmed, SEI could re-enter a strong uptrend with ambitious targets up to 0.73 USDT.
In other words: SEI is at a critical decision point. Traders and investors should closely monitor these levels, as the next move may define SEI’s trend into Q4 2025.
---
#SEI #SEIUSDT #CryptoAnalysis #BullishFlag #TechnicalAnalysis #Altcoin #PriceAction #ChartPattern

SEI/USDT;BUY LIMITHello friends
Given that the price has reached the specified support and the price is supported by buyers within the specified range and the specified resistance has been broken, we can buy in steps with risk and capital management and move to the specified targets.
*Trade safely with us*

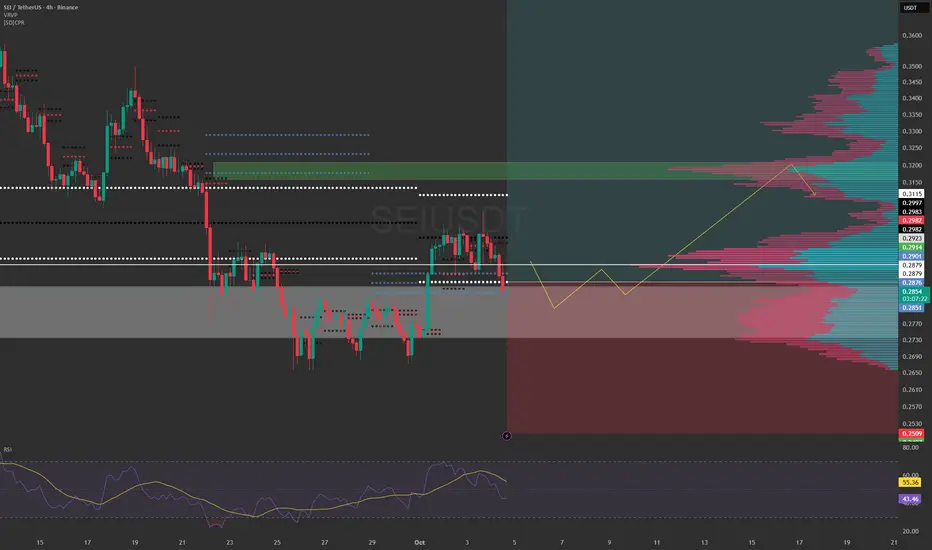
SEIUSDT Swing trader with patience.Today I have a Long opened on SEIUSDT, it is between the CPR level and the OB LVL + GAP, I have set a large stop loss, so we can give.
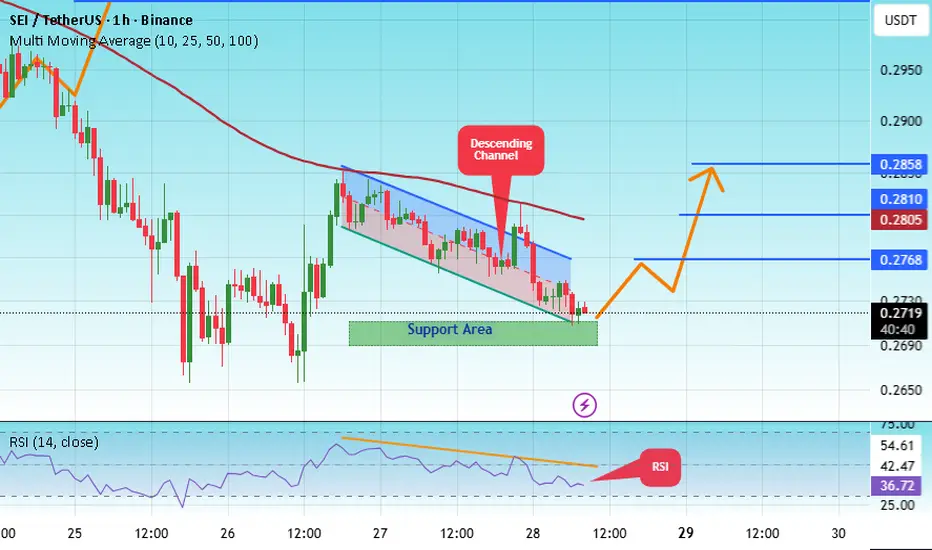
#SEI/USDT — Triangle Pattern Breakout Ahead?#SEI
The price is moving within a descending channel on the 1-hour frame, adhering well to it, and is heading for a strong breakout and retest.
We have a bearish trend on the RSI indicator that is about to be broken and retested, which supports the upward breakout.
There is a major support area in green at 0.2700, which represents a strong support point.
We are heading for consolidation above the 100 moving average.
Entry price: 0.2721
First target: 0.2768
Second target: 0.2805
Third target: 0.2858
Don't forget a simple matter: capital management.
When you reach the first target, save some money and then change your stop-loss order to an entry order.
For inquiries, please leave a comment.
Thank you.
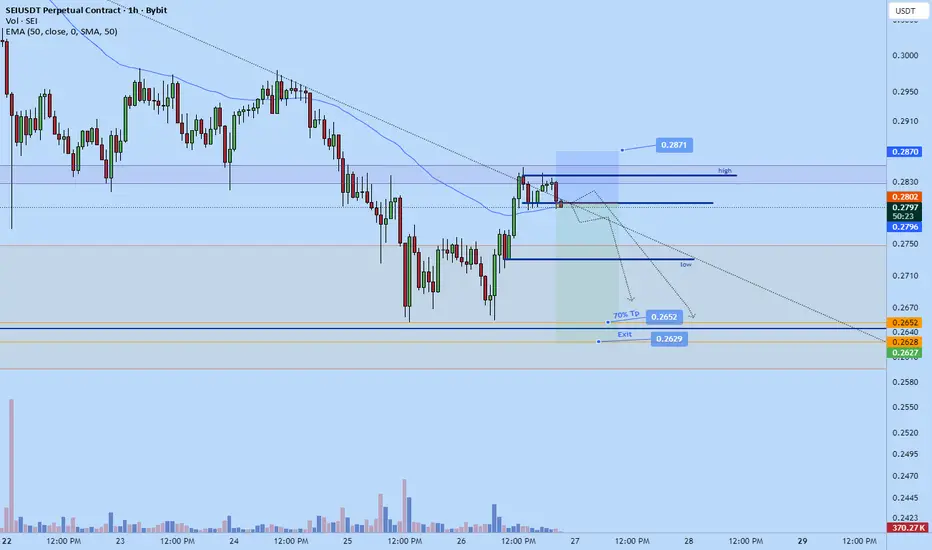
Sei weekend dump to $0.263Went short on sei just now.
Sl: 0.2871
Tp: 0.2629
Partial 70% tp at $0.2652
2.57 RR roughly.
Monthly close coming up and market is likely to revisit prior monthly lows.
SEI - NEUTRAL HTF - BEARISH LIKELY SHORT TERM NYSE:SEI - Price Update 🐸🚨
⏳ HTF (H4 & 1D): flat PA, no clear trend yet
📌 Range: $0.2600-$0.3750
🟩 Line in the sand: $0.2500 support (bullish bias intact while above)
📉 Short‑term: momentum weak, retest of $0.2750–$0.2700 possible
❌ Breakdown: a clean move below $0.2500 could open $0.2200 → $0.1950 (key demand)
Possible Strategy
🧭 HTF: respect major S/R, stay patient
🎯 LTF: trade the box (fade extremes, tight invalidation)
🧠 Fundamentals remain strong for #SEI ; hold $0.2500 and the bullish case stands.

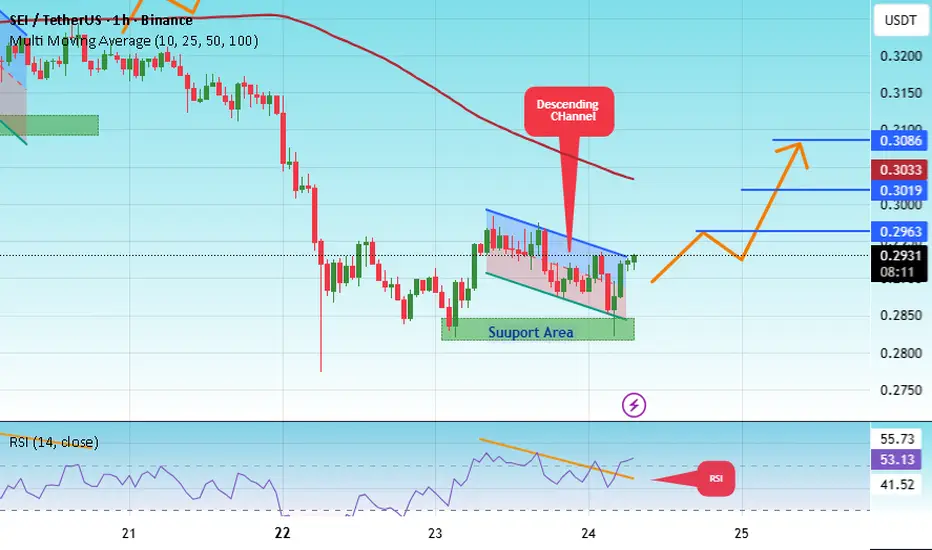
#SEI/USDT — Triangle Pattern Breakout Ahead?#SEI
The price is moving within a descending channel on the 1-hour frame, adhering well to it, and is heading for a strong breakout and retest.
We have a bearish trend on the RSI indicator that is about to be broken and retested, which supports the upward breakout.
There is a major support area in green at 0.2830, representing a strong support point.
We are heading for consolidation above the 100 moving average.
Entry price: 0.02913
First target: 0.2963
Second target: 0.3020
Third target: 0.3086
Don't forget a simple matter: capital management.
When you reach the first target, save some money and then change your stop-loss order to an entry order.
For inquiries, please leave a comment.
Thank you.
SeiusdtHello snipers. The sei / usdt currency pair is on the one-day time frame. The price is still moving in an ascending channel. With the market turning red, a strong bearish candle has brought the price to the bottom of the channel. Fortunately, the moving average line is below the price at the bottom of the channel, which can be a strong support and I hope the price will turn back from this point and move towards the top of the channel. Do not catch the falling knife in your hand. Wait for the reaction to the bottom and support. I am learning. Analysis is not a recommendation to buy or sell. 🙏🙏🫶

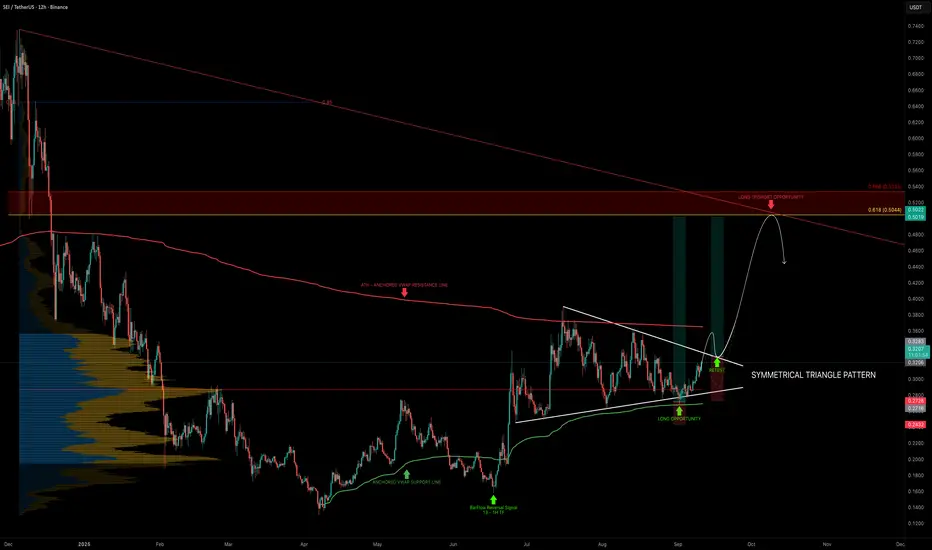
SEI — Triangle Pattern Breakout Ahead?SEI has been consolidating in a symmetrical triangle for the past 78 days, now reaching the apex, signaling that a big move is coming soon.
Price has been trading between two anchored VWAPs:
From the $0.13 low → acting as support (currently ~$0.27)
From the ATH → acting as resistance (currently ~$0.365)
The POC of the 280-day trading range sits at $0.287, a key pivot level to watch.
Support Confluence
Anchored VWAP (from $0.13 low): ~$0.27 (long entry zone already tested)
POC (280-day range): $0.287 → key stop-loss reference
Symmetrical triangle breakout retest: ~$0.33 → potential re-entry after breakout
Fib Speed Resistance Fan 0.618: ~$0.27 → reinforcing support at the anchored VWAP
Resistance Confluence
0.618 Fib retracement: $0.5044 → aligns with $0.5 key level
3B Market Cap resistance: ~$0.505
Fair Value Gap (FVG): sitting around $0.5
Trend-Based Fib Extension 1.0: $0.5 → major target confluence
🟢 Long Trade Setup
Entry Zone: Retest around $0.33 after breakout
Stop-Loss: Below $0.287 (POC), to be adjusted after seeing a clear reversal sign.
Target (TP): $0.50
Potential Gain: ~+50%
Timeframe: Could take ~1 month to play out
Technical Insight
SEI has been compressing for over two months, and volatility is about to expand.
The ideal entry at $0.27 (anchored VWAP support) has already triggered.
The next opportunity lies in a triangle breakout + retest around $0.33.
The $0.50 level stands out as a high-confluence target, combining Fib levels, market cap, FVG, and extension symmetry.
_________________________________
💬 If you found this helpful, drop a like and comment!
7 RR maxSEI is in a consolidation period. I don't believe it has reached high enough. This type of consolidation is typically present before a larger move in the direction of the overall trend (up). Basing this largely on an EW triangle pattern--which may or may not be valid. The other factors supporting this trade are promising as well however.

Designated buying and selling points...Hello friends
Well, you see that we had a downward trend and once the price reached the specified resistance, but it was not valid and the price fell further to the point where we specified the support with Fibonacci for you and from there the price was supported and the resistance was broken, causing the price to grow.
Now that the price has grown well and was able to break the specified resistance, a good opportunity has been provided for us to buy in stages and with capital and risk management.
And we move with it to the resistance areas marked with Fibonacci.
*Trade safely with us*

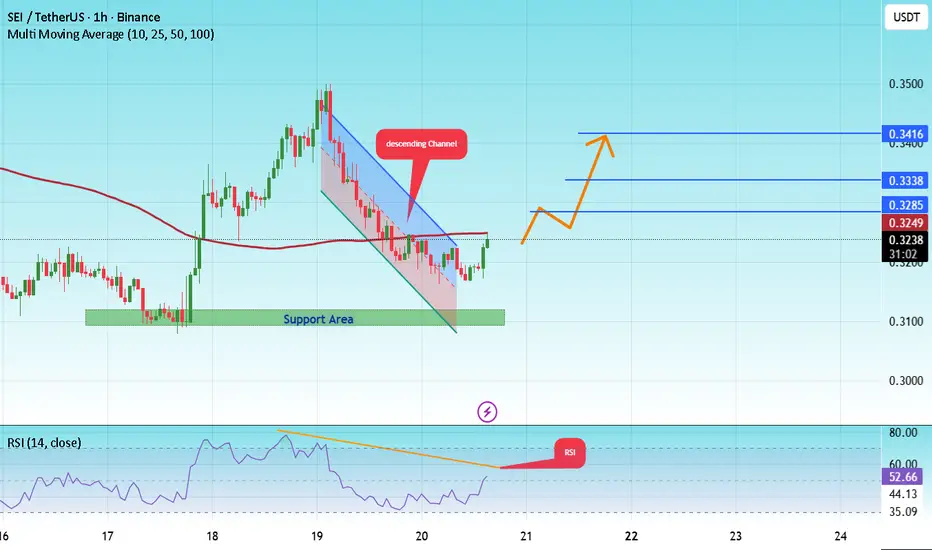
#SEI/USDT — Triangle Pattern Breakout Ahead?#SEI
The price is moving in a descending channel on the 1-hour frame and is expected to break and continue upward.
We have a trend to stabilize above the 100 moving average once again.
We have a downtrend on the RSI indicator that supports the upward move with a breakout.
We have a major support area in green that pushed the price higher at 0.3100.
Entry price: 0.3243
First target: 0.3285
Second target: 0.3338
Third target: 0.3416
To manage risk, don't forget stop loss and capital management.
When you reach the first target, save some profits and then change the stop order to an entry order.
For inquiries, please comment.
Thank you.
$SEIPUMP Token Slumps, Leads Meme Coin Losses: Pump.fun’s native token, PUMP, recently slumped, leading losses among meme coins like Dogecoin, PEPE, and BONK, as the market stumbled.

#SEI/USDT Approaching Triangle Breakout#SEI
The price is moving within a descending channel on the 1-hour frame, adhering well to it, and is heading for a strong breakout and retest.
We have a bearish trend on the RSI indicator that is about to be broken and retested, which supports the upward breakout.
There is a major support area in green at 0.3125, which represents a strong support point.
We are heading for consolidation above the 100 moving average.
Entry price: 0.3156
First target: 0.3185
Second target: 0.3212
Third target: 0.3246
Don't forget a simple matter: capital management.
When you reach the first target, save some money and then change your stop-loss order to an entry order.
For inquiries, please leave a comment.
Thank you.

SEI/USDT Bullish Setup – Eyeing Breakout Towards $0.46SEI/USDT is currently trading around $0.31, holding above the ascending trendline support. The price has shown consistent higher lows since July, indicating strong bullish structure.
The short-term retracement looks healthy and is finding support near the trendline. As long as SEI holds above the $0.28–$0.29 demand zone, the bias remains bullish.
I expect a potential move towards the upper resistance levels in the coming weeks:
Target 1: $0.34
Target 2: $0.38
Target 3: $0.42
Target 4: $0.46
Stop loss: Below $0.28 support.
This setup offers a favorable risk–reward ratio if the ascending trendline continues to act as strong support. A breakout above $0.34 could accelerate momentum towards higher targets.

SEIUSDT Scalp 1hrPrice poked into the OB but was rejected.
Smart money is absorbing liquidity, shaking out weak hands (stop hunts).
Buy near the OB edge opposite the wick:
Use a tight stop just beyond the wick to avoid getting caught if the stop hunt continues.
Look for VP LVN/HVN confluence—if LVN below a bullish OB, upward move is easier.
Key mindset:
Spike + wick = confirmation that smart money is active here.

A buy idea on Sei/UsdtLiquidity was built up on the buy side to be taken, and we have a three touch thread line liquidity.
Price is also coming off a strong 4hr breaker zone, and a confirmation entry on 30minute already presented it self. Waited for the break of structure and an inducement of recent low ro be taken in the 5mins to fuel ⛽ price going up. Targeting candle the 4hr next swing high Incase of price waiting to reverse.

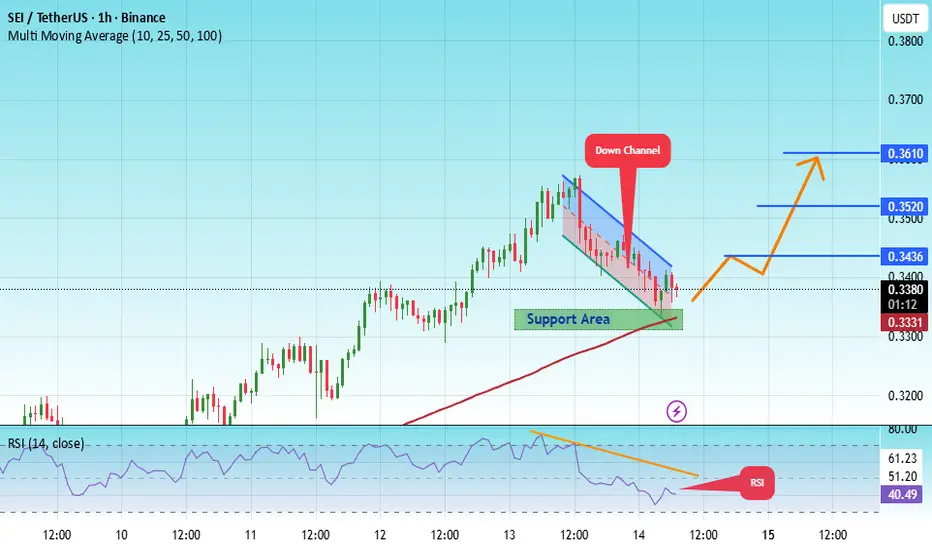
#SEI/USDT Testing Key Support – Breakout or Breakdown ?#SEI
The price is moving within a descending channel on the 1-hour frame, adhering well to it, and is heading for a strong breakout and retest.
We have a bearish trend on the RSI indicator that is about to be broken and retested, which supports the upward breakout.
There is a major support area in green at 0.3325, which represents a strong support point.
For inquiries, please leave a comment.
We are in a consolidation trend above the 100 Moving Average.
Entry price: 0.3380
First target: 0.3436
Second target: 0.3520
Third target: 0.3610
Don't forget a simple matter: capital management.
When you reach the first target, save some money and then change your stop-loss order to an entry order.
For inquiries, please leave a comment.
Thank you.
SEI - MASTERCALL AGAIN! - +30% up.Another mastercall on NYSE:SEI - +30% up already ✅🔥
You know what's coming??? 🤑
Whyyy aren't you following me yet????

RSI + Breakout Confirm Bullish Pattern on SEIUSDT📈 SEIUSDT Weekly Breakout – Bulls in Control
If we zoom out to the weekly timeframe, SEI is doing something very important right now. The price is breaking above a major resistance zone that has been holding it back for a long time. When such a key resistance gets taken out, it often signals the start of a much bigger move.
Looking at the technicals:
RSI on weekly is pushing higher, showing strong momentum.
Structure looks clean — this isn’t just a small bounce, it’s shaping up as a true breakout pattern.
Market expectations are building for upside targets, with $0.75 as a first key level and potentially even $1.00 on the horizon if momentum continues.
Overall, this is a bullish setup where buyers are gaining control. If the breakout sustains, the upside returns could be significant in the coming weeks.
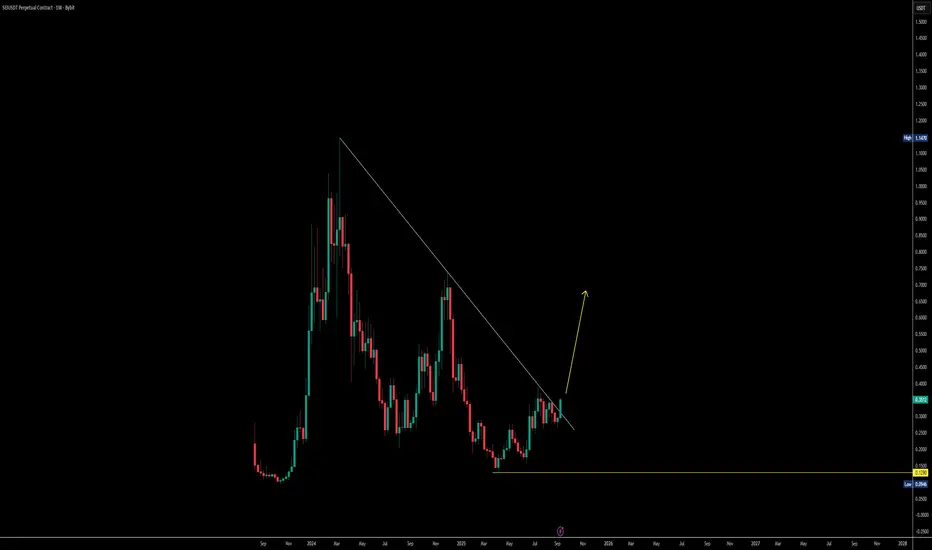
SEI / USDT : Looking so good for strong bullish rallySEI/USDT is showing strong momentum and is once again breaking out of trendline resistance. If this breakout sustains, we can expect a short-term rally toward $0.40 – $0.45.
Spot Update: SEI is also looking very attractive for spot buyers — a good accumulation opportunity.
Midterm Target for SEI: $0.80 – $1 🚀
