SEI Breakout Alert!🚨 NYSE:SEI Breakout Alert! 🚨
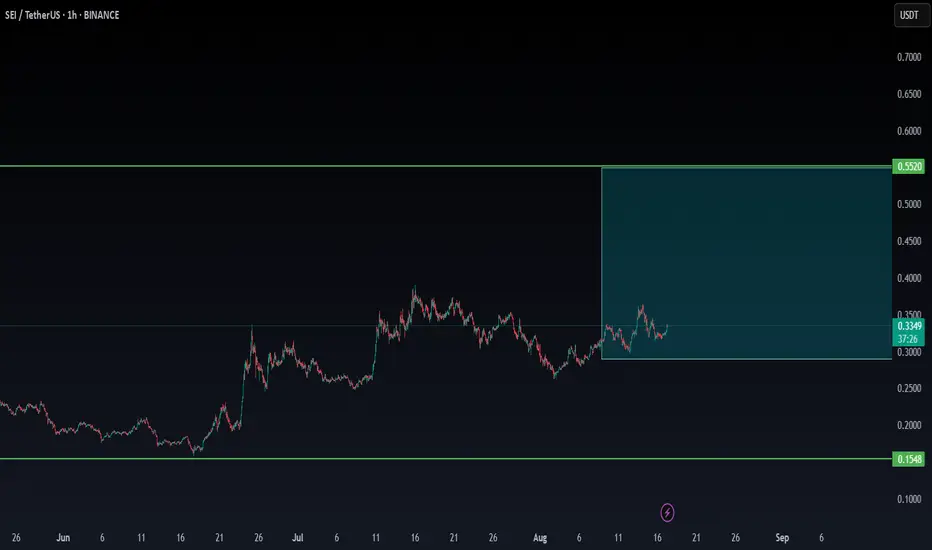
NYSE:SEI is currently testing the red resistance zone 🔴
If price breaks out, the first target will be the green line level 🎯
A confirmed breakout would signal bullish continuation and could drive further upside ✅
SEIUSDT.3S trade ideas

SEI PUMP incomingSEI looks like the best option. It was out of the running for a while, but it's going to be such a hit that no one will understand. The SEI upgrade is coming. You'd better buy a spot.

SEI/USDT NEW INCREASE VOLUMESEI is showing a new trend in volume, which may be confirmed in the coming time frames. We will continue to monitor the trend to see if confirmation occurs
SEI : The best future belongs to this coin.Hello friends🙌
Given the rapid growth that this coin has had and I think it will continue, now that the price is correcting, there is a good opportunity to buy in stages with risk and capital management and move with it to the specified goals.
🔥Follow us for more signals🔥
*Trade safely with us*


Sei continues to growI believe Sei will continue to grow if it stays above the trend line. which is around the .3183 area. I personally will be looking for longs in the area of the green circle on the chart. However a bit of caution is encouraged, as it may wick lower 1st, then continue to trend upwards! Do you agree with my analysis??
Please comment below

SEI ANALYSIS (1D)SEI is currently moving into a channel which is providing a very specific outlook.
At the moment, it is hard to determine if the outlook is bullish or bearish in the mid term.
If we ignore BTC and the possible altcoin bull run to cut out the noise, I believe this asset is either getting ready to pump 10x or is on a one-way ticket to hell.
The orange arrow on the chart represents the most likely path for this asset for now.
Thanks for reading.

sei long idea as falling wedge is formedsei long idea as falling wedge is formed
and we have 2 scenerios but both are long due to market bullish sentiments
more update will be given soon , you can chk its supply to make confirmation and token distribution strategy may effect the idea!

SEI — Quiet Sweep Before the StormVolume concentration. Fib confluence. BTC.D drifting down. The SEI pullback is where precision meets probability.
📊 BINANCE:SEIUSDT.P — Liquidity-Grab Pullback
🎯 Direction: Long
📍 Entry Zone: 0.334 – 0.345 (15m bullish OB / 0.50–0.618 retrace of BOS leg)
🛑 Stop Loss: 0.322 (below sweep wick / OB edge; ATR buffer)
💰 Targets:
• TP1 — 0.368
• TP2 — 0.392
• TP3 — 0.410
📐 RR Ratio: ~3.1 : 1 (to TP2)
🧠 Trust Meter: ████████▒▒ — 88%
⸻
🔍 Why We Like It
• HTF Bias (12H): Trend turning up, pushing into prior supply after strong impulse from ~0.31 → 0.36.
• Sweep Setup: Prefer wick below 0.34 → 0.33, closing back inside to grab sell-side liquidity.
• Structure Confirmation: Require 15m BOS up (close above last LH from pullback).
• Confluence: Entry zone = 0.382–0.618 retrace of BOS displacement; volume POC near low-0.33s; OI rising, funding stable.
• Macro Context: BTC.D drifting down — supportive for alt longs. Skip if BTC.D spikes up intraday.
⸻
📏 Management
• SL → BE+fees at TP1, trail under 5m HL ladder.
• Time-stop: no new HH in 50m → cut 50% or exit.
• Invalidate on 12H close < 0.322 or BTC sell-off + BTC.D breakout.
• No new positions ±30m major news.
⸻
🚀 Candle Craft | Signal. Structure. Execution.

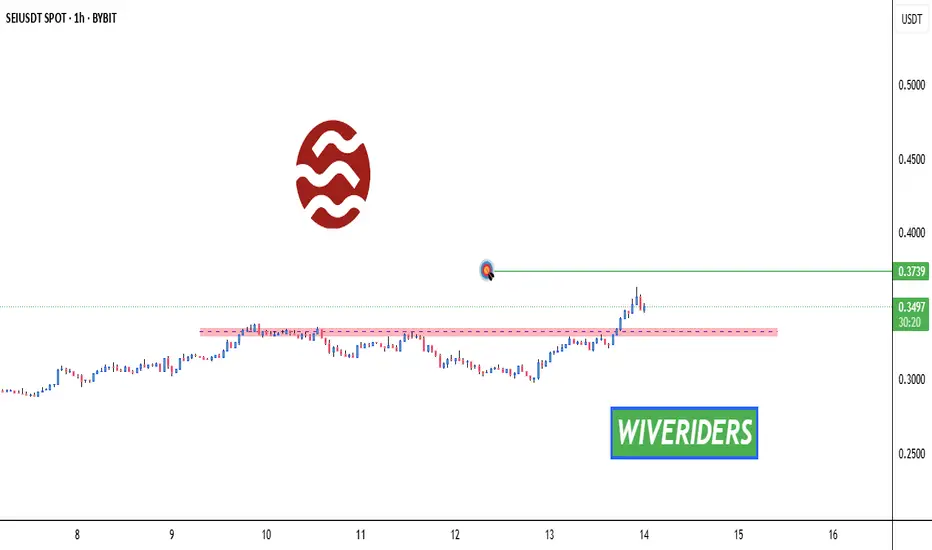
SEI Breakout Alert – Target in Sight! 🚨 SEI Breakout Alert – Target in Sight! 🟢🚀
SEI has successfully broken out of the red resistance zone.
📊 Price is now on track toward the first target at the green line level.
A breakout here confirms bullish momentum and could trigger further upside if volume supports the move.
#SEI/USDT The best future belongs to this coin.#SEI
The price is moving within an ascending channel on the 1-hour frame, adhering well to it, and is on track to break it strongly upwards and retest it.
We have support from the lower boundary of the ascending channel, at 0.2967.
We have a downtrend on the RSI indicator that is about to break and retest, supporting the upside.
There is a major support area in green at 0.2950, which represents a strong basis for the upside.
Don't forget a simple thing: ease and capital.
When you reach the first target, save some money and then change your stop-loss order to an entry order.
For inquiries, please leave a comment.
We have a trend to hold above the 100 Moving Average.
Entry price: 0.3080.
First target: 0.3221.
Second target: 0.3343.
Third target: 0.3522.
Don't forget a simple thing: ease and capital.
When you reach your first target, save some money and then change your stop-loss order to an entry order.
For inquiries, please leave a comment.
Thank you.

Clean Elliot & Added Line Break for those types of tradersBullish Looking trend on Sei coin could be a bit of fun if you up for it. Elliot seems to work out via the rules of Elliot wave. Clear break in diagonal resistance as seen, so hopefully the breakout traders will find this one tasty. Nice Bullish Divergence on the rsi as well which is my fav indicator.... Macro All still looking strong... you know we are in a bull trend...
SEI has broken out of the falling channel!SEI has broken out of the falling channel
After trading inside a downward-sloping channel for several weeks, SEI has finally broken above the trendline with strong momentum. Price is currently retesting the breakout zone near \$0.32–\$0.33.
If this level holds, we could see a continuation move toward the \$0.50 area. But if it drops back below \$0.31, the breakout may fail and SEI could return to the previous range.
For now, the structure looks bullish,but confirmation depends on holding above the breakout.

SEI Long / Buy Intraday SetupSEI bounced well from weekly Bullish retest, Now if sei manges to close above 0.3660 on 4hrs then it can lead to 0.48 next. For now wait for the entry , take small entry on mention point and second from dca point and tp given. Don't hold any trade must use sl.

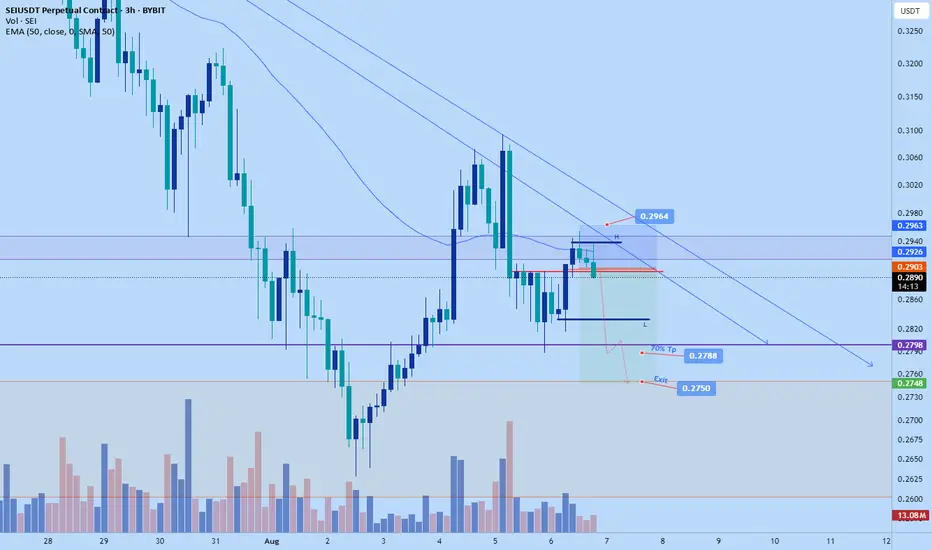
Sei short to $0.2750Just recently opened up a short position on sei. Aiming for $0.2750
Time sensitive
sl: 0.2964
$SEI signals a strong BUY opportunity! The SuperTrend indicator turned bullish just as the price hit the channel's lower edge, suggesting a possible climb toward $0.54. Over the past 24 hours, SEI edged up by 1.22%, trailing the crypto market's 1.58% rise, following a 6% dip this week. This upward shift seems driven by a technical recovery, ecosystem progress, and market optimism.
- Network Boost: Binance reopened SEI deposits and withdrawals after a successful upgrade, improving liquidity.
- Regulatory Lift: The SEC’s clearer stance on staking has lifted DeFi spirits, matching SEI’s institutional appeal.
- Technical Recovery: The price rebounded near the $0.265 support level, with RSI (44.91) indicating a relief from oversold conditions.
#SEI #Crypto #DeFi #Trading


Sei short to $0.2556 todayOpened a short position on sei just now. Aiming for $0.2556
market likely to push for another low again.
Sl: $0.2808
Tp: 0.2556
Market might push up a bit more. I didn't wait for ideal confirmation but invalidation is valid.

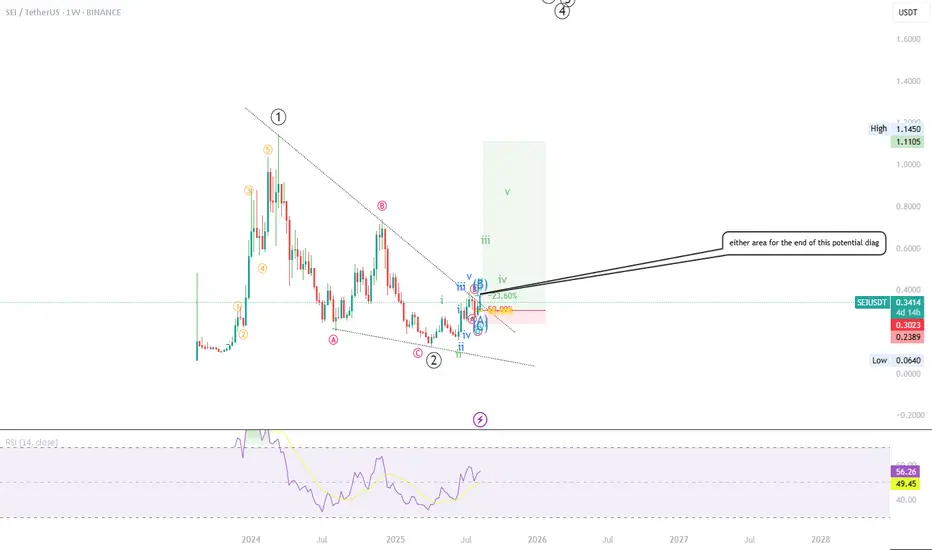
SEI | Full AnalysisHere is the top-down analysis for Sei as requested 🫡
Weekly Timeframe:
We have a potential large structure forming on the weekly chart that will be activated once we break the ATH. Its target zone lies between $1.8 and $2.2.
My sell targets for SEI this cycle are:
TP1: $0.73
TP2: $1.14
TP3: $1.83
These are my sell targets based on my technical analysis. However, I won’t rely on them alone — I also follow several on-chain indicators. Once retail euphoria kicks in and my indicators trigger, I’ll start selling accordingly.
Daily chart:
On the daily, we have a sequence that has already been activated and almost reached its target zone. That’s why the B–C correction level remains a valid buy zone, which I’ll also use for additional long entries.
This would be the second attempt from a B–C correction level, as we’ve already tapped it once (where I went long) and I’ll be entering again here.
Target zone for this sequence: $0.39–$0.44
Local Price action:
On the lower timeframe, we’ve just completed a bearish structure that perfectly overlaps with the B–C correction level. This increases the probability of this setup significantly, as both sides (bulls and bears) want the same thing here: bulls are buying the market, while bears are covering shorts and taking profits.
-----
Thats the my full Analysis for SEI, hope it was helpful if you want me to do another analysis for any other pair just comment down below.
Also, if anyone is interested in how my trading system works, let me know and I’ll post some educational content about it.
Thanks for reading❤️

SEI/USDT at a Critical Level Golden Pocket Reaction Will Define?🔍 Technical Analysis:
1. Market Structure:
SEI/USDT is in a recovery phase after a significant downtrend.
Price is currently testing a crucial area between the Fibonacci retracement levels of 0.5 (0.2778) and 0.618 (0.2515) — known as the Golden Pocket Zone.
2. Key Support & Resistance Levels:
Strong support lies within the highlighted yellow zone (0.2515 – 0.2778), a historical support-resistance flip level.
Key resistance levels to watch:
🔸 0.3521
🔸 0.4715
🔸 0.5936
🔸 0.7025
🔸 0.9407
🔸 1.1361
---
📈 Bullish Scenario:
If price holds above the golden pocket:
A strong rebound is likely, forming a higher low structure.
Bullish confirmation occurs if price breaks and closes above 0.3521 with strong volume.
Upside targets: 0.4715 → 0.5936 → 0.7025 in sequence.
🔹 Additional Confirmation: Bullish reversal patterns (e.g., bullish engulfing or pinbar) around 0.25–0.28 would strengthen the bullish outlook.
---
📉 Bearish Scenario:
If the price breaks below the 0.2515 level:
It could trigger a deeper move toward 0.22 – 0.18 support area.
Further breakdown may bring price below the psychological level of 0.15.
🔻 Bearish confirmation if the price gets rejected from the 0.30–0.35 region with strong bearish candles.
---
📊 Pattern Insight:
Potential Double Bottom formation near the golden pocket zone.
A break above the 0.3521 neckline would validate this bullish reversal pattern.
---
🔖 Conclusion:
This zone (0.25–0.28) is a make-or-break area for SEI. A strong reaction from this golden pocket will determine whether SEI is ready to rally further or fall to new lows.
#SEI #SEIUSDT #CryptoAnalysis #AltcoinUpdate #TechnicalAnalysis #Fibonacci #SupportResistance #GoldenPocket #CryptoTrading #SEIpriceprediction

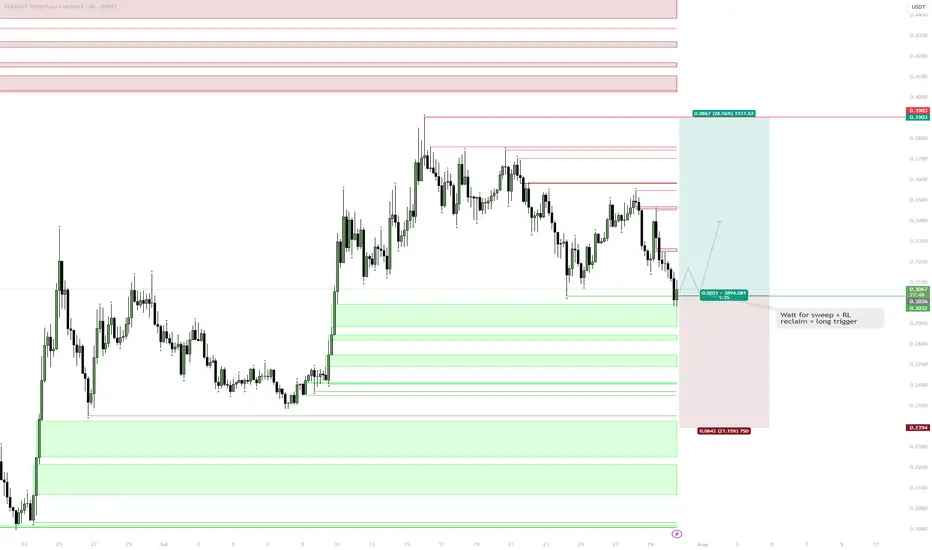
SEI | Setup: Sweep & Reclaim Scenario:Wait for a sweep of the range low (RL) into the Daily FVG (gray box).
Look for a reclaim of RL as the trigger for a long.
Reasoning:
Sweep into FVG traps late sellers and sets up liquidity for a reversal.
Reclaiming RL after the sweep signals strength and confirms a local bottom.
No need to chase entries—best R:R is after liquidity is cleared and level is retaken.
SEI $0.33 back to ath?SEI since December bearish momentum to June.
Around June the bullish momentum started.
We´re looking for NYSE:SEI to continue and break through support at $0.34.
Macd = Avg Bullish
Rsi = Avg Bullish
Stoch Rsi = Bullish
If this zone holds, the risk/reward setup favors bulls with clear upside targets.
Chart is based on rsi, macd, stoch rsi
#crypto #cryptocurrency #altcoins

Sei long to $0.3556just now opened up a long position on sei. Aiming for 0.3556
Tp1: $0.35
Tp2: $0.3556
Sl: $0.3374
