AMAZONAMZN is almost ready to push up further to take ATH.
Disclosure: We are part of Trade Nation's Influencer program and receive a monthly fee for using their TradingView charts in our analysis.
Next report date
—
Report period
—
EPS estimate
—
Revenue estimate
—
217.3 THB
2.04 T THB
21.94 T THB
9.66 B
About Amazon.com, Inc.
Sector
Industry
CEO
Andrew R. Jassy
Website
Headquarters
Seattle
Founded
1994
ISIN
TH0809121401
FIGI
BBG01TZGQMT3
Amazon.com, Inc. is a multinational technology company, which engages in the provision of online retail shopping services. It operates through the following segments: North America, International, and Amazon Web Services (AWS). The North America segment offers retail sale of consumer products, including from sellers, advertising, and subscriptions services through North America-focused online and physical stores. The International segment focuses on retail sale of consumer products, including from sellers, advertising, and subscription services through internationally-focused online stores. The AWS segment is composed of global sales of compute, storage, database, and other services for start-ups, enterprises, government agencies, and academic institutions. The company was founded by Jeffrey P. Bezos in July 1994 and is headquartered in Seattle, WA.
Related stocks

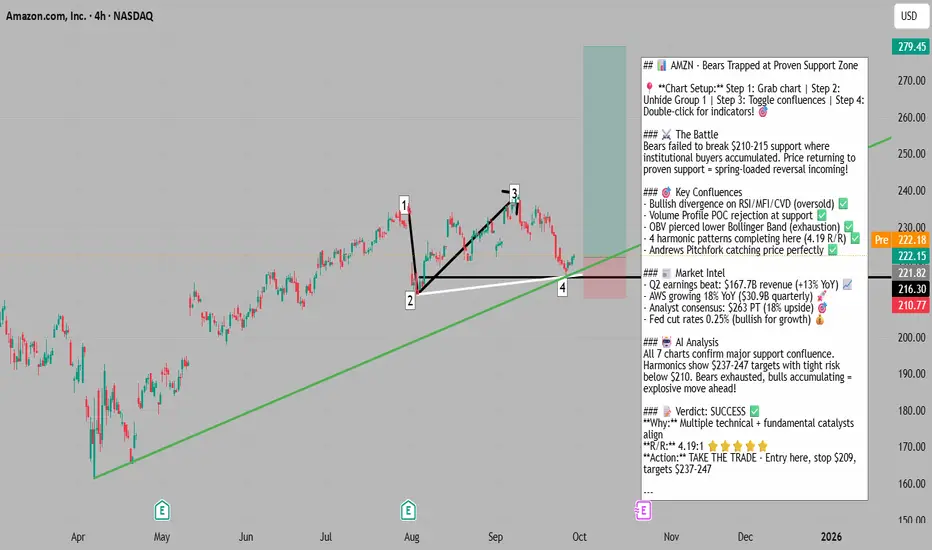
Bears Exhausted at Support - Spring-Loaded Reversal📍 To see my confluences and/or linework: Step 1: Grab chart 📊 Step 2: Unhide Group 1 in object tree 🌳 Step 3: Hide and unhide specific confluences one by one 🔍 Step 4: Double-click the screen to reveal RSI, MFI, CVD, and OBV indicators with divergence markings! 📈
🎯 AMZN: Bears Exhausted at Suppo
Amazon Can Stabilze Near $210Amazon has been pulling back lately, and I’ve been tracking this as a potential wave four flat correction, with wave A and wave B already completed and wave C now eyeing the support around 210. That zone also lines up with the 0.382 Fibonacci retracement and previous breakout levels, so it could att

Breaking: AMZN Bullish Trend Near Key Breakout Levels Current Price: $219.51
Direction: LONG
Targets:
- T1 = $230.00
- T2 = $245.00
Stop Levels:
- S1 = $215.00
- S2 = $210.00
**Wisdom of Professional Traders:**
This analysis synthesizes insights from thousands of professional traders who closely monitor the unique dynamics surroun

AMZN Oct. 1 – Testing $220 Pivot, Which Side Breaks First?Intraday View (15-Min Chart)
AMZN sold off sharply and is now consolidating under a descending trendline near $219. Momentum remains bearish, but support around $218–$219 is trying to hold.
* Support Levels: $218.95, $217.93, $216.48
* Resistance Levels: $220.20, $222.54, $224.81
* Indicators: MACD

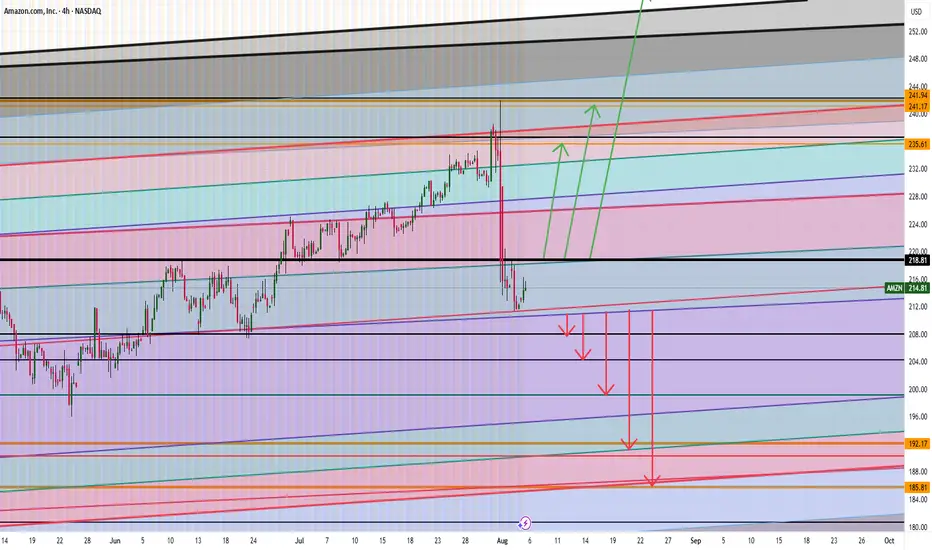
AMAZON ARE WE HEADING TO $258 ? HERE IS THE FULL ANALYSIS Hi Trading fam
So we have Amazon and based on what we are seeing we see two scenarios playing out:
Bullish:
If we can break and hold above 219 then we can see levels of : 235,241,and 258 being hit
Bearish:
If break the low of 210 then we hit 207,204, 199, 190 and then 185
Trade Smarter Li
AMZN SHORTAMZN Sitting on a Cliff…
Amazon’s hanging out right on a key trendline around $220. If it holds, cool maybe we bounce. But if it breaks… could get ugly.
Price is testing support from the March uptrend.
Not much volume below = could drop fast if it slips.
Big support zone around $187–$184 (Fib le

Amazon Building Launch Pad - ABC Flat Appears as if this is forming a perfect ABC Flat correction, however tis market is so bull it may start next week from this price, if we can get some seasonal weakness in October hoping it fills the GAP. Leg into longs if it continues to decline.
But interestingly enough, what I have found in th

AMAZON STOCKS AMAZON stocks pulled out of trend and picked liquidity and back on bullish path, the key drivers for the uptrend will be the following investment into critical infrastructure its building with a strong diversified portfolio in the following
Amazon Web Services (AWS) Growth:
AWS remains Amazon’s la

Startups Reshaping the Global Market1. The Rise of Startups: An Overview
Historically, innovation was primarily the domain of large corporations and research institutions. However, over the past two decades, the entrepreneurial landscape has shifted dramatically. Several factors have contributed to the meteoric rise of startups:
Tec

See all ideas
Summarizing what the indicators are suggesting.
Oscillators
Neutral
SellBuy
Strong sellStrong buy
Strong sellSellNeutralBuyStrong buy
Oscillators
Neutral
SellBuy
Strong sellStrong buy
Strong sellSellNeutralBuyStrong buy
Summary
Neutral
SellBuy
Strong sellStrong buy
Strong sellSellNeutralBuyStrong buy
Summary
Neutral
SellBuy
Strong sellStrong buy
Strong sellSellNeutralBuyStrong buy
Summary
Neutral
SellBuy
Strong sellStrong buy
Strong sellSellNeutralBuyStrong buy
Moving Averages
Neutral
SellBuy
Strong sellStrong buy
Strong sellSellNeutralBuyStrong buy
Moving Averages
Neutral
SellBuy
Strong sellStrong buy
Strong sellSellNeutralBuyStrong buy
AMZN4531868
Amazon.com, Inc. 4.25% 22-AUG-2057Yield to maturity
5.38%
Maturity date
Aug 22, 2057
US23135CC8
Amazon.com, Inc. 3.25% 12-MAY-2061Yield to maturity
5.33%
Maturity date
May 12, 2061
US23135CK0
Amazon.com, Inc. 4.1% 13-APR-2062Yield to maturity
5.33%
Maturity date
Apr 13, 2062
US23135CJ3
Amazon.com, Inc. 3.95% 13-APR-2052Yield to maturity
5.30%
Maturity date
Apr 13, 2052
AMZN5182959
Amazon.com, Inc. 3.1% 12-MAY-2051Yield to maturity
5.29%
Maturity date
May 12, 2051
US23135BT2
Amazon.com, Inc. 2.5% 03-JUN-2050Yield to maturity
5.29%
Maturity date
Jun 3, 2050
AMZN4996701
Amazon.com, Inc. 2.7% 03-JUN-2060Yield to maturity
5.29%
Maturity date
Jun 3, 2060
AMZN4531866
Amazon.com, Inc. 4.05% 22-AUG-2047Yield to maturity
5.25%
Maturity date
Aug 22, 2047
AMZN5182958
Amazon.com, Inc. 2.875% 12-MAY-2041Yield to maturity
5.04%
Maturity date
May 12, 2041
US23135AQ9
Amazon.com, Inc. 4.95% 05-DEC-2044Yield to maturity
5.03%
Maturity date
Dec 5, 2044
AMZN4531864
Amazon.com, Inc. 3.875% 22-AUG-2037Yield to maturity
4.72%
Maturity date
Aug 22, 2037
See all AMZN01 bonds
Curated watchlists where AMZN01 is featured.


