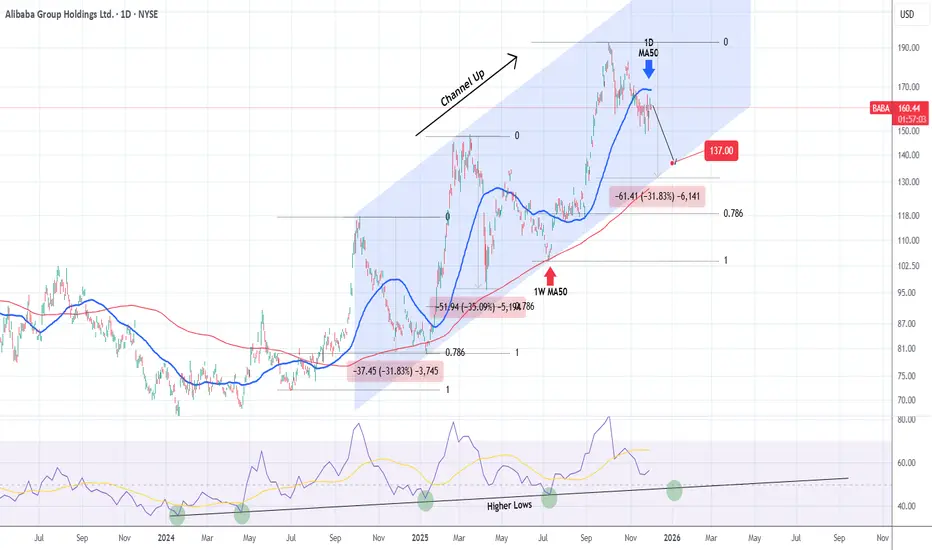
ALIBABA This correction isn't over.Alibaba (BABA) has been trading within a Channel Up since the October 07 2024 High. Right now it is on the 3rd Bearish Leg of this pattern, confirmed below the 1D MA50 (blue trend-line).
Both previous Bearish Legs touched the 1W MA50 (red trend-line) and the 1W RSI Higher Lows trend-line.
We expect that to happen at $137.00 (at least), which still puts the stock above both the 0.786 Fibonacci retracement level of the Bullish Leg and the -31.83% drop of the first Bearish Leg.
---
** Please LIKE 👍, FOLLOW ✅, SHARE 🙌 and COMMENT ✍ if you enjoy this idea! Also share your ideas and charts in the comments section below! This is best way to keep it relevant, support us, keep the content here free and allow the idea to reach as many people as possible. **
---
💸💸💸💸💸💸
👇 👇 👇 👇 👇 👇
Alibaba Group Holding Limited Units Thailand Depositery Receipts Repr 0.01 Sh
No trades
Trade ideas
BABA🌎Alibaba's AI Ambitions Gain Momentum: Qwen's Record-Breaking Launch and Strategic Investments
Alibaba is experiencing strong growth, fueled by the impressive success of its AI assistant, Qwen. Just a week after the public beta release, the app has surpassed 10 million downloads, marking the fastest launch of any such tool in history.
This success signals the company's decisive entry into the consumer AI market and strengthens its position as a direct competitor to ChatGPT and other global leaders in generative AI.
Why Qwen is More Than Just a Chatbot
The company positions Qwen as an "intelligent gateway to everyday life."
Unlike many Western subscription-based models, Alibaba is emphasizing a freemium model and deep integration of AI into its ecosystem. Plans include implementing "agent-based AI" features to automate tasks such as food ordering, travel booking, and shopping on platforms like Taobao.
The app is currently available in China, but an international version is expected soon.
Sizable Investments and Financial Results
To support its ambitions, Alibaba is mobilizing significant resources. The previously announced AI investment plan of RMB 380 billion (~$53 billion) over three years demonstrates a scale comparable to that of American IT giants.
These investments are already bearing fruit:
Revenue Growth: In Q1 FY26, revenue from the Cloud Intelligence division grew 26% year-on-year to RMB 33.4 billion, largely driven by strong demand for AI computing power and cloud services.
Explosive Growth in AI Products: Revenue from AI-based products has shown triple-digit growth for the eighth consecutive quarter, demonstrating the active adoption of technology by enterprises in China.
Increasing the profitability of the cloud business, which is under pressure from the high cost of building AI infrastructure, remains a key challenge.
Technological Innovation in the Face of Restrictions
In response to US export restrictions, Alibaba is finding creative ways to improve efficiency. Aegaeon's recently introduced GPU pooling system dramatically reduces dependence on Nvidia chips. During beta testing, this technology reduced the number of GPUs required by 82%—from 1,192 to 213—to support dozens of AI models.
This achievement highlights the company's ability to mitigate the impact of sanctions through software optimization.
Alibaba is one of the few global platforms offering a full stack of AI services. Strategic investments in promising areas such as international expansion and partnerships (for example, upcoming XPeng robotaxis trials using Amap maps in 2026) provide the foundation for long-term growth.
On the downside, the current stock valuation is already overly optimistic, and sustaining accelerated growth requires continued high investment and impeccable strategy execution.
In our view, we are in Wave 4, where after a strong momentum, the stock needs a breather to continue its growth.
In general, we don't see the stock being distributed. Many factors point to a correction to future growth.

BABA long-term TAOk Alibaba, it's in a good and strong uptrend on weekly time frame and it has a potential to continue its growth even the next year. Yes it has recently released its AI app, but don't be too excited yet, don't pay too much attention to the news, BABA is currently in distribution on mid-term which has started about a week ago, and any pump is a danger. Watch for $146 level to hold the support, if it's broken it may dive all the way to $130ish area.
Alibaba Group Holding Limited ($BABA) Announced Q4 Earnings Alibaba Group Holding Limited (BABA) announces her earnings reports today before the bell. The stock is up 5% with RSI at 47 NYSE:BABA shares are eyeing the $200 resistant should bullish momentum increase.
In the news, Alibaba reported cloud computing revenue up 34% year-on-year in its fiscal second quarter, beating market expectations. Investors are focused on Alibaba’s cloud division which books its revenue related to artificial intelligence.
In September, the company said it plans to increase spending on AI models and infrastructure development, on top of the 380 billion yuan ($53 billion) over three years it announced in February. Alibaba said on Tuesday it has spent around 120 billion yuan in capital expenditure toward AI and cloud infrastructure over the past four quarters.
In 2024, Alibaba's revenue was 996.35 billion, an increase of 5.86% compared to the previous year's 941.17 billion. Earnings were 129.47 billion, an increase of 62.36%.
Analyst Summary
According to 13 analysts, the average rating for BABA stock is "Strong Buy." The 12-month stock price target is $187.31, which is an increase of 16.54% from the latest price.
About BABA
Alibaba Group Holding Limited, through its subsidiaries, provides technology infrastructure and marketing reach to help merchants, brands, retailers, and other businesses to engage with their users and customers in the People's Republic of China and internationally. It operates digital retail platforms under the Taobao and Tmall names; wholesale marketplaces through 1688.com and Alibaba.com; global e-commerce platform under the AliExpress name; e-commerce platforms under the Lazada, Trendyol, and Daraz names;

BABA – Earnings Setup for This Week (Tuesday)Hello Everyone, Followers,
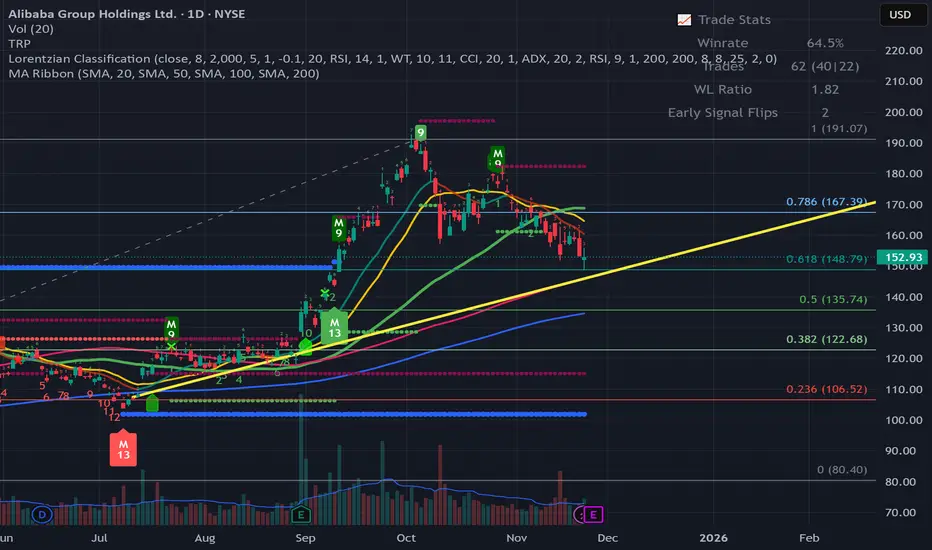
BABA is heading into Tuesday’s earnings with price sitting around 152.93, pulling back toward key support after getting rejected near recent highs. The chart is lining up for a potentially volatile reaction, and the current structure gives some clear levels to work with.
🔹 Trend Structure
Price is still respecting the broader ascending trendline (yellow), which has supported the medium-term uptrend.
Short-term momentum is softening — moving averages are compressing and curling down slightly as the market waits for earnings.
🔹 Support & Resistance
Immediate Support: 148.8
Immediate Resistance: 160–163
Major Resistance: 167–168
A break below 148.8 would be the first bearish confirmation. Holding here keeps the bullish scenario alive.
🔹 Earnings Scenarios
Bullish Setup
Hold above 148.8
Reclaim short-term MAs
Targets → 160 and 168
Bearish Setup
Break below 148.8
Drop into 135.00 - 136.00
Bigger downside only on bad guidance
🔹 Outlook
BABA trades right on a critical Fib support ahead of earnings. Trendline support remains intact, and buyers typically defend this region. If earnings are even moderately good, this setup has space to recover toward the mid-160s.
A breakdown opens a cleaner path toward the 135 area.
🔹 My Plan
I’m watching the 148.8 → 150 zone closely.
If it holds: I expect a bounce toward 160 → 167.
If it breaks: I’ll wait patiently for 135 before planning any long positions.
No rushing here — earnings will decide the next leg.
This is just my thinking and it is not invesment suggestion , please do not make any decision with my anaylsis.
Have a lovelly Sunday to all and Good Start a Week.
$BABA | Macro + Technical ConfluenceNYSE:BABA | Macro + Technical Confluence
Current setup: Descending wedge at 0.618 fib ($158) after Premium rejection at $192. RSI neutral at 45.
Macro Catalysts:
Cloud AI segment +34% YoY — 7 straight quarters of triple-digit AI growth
Qwen AI model outperforming ChatGPT in certain benchmarks
Fed rate cut expected Dec 17-18 (risk-on for emerging markets)
$50.5B net cash + $11.9B buybacks + $4B dividends
Headwinds:
Pentagon "Chinese military company" watchlist designation
Margin compression from AI capex & quick commerce investments
Schall Law Firm investigating potential securities claims
Probability Assessment:
28 Buy / 1 Hold / 0 Sell — Strong Buy consensus
Avg PT: $203 → 28% upside from current
PT range: $174 low / $230 high
P/E ~18x vs US AI peers at 30-50x
My levels:
Entry zone: $148-151 (0.5 fib sweep)
First target: $182 (0.886)
Extended target: $226 (1.618)
Invalidation: Below $115 Strong Low
Risk/reward favors patience for liquidity grab into discount zone before continuation.
— WaverVanir

QuantSignals V3 BABA — Katy AI Flags Strong Bearish SetupBABA QuantSignals V3 Weekly 2025-11-25
Ticker: BABA
Current Price: $164.52
Signal Type: Weekly (V3)
Direction: BUY PUTS
Confidence: 58%
Conviction: Medium
Trend / Weekly Momentum: BEARISH (-1.99% 1W)
Volatility: High (Earnings Event)
🎯 Trade Setup
Strike: $165 PUT
Expiry: 2025-11-28 (3 days)
Entry Range: $7.70 – $7.85
Target 1: $11.70
Target 2: $15.60
Stop Loss: $5.85
Position Size: 2–3% (reduced due to high event risk)
🧠 Key Insights
Katy AI projects a drop to ~$154.01 (-6.4%) over the next 3 days
Chart shows bearish continuation, with resistance $168.88 and support $148.64
Volume 2.3× last week suggests institutional distribution
Options flow neutral (PCR 0.90), but high activity at $150 puts indicates downside hedging
Earnings today → high volatility & uncertainty
⚠️ Risk Notes
HIGH RISK WARNING
Earnings catalyst may cause oversized swings — use smaller size
Gamma acceleration may increase moves into Thursday/Friday expiry
📌 Summary
BABA weekly outlook is bearish with moderate confidence. Katy AI direction, technicals, and weekly momentum align, supporting a short-term PUT setup. Use tight risk control due to earnings-day volatility.
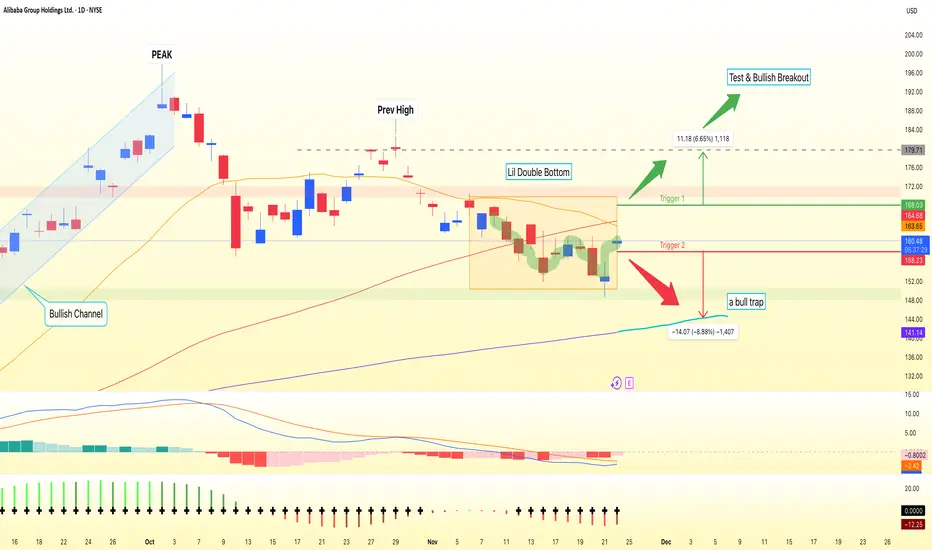
BABA Breakout WatchBABA’s daily chart has shifted from a strong August–October rally into a corrective phase, with price now around 160 and printing a clear sequence of lower highs and lows. Price sits below the MA20 and MA60 but still above the rising MA120 near 141. This keeps the broader uptrend technically alive while short-term pressure remains bearish. A potential Double Bottom is developing in the 150–153 demand zone, with a strong bullish reaction from the second trough and a neckline around 168.
For bulls, the key is clearing the moving-average “ceiling” first. A daily close above 165 would show that buyers are absorbing supply at resistance and open the path toward a retest of the 168 neckline. A confirmed daily close above 168 would validate the Double Bottom and put 175–179 initially, and then 184, on the radar as measured-move targets. For this bullish idea, a sustained move back below 158, and especially a break under 150, would be a clear invalidation and shift focus back toward 148–144 near the MA120.
If price instead loses 158 on a daily close without ever reclaiming 165, the bounce looks more like a relief rally inside the downtrend, with sellers likely pressing for a deeper test of 150 and potentially 144. Until either 165 breaks topside or 158 fails, expect noisy consolidation between support at 150 and resistance near 165. This is a study, not financial advice. Manage risk and invalidations.
Thought of the Day 💡: Let the level confirm the idea, not the other way around.
------------------------
Thanks for your support!
If you found this idea helpful or learned something new, drop a like 👍 and leave a comment, I’d love to hear your thoughts!
BABA Winds Have Shifted - Macro EntryAs always, I try not to publish trades without having a big view of multiple factors so this one is based on a long term view over the next 1-2 years.
Macro: I have outlined China's Central Bank (PBoC) liquidity injections (through reverse repo and MLF data) as very seasonal at the bottom pane on the chart. I do NOT believe history or seasonals should dictate future action but it is worth noting the seasonal nature of the PBoC liquidity injections and we are seeing an early rise in total and frequency since June. In fact, a recent print on 8/15 was the biggest spike since the height of 2023. China is also coming out of the rough no tolorence policy during the "pandemic" so some of their stocks are poised for major breakouts. That said, the U.S. M2 money supply is breaking out of a range with global liquidity on the rise heading into central bank easing around the world. No doubt we have some volatility in global liquidity ahead (US debt ceiling to name one) but the general trend is up and to the right over the next 2 years once we get through the vol.
Price Action: As I mentioned, the price of this stock has been on a downward trend since Fed Funds rates started moving up in 2021 and has completed the bearish bat making 3 consecutive higher highs since the low in 2023. Looking at Fibonacci the targets are clear but for target 2 I am looking at the massive gap from end of 2021. My first exit before the stop loss would be losing any of the recent higher highs and the S/L is set to under the 2023 low. However, I would rely on the macro section more than price action for the exit.
Timeline: I am a 3 month to many year investor not a day trader so this is one I will layer in and buy dips for the next few months. I did take a 5% position at the entry point noted. I do think the next 2-3 years will be net positive for liquidity and assets.
Thanks

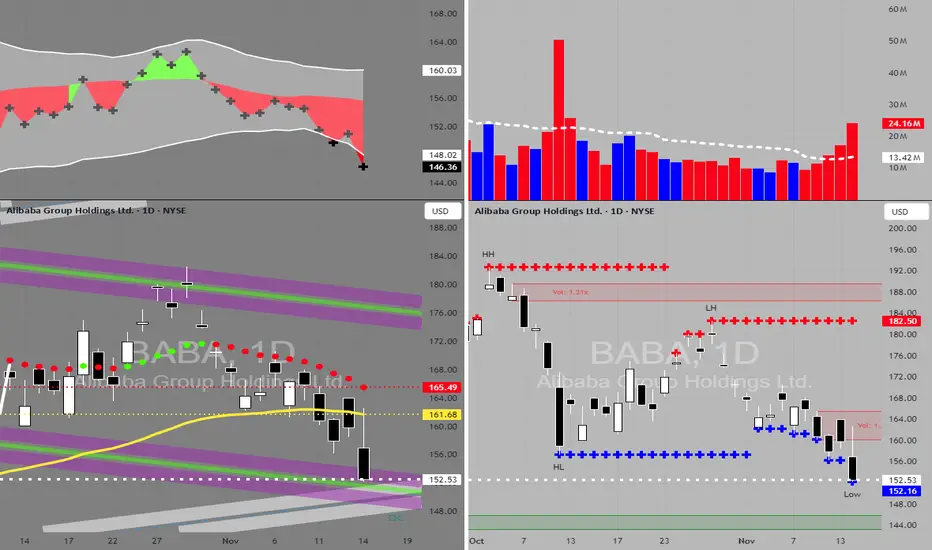
BABA in BUY ZONEMy trading plan is very simple.
I buy or sell when at either of these events happen:
* Price tags the top or bottom of parallel channel zones
* Money flow volume spikes beyond it's Bollinger Bands
So...
Here's why I'm picking this symbol to do the thing.
Price in buying zone at bottom of channels
Money flow momentum is spiked negative and under bottom of Bollinger Band
Entry at $152.20
Target is upper channel around $176 (best case) or moving average around $162
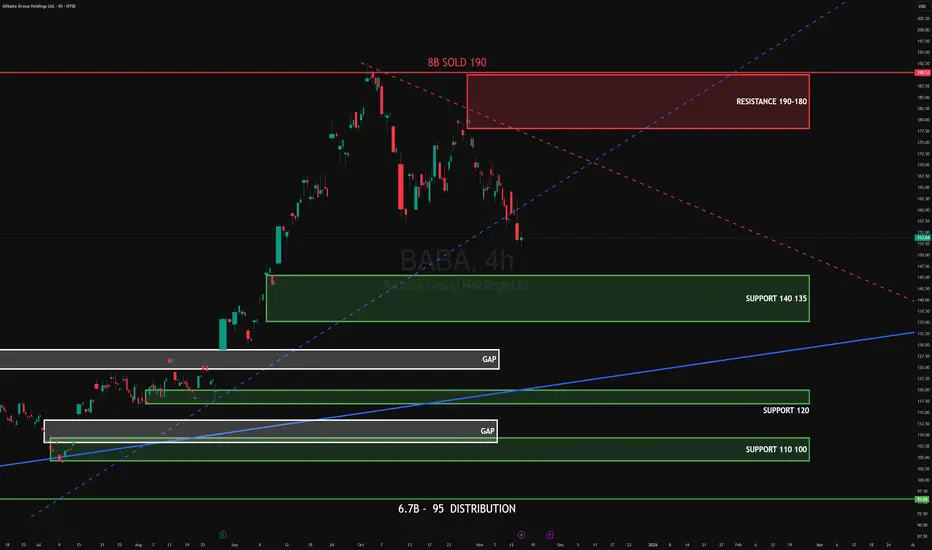
BABA NOV 2025BABA rejected 190-180 distribution, sellers in control.
Watching 140-135 support.
Upside tgt 180-190,
downside 140-135.
#BABA #globaltrade #investment #investing #stockmarket #wealth #realestate #markets #economy #finance #money #forex #trading #price #business #currency #blockchain #crypto #cryptocurrency #airdrop #btc #ethereum #ico #altcoin #cryptonews #Bitcoin #ipo
QuantSignals V3 | BABA Put Signal — Maximize Reversal Potential🧭 Overview
Ticker: BABA
Current Price: $161.93
Trend: Overbought / Mixed
Confidence: 60%
Expiry: 2025-11-21 (7D)
Strike: $157.50
📊 AI & Technical Forecast
Katy AI Target: $159.42 (-1.55%) by week’s end
Extended Series: Downtrend toward $158.58 (-2.07%) by 11/20
RSI: 73.9 → overbought, high reversal potential
EMA / MACD: Diverging momentum, weakening bullish trend
VWAP: $161.40 → mean reversion pressure
Insights:
Price at 94.7% of weekly range → extreme overextension
News catalysts mixed: AI Mode rollout and ChatGPT competitor → initial bullish; hedge fund profit-taking → bearish
Options Flow: PCR 1.92 → institutional bearish positioning, smart money hedging
🎯 Trade Setup
Parameter Value
Direction PUT
Strike $157.50
Entry $1.91
Target 1 $2.87 (+50%)
Target 2 $3.82 (+100%)
Stop Loss $1.34 (–30%)
Position Size 3% of portfolio
⚡ Key Advantages
Contrarian setup: overbought RSI + institutional put-heavy flow
Friday expiration → gamma effects amplify put premium expansion
Tight 30% stop loss limits downside
Delta –0.301 balances probability and payout
Timing Edge:
Weekly expiration compresses timeframe; downside moves accelerate profit potential
Price near top of weekly range → asymmetric risk/reward
🚨 Risk Notes
Low AI confidence (50%) → speculative
Friday expiration → active monitoring required
Break above $164.36 → exit immediately
Positive AI/tech news could override technical forecast

$BABATechnical Outlook for NYSE:BABA : Navigating Key Levels After a Strong Rally
NYSE:BABA has demonstrated significant strength over the past several months, establishing a well-defined and respected upward trendline on its chart. This consistent pattern of higher lows indicates sustained bullish momentum and has been the foundational support for the rally.
The key to determining the next major directional move lies in observing how the price interacts with critical Fibonacci retracement levels, drawn from the stock's previous significant swing low to its recent high.
Key Support Levels to Monitor:
Our primary support levels, derived from the Fibonacci sequence, are:
First Support (0.382 Fib): $144.52 - This is the most immediate and crucial level. A bounce here would suggest the underlying bullish trend remains intact, with the momentum merely pausing.
Second Support (0.5 Fib): $129.65 - This level represents a halfway retracement of the recent upswing and is a common area for buyers to re-enter.
Major Support (0.618 Fib): $114.78 - A deeper retracement to this level would signal a stronger pullback but would still keep the primary bullish structure alive from a classical technical perspective.
Critical Scenario for a Trend Reversal:
The most immediate threat to the current bullish structure would be a decisive break below the $144.52 level. Such a move would accomplish two technically significant events simultaneously:
It would breach the 0.382 Fibonacci support.
It would likely break the upward trendline that has guided the stock higher for months.
A confirmed break below this confluence of supports would be a strong indicator that the uptrend has exhausted itself in the short term, opening the door for a more pronounced downtrend. In this scenario, the market would then likely target the next supports at $129.65 and $114.78.
Ultimate Major Support:
Beyond the Fibonacci levels, the psychological and technical $100 mark stands as the ultimate major support. A decline to this level would represent a full retracement of the recent bullish wave and would be a critical make-or-break zone for the long-term outlook of the stock.

ALI BABA HIGH PROBABILITY SETUP SOON!!!🚨 BABA HIGH PROBABILITY BUY SETUP 🚨
* Here We Can See Clearly The Next Potential Moves For BABA Coming Hours/Days.
* Keep Your Eyes Close On Your Trading Positions.
* Happy PIP Hunting Traders.
FXKILLA.

BABA Breakout Watch: Close Above 171 Opens Path to 190Alibaba (BABA) ripped higher from late August and topped near $190 in early October. Since then, price has been correcting inside a descending channel while holding above the 60-day moving average. Short-term momentum has cooled (MACD histogram negative), but the broader structure remains constructive: buyers defended the $158.00 demand zone and price is compressing toward the channel’s upper boundary.
Primary path: I’m looking for a daily close above ~$171.00 (break and hold over the channel top / short-term resistance) to signal a continuation of the prior uptrend. If confirmed with rising volume, the next waypoint sits near the upper band/near-term supply around $175.00–$180.00, followed by a retest of the October highs into $190.00–$191.50. That area remains the key supply zone where the last rally stalled.
Alternative: If buyers fail and $158.00 gives way, the corrective leg likely extends. A decisive break of that floor would put the lower channel line in play and opens room toward the next major support clustered around the 120-day context near $140.00. For positioning, longs can lean on $158.00 as the clean invalidation; below there, the bullish thesis is off the table.
This is a study, not financial advice. Manage risk and invalidations

BABA QuantSignals V3 Weekly 2025-11-05BABA QuantSignals V3 Weekly 2025-11-05
BABA Weekly Signal | 2025-11-05
• Direction: BUY CALLS | Confidence: 55%
• Expiry: 2025-11-07 (2 days)
• Strike Focus: $165.00
• Entry Range: $2.42
• Target 1: $3.50
• Stop Loss: $1.80
• Weekly Momentum: NEUTRAL (+0.60% 1W)
• Flow Intel: Neutral | PCR 1.18
• Max Pain: $170.00 (+2.5% vs spot)
• 🔴 HIGH RISK WARNING: Use only small position size due to lower confidence and high uncertainty.
⚖️ Compliance: Educational commentary for QS Premium members only. No financial advice.
🎯 TRADE RECOMMENDATION
Direction: BUY CALLS
Confidence: 55%
Conviction Level: LOW
🧠 ANALYSIS SUMMARY
Katy AI Signal: Katy AI shows NEUTRAL trend with HOLD signal, but the price target of $164.88 suggests a slight bearish tilt (-0.6% from current). This creates fundamental conflict with my analysis.
Technical Analysis: Current price $165.80 near session lows, down 6.49% on the day. Weekly momentum neutral but with +1.46% two-week bullish trend. EMA alignment shows bullish confirmation. Key resistance at $168.29 (Katy's stop level), support at $161.70 session low.
News Sentiment: Bullish catalysts with recent AI trading success stories highlighting Alibaba's AI outperforming competitors. Positive sector momentum in AI technology, though general market sentiment remains cautious.
Options Flow: Neutral put/call ratio of 1.18 suggests balanced positioning. Unusual activity at $205 put indicates institutional hedging. Max pain at $170.00 provides upward pressure target.
Risk Level: HIGH - Katy AI shows neutral/bearish bias conflicting with bullish trade setup. Low conviction due to mixed signals and short 2-day window.
💰 TRADE SETUP
Expiry Date: 2025-11-07 (2 days)
Recommended Strike: $165.00
Entry Price: $2.35 - $2.48
Target 1: $3.50 (49% gain from entry)
Target 2: $4.20 (79% gain from entry)
Stop Loss: $1.80 (24% loss from entry)
Position Size: 1% of portfolio (low conviction due
Image
QS Analyst
APP
— 5:37 PM
to Katy conflict)
⚡ COMPETITIVE EDGE
Why This Trade: Combovershoots Katy's conservative target with strong AI news catalyst and max pain level alignment
Timing Advantage: Mid-week positioning before weekly expiration gamma squeeze potential
Risk Mitigation: Strike selection at $165 provides favorable delta (0.573) with current price action support
🚨 IMPORTANT NOTES
⚠️ CRITICAL CONFLICT: Katy AI shows NEUTRAL/HOLD with $164.88 target (-0.6%) while this is a CALL recommendation. This trade goes against Katy's primary signal.
⚠️ Extremely short timeframe (2 days) increases gamma risk significantly
⚠️ Low volume session (0.1x average) reduces momentum confirmation
⚠️ Only for experienced traders comfortable with high-risk weekly options
📊 TRADE DETAILS 📊
🎯 Instrument: BABA
🔀 Direction: CALL (LONG)
🎯 Strike: 165.00
💵 Entry Price: 2.42
🎯 Profit Target: 3.50
🛑 Stop Loss: 1.80
📅 Expiry: 2025-11-07
📏 Size: 1.0
📈 Confidence: 55%
⏰ Entry Timing: N/A
🕒 Signal Time: 2025-11-05 20:37:15 EST
🔴 HIGH RISK WARNING: Use only small position size due to lower confidence and high uncertainty.
$BABA | ABC Correction in Progress (VolanX DSS View)Alibaba is showing early signs of completing an ABC corrective structure on the daily chart.
🔹 Structure & Levels
Wave A: Initial impulse top near $187.5
Wave B: Mid retrace capped around $179–180 (current zone)
Wave C: Expected corrective leg aiming toward the $164.38 liquidity area, possibly extending into $148–150 if macro weakness persists
🔹 Key Observations
Price reacting sharply near Fib 0.786 retrace ($173–$176)
Daily structure aligning with macro consolidation phase
Below $170, downside acceleration likely toward the 200 EMA region
Bullish invalidation: Daily close above $187 (resets structure bias)
🔹 Outlook (VolanX DSS)
The VolanX DSS currently signals short-term exhaustion, suggesting probability of a corrective pullback before the next impulse leg.
Macro catalysts—China’s liquidity policy and USD strength—remain the key external variables for direction confirmation.
🎯 Projected Zones
Near-term retrace: $164.38
Deeper support: $148.21
Long-term target post-reset: $213.66+
⚙️ Analysis generated with VolanX DSS (LSTM + Liquidity-Flow hybrid).
📊 Educational content. Not financial advice.

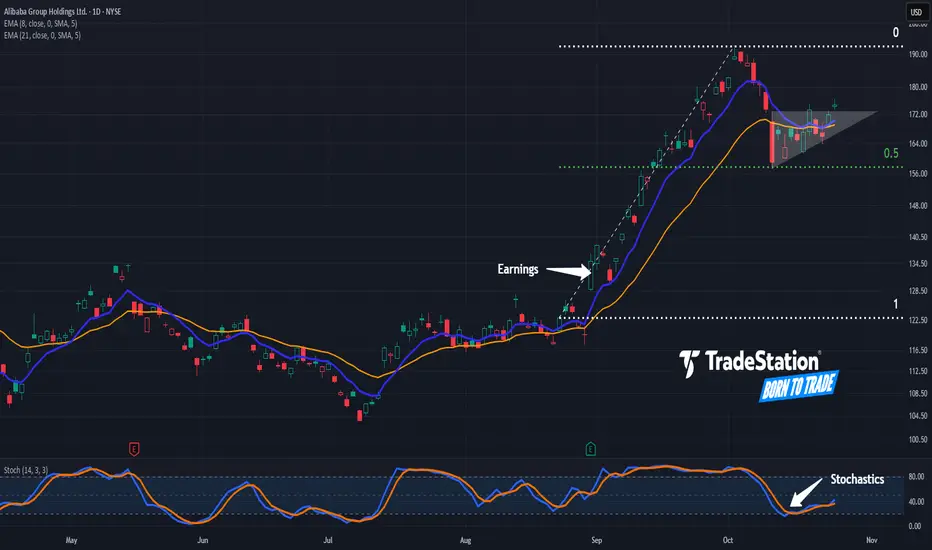
Potential Continuation Patterns in AlibabaAlibaba rallied in September. Now, after a pullback, some traders may see potential for continuation.
The first pattern on today’s chart is the advance between August 22 and October 2. The Chinese e-commerce giant stabilized after retracing half the move, which may suggest its direction remains upward.
Second, you have the series of higher lows since October 10 with prices mostly trapped below $173. That ascending triangle may be viewed as a bullish continuation pattern.
Third, the 8-day exponential moving average (EMA) has remained above the 21-day EMA.
Next, stochastics are rebounding from an oversold condition.
Finally, BABA is an active underlier in the options market. That could help traders take positions with calls and puts.
TradeStation has, for decades, advanced the trading industry, providing access to stocks, options and futures. If you're born to trade, we could be for you. See our Overview for more.
Past performance, whether actual or indicated by historical tests of strategies, is no guarantee of future performance or success. There is a possibility that you may sustain a loss equal to or greater than your entire investment regardless of which asset class you trade (equities, options or futures); therefore, you should not invest or risk money that you cannot afford to lose. Online trading is not suitable for all investors. View the document titled Characteristics and Risks of Standardized Options at www.TradeStation.com . Before trading any asset class, customers must read the relevant risk disclosure statements on www.TradeStation.com . System access and trade placement and execution may be delayed or fail due to market volatility and volume, quote delays, system and software errors, Internet traffic, outages and other factors.
Securities and futures trading is offered to self-directed customers by TradeStation Securities, Inc., a broker-dealer registered with the Securities and Exchange Commission and a futures commission merchant licensed with the Commodity Futures Trading Commission). TradeStation Securities is a member of the Financial Industry Regulatory Authority, the National Futures Association, and a number of exchanges.
Options trading is not suitable for all investors. Your TradeStation Securities’ account application to trade options will be considered and approved or disapproved based on all relevant factors, including your trading experience. See www.TradeStation.com . Visit www.TradeStation.com for full details on the costs and fees associated with options.
Margin trading involves risks, and it is important that you fully understand those risks before trading on margin. The Margin Disclosure Statement outlines many of those risks, including that you can lose more funds than you deposit in your margin account; your brokerage firm can force the sale of securities in your account; your brokerage firm can sell your securities without contacting you; and you are not entitled to an extension of time on a margin call. Review the Margin Disclosure Statement at www.TradeStation.com .
TradeStation Securities, Inc. and TradeStation Technologies, Inc. are each wholly owned subsidiaries of TradeStation Group, Inc., both operating, and providing products and services, under the TradeStation brand and trademark. When applying for, or purchasing, accounts, subscriptions, products and services, it is important that you know which company you will be dealing with. Visit www.TradeStation.com for further important information explaining what this means.
ALIBABA HIGH PROBABILITY SETUP SOON!!!🚨 BABA HIGH PROBABILITY BUY SETUP 🚨
* Here We Can See Clearly The Next Potential Moves For BABA Coming Hours/Days.
* Keep Your Eyes Close On Your Trading Positions.
* Happy PIP Hunting Traders.
FXKILLA.

Tutorial on Andrews Pitchfork on AlibabaThis is an analysis of Alibaba stock using the Andrews pitchfork.


Baba Price Reversal on Quarterly. Baba Is bullish again. This is a Quarterly chart.
Fair value Gap between $180-$204 on Quarterly chart.
Price action suggests Baba is poised to make big moves and it's P/E ratio is also only Around 12.
AI hype is coming too for Baba since they have Qwen AI on their hands.
Stop Loss and Target mentioned in the Post. Now let's see what happens.
P.S. This is not a financial advice. This is an educational and speculative post only. Do your own research.

Opportunity to buy Alibaba shares For those who are regretting not getting onboard the Alibaba ship earlier, now is your opportunity. It is highly likely that when HK market opens tomorrow, this counter will head south , hopefully 5-8% as the Alibaba shares in US market was down 8% upon closing last Friday.
The first buying zone will be between 147 - 150 price level. Here, you deploy your first tranche of capital. The all important news that everyone is waiting will be how China will retaliate next week given the new tariffs will be effective on Nov 1. I expect some volatility of both countries firing at one another (trade tactics) before we see some form of settlement before Nov 1. The game is nothing new.
If we are lucky and tech shares get sell down even more , then we can the price revisit the 118-128 price level. Here, you can deploy 20% more capital to go LONG.
The above analysis is based on one's conviction in Alibaba's fundamentals and future position in the AI space.
As usual, please DYODD.
