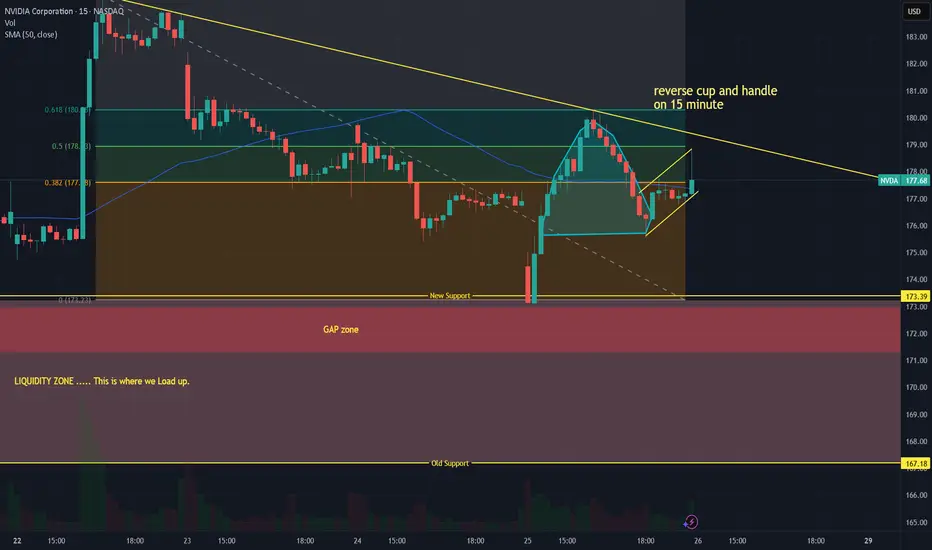
$NVDA Reverse cup and handle on 15 & 45 m...After a brutal day today in the Market. I am seeing a reverse cup and handle form on the 15- and 45-minute frames. There is huge Gap that has yet to be filled in the Liquidity zone at 172 & 171.
It would need to touch or break below $171 in order to close the Gap.
Personally, I would wait for that Gap to close and load up on Call options in Call Debit Spread for those who can't afford call premiums. THIS IS NOT FINANCIAL ADVICE.
I think if closes red tomorrow we could potentially see a Gap down next week Monday. Fib Retracement shows that it will duck down below. Potentially will see another red day tomorrow into next week.
AS ALWAYS THIS IS NOT FINANCIAL ADVICE, I AM A SELF-TAUGHT MARKET ANALYST THIS IS MY OPINION. GODBLESS YOU ALL, JESUS LOVES YOU.
NVDA03 trade ideas
NVDA at a Make-or-Break Zone – Can Bulls Push Back on Oct. 6? Market Overview (15-Min Chart)
NVIDIA continues to trade inside a well-defined downward channel, showing controlled selling pressure throughout last week. Each bounce attempt has been capped near the descending resistance line, currently near $188.80–$189, while support sits around $185.30–$186.
The MACD histogram has started to turn lighter red, with a potential bullish crossover forming beneath zero — an early sign of waning bearish momentum. Meanwhile, the Stochastic RSI has rebounded sharply from oversold levels and is now moving toward the upper band, indicating possible short-term upside before overbought exhaustion.
If NVDA can break above $188.50–$189, it could trigger a short-term shift from compression to expansion. However, if it rejects once more, the next retest of $185 could accelerate selling momentum.
GEX Validation (1H Chart Insight)
Gamma Exposure (GEX) levels on the 1-hour chart confirm a clear neutral-to-bullish setup if NVDA maintains above $185. The highest positive NET GEX / Call Wall aligns around $192.5–$195, suggesting strong dealer resistance in that region. A sustained breakout above $190 could ignite a push toward those upper zones if option flows turn supportive.
On the downside, Put support levels are clustered between $174–$180, forming a strong hedge-based demand area. The IVR of 9.8 and IVX avg 42.1 indicate a calm volatility environment, leaving room for expansion once direction confirms. Interestingly, Calls only account for 8.6% of flow — a potential contrarian signal if short-term momentum strengthens.
Trade Scenarios for the Week (Oct. 6–11)
Bullish Case:
If NVDA breaks and holds above $189, momentum could accelerate toward $191 (minor resistance) and potentially $195, where the next Call Wall sits.
* Entry: Above 189 confirmation
* Target 1: 191
* Target 2: 195
* Stop-Loss: Below 186
Bearish Case:
Failure to reclaim $189 and a breakdown below $185 could drag NVDA toward $182.50 or even $180, testing the lower bound of the Put Wall zone.
* Entry: Below 185
* Target 1: 182.5
* Target 2: 180
* Stop-Loss: Above 188
Option Insights
With gamma tightly balanced near current price, NVDA may be entering a coil phase before a directional break. Traders may look for short-term call spreads near 190–195 for upside confirmation, or put spreads near 185–180 if weakness resumes. The low IVR favors directional debit plays early in the week.
My Thoughts
This setup feels like a tug-of-war between dip buyers and short-term momentum sellers. NVDA’s structure suggests compression nearing resolution — the first clean break outside this falling channel will set the tone for the week.
If buyers can clear $189 with conviction, the path to $192–195 opens quickly. If not, the bears will likely reassert pressure back toward $182. The MACD and Stoch RSI alignment suggest a short-term bounce first, but the broader trend remains fragile until the channel is broken decisively.
Disclaimer:
This analysis is for educational purposes only and does not constitute financial advice. Always perform your own due diligence and manage your risk responsibly before trading.

Tops in? or 1 more high left...Yea I think this may have topped or it squeezes out one more cheeky high - regardless it's going to correct hard and fast - expect it to -50% gl.
TA Never Fails, But Traders Often Do
Why Technical Analysis Doesn’t Fail, and How to Make It Work for You
Has it ever happened to you that your system or technical analysis gives you the perfect signal… and the trade still goes wrong? And then, other times, with the exact same pattern, everything clicks magically and you end up with textbook profits, the kind proudly posted on social media.
Every trader has felt that same confusion at some point. At some stage in their career, every trader has questioned whether technical analysis really works. And if that question still lingers unanswered in your mind, this post is for you.
Here, I’ll walk you through why technical analysis sometimes seems to work like magic and other times fails miserably, and, more importantly, how understanding its true role can turn it into a tool that meaningfully strengthens your trading
Understanding the Real Role and Reach of Technical Analysis
At its core, technical analysis (TA) studies past price and volume behavior. But here’s the key point many overlook: expecting it to predict the future with certainty is like assuming that because something happened under certain conditions once, it will play out exactly the same way again. That’s rarely true.
When you rely on a chart pattern or setup, what you’re really hoping for is that the market environment hasn’t changed much. But markets don’t stay still. They are dynamic, adaptive, and constantly shifting. That’s why sometimes the “perfect” signal delivers textbook profits… and other times it collapses into a loss.
I’m sure you can relate: you spot the perfect setup, take the trade with full confidence, everything looks aligned, and then Powell makes a comment, volatility spikes, and your stop is hit in seconds. Did technical analysis fail? Not really. The conditions changed, and the past environment could not be reproduced.
From this perspective, TA stops being a deterministic tool (“if price breaks support, the market will fall”) and becomes a probabilistic one (“if price breaks support, there’s a certain probability the market will fall”). This isn’t a weakness, it’s an honest recognition of the uncertainty that governs financial markets and their ever changing nature.
When we strip away the myths and put technical analysis in its rightful place, it becomes clear: at best, TA allows us to frame probabilities, never certainties. It’s not a crystal ball, it’s a framework for making informed probabilistic assessments in a world that will always remain uncertain.
Where the True Power of TA Really Lies
Take the classic example: “if price breaks support, the market has a higher probability of falling than of rising.” That statement doesn’t promise certainty, but if it turns out that, say, 60% of the time the market does fall after breaking support, then you’ve uncovered something valuable: an edge.
And here’s where trading shifts from chasing luck to building consistency. If out of every 10 trades, 6 follow through in your favor, then all you really need is solid risk management, for example, keeping a minimum 1:1 risk to reward ratio. Do that, and over the long run you don’t just “sometimes win,” you run a system with a positive expectancy.
Once you’ve found that edge, the real trick is repetition. And this isn’t just motivational talk, it’s math. Statistics has a law (and in science, a law means tested truth) that guarantees the more you repeat your process, the closer your actual results will move toward that expected 60/40 edge. With discipline and patience, the math will always pull you back toward being a long term winner.
This also means you don’t second guess yourself the next time the market breaks support just because the last time it didn’t work out (thanks, Powell). You keep playing your probabilistic edge. The outcome of a single trade is irrelevant, what matters is the process repeated over time. I wrote about this earlier, and it’s worth remembering: consistency in applying your edge always beats obsessing over one result.
TA as a Compass, Not a Crystal Ball
The smartest and most effective use of technical analysis is not to predict exact prices, but to build a probabilistic edge.
TA only becomes truly powerful when it’s integrated into a system with positive expectancy, not when it’s treated like an oracle. It’s not about guessing where the next tick will land, but about shaping a repeatable process that, over time, compounds into long term gains.
Seen in this light, TA stops being a magic wand and instead becomes a compass, a steady guide to help you navigate with consistency. You don’t need to know the exact shape of every curve in the road. What you need is a reliable compass and a clear map that, with enough repetition, will get you to your destination.
How to Make TA Not Fail You
The key takeaway is simple: the problem isn’t that technical analysis “fails,” but how we interpret it and what we expect from it. Demanding certainty only leads to frustration and blinds us to its real value.
Used probabilistically and as part of a structured system, TA becomes a valuable ally. So the next time that ‘perfect setup’ fails, don’t waste energy asking what went wrong. You already know, it’s just uncertainty doing its job. Don’t let it shake your confidence, and don’t let Powell, or anything else, ruin your day. Instead, focus on the next repetition, because that’s where your edge truly lives.
The market doesn’t owe you certainty. But with an edge and discipline, probability will reward you with consistency, and that’s what compounds into real results
________
👉 If you’d like to dig deeper into this mindset shift, check out my earlier post on True Laser Vision, where I explain why projecting the value of your account is infinitely more powerful than trying to project the price of an asset. And if you’d like a more structured walk through these ideas, visit my profile, you’ll find plenty of posts where I break down how probability, expectancy, and discipline can catapult your trading to the next level. Follow along if you want to keep sharpening these skills
NVDA: A new ATH, at what cost?As NVDA climbs to new ATH’s, it still struggles to break through resistance. it’s my belief that we revisit 179 before seeing 200. thoughts are appreciated, thanks.
nvda bcs looks like exhaustion buying 4 days ago. Expecting NVDA to rest and consolidate with the market. Likely be able to btc this position for a small win in a week
if not, sideways action or bear action will turn this into a winner
$NVDA İS BREAKİNG UPNASDAQ:NVDA After breaking downtrend line sometimes it is like a default move the retest previous downtrend. expecting to get more strengt in this area and test 184.50 ATH. This setup is one of my farovite one.

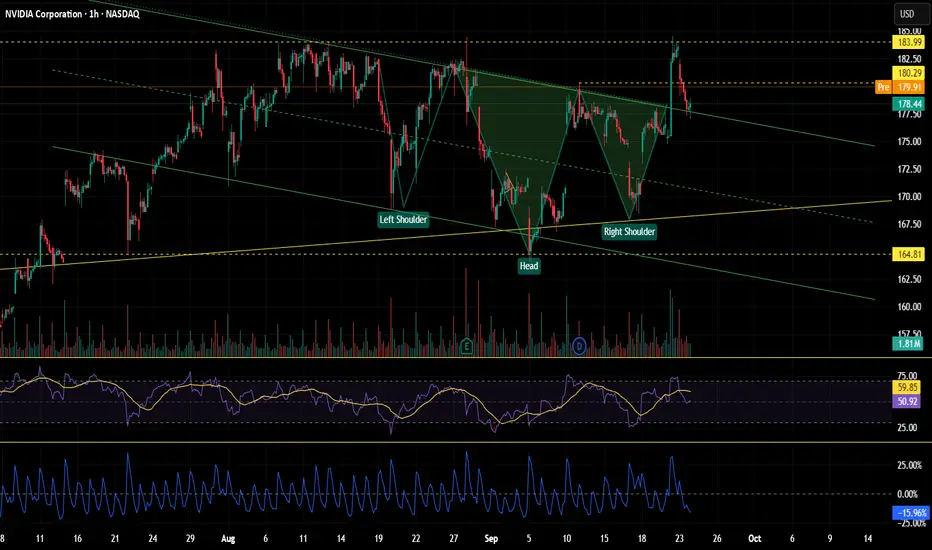
H&S on NVDA pullback immenentShort post:
Drawdown to 124$ levels is most likely and probably happens by end of Oct.

NVIDIA’s Decisive Battle at the $185 Resistance🔹 Short-Term Outlook (1–3 Weeks)
Current Situation:
NVIDIA (NVDA) is trading around $183.6, right below the critical $185 resistance—a level that has repeatedly capped the stock’s rallies.
Momentum & Pattern:
The price has reclaimed the 50-day moving average ($175.9) with a strong bullish candle, signaling renewed buying interest.
Bullish Scenario:
If NVDA breaks and holds above $185:
🎯 Target 1: $195
🎯 Target 2: $205
Bearish Scenario:
If the stock fails to break $185 and closes below $175:
❌ Short-Term Stop Loss: below $175
🎯 Downside Target: $165
🔹 Long-Term Outlook (2–6 Months)
Overall Trend:
The medium-term trend remains bullish, and a decisive breakout above $185 could ignite a new rally.
Bullish Scenario:
🎯 Medium-Term Target: $220
🎯 Long-Term Target: $250
Bearish Scenario:
If the stock loses the $160 support:
❌ Long-Term Stop Loss: below $160
🎯 Downside Target: $140
✅ Summary:
NVDA stands at a pivotal level. A breakout above $185 could open the door to $200 and higher, while rejection at this level risks a pullback toward $165.

NVDA LONG TRADING PLANDivergence on 1H RSI. He is Making a Support there. So there is o much chance it will brake the HH. But i am my canceling my Main order. i will wait if at my Entry there is Divergence or any news then i will Short there. Question me i will answer.

NVDA buy order
Price sold off at 178.04 the broke out showing that price is bullish the next time price is above 178.04
We see bullish structure (higher highs higher lows)
We see the textbook price action
Indication
Correction
Continuation
Good RR (1:3)
We also have Nvidia wanting to invest $100B into Chatgpt (Bit of fundamentals for ya)

$NVDA Cracks were already showing.NASDAQ:NVDA Cracks were already showing.
Momentum stalled, buyers hesitated, and the tape began to lean heavy.
That’s the trap.
Structure tells a different story.
When lower highs started stacking, the short wasn’t a guess — it was the only logical play.
The edge comes from seeing what others ignore:
That hesitation is often the first domino.
That failed breakouts fuel the breakdowns.
By the time the flush came, it looked obvious.
But the decision was made long before — risk mapped, bias clear, execution ready.
Most chase the move.
The prepared step into it.

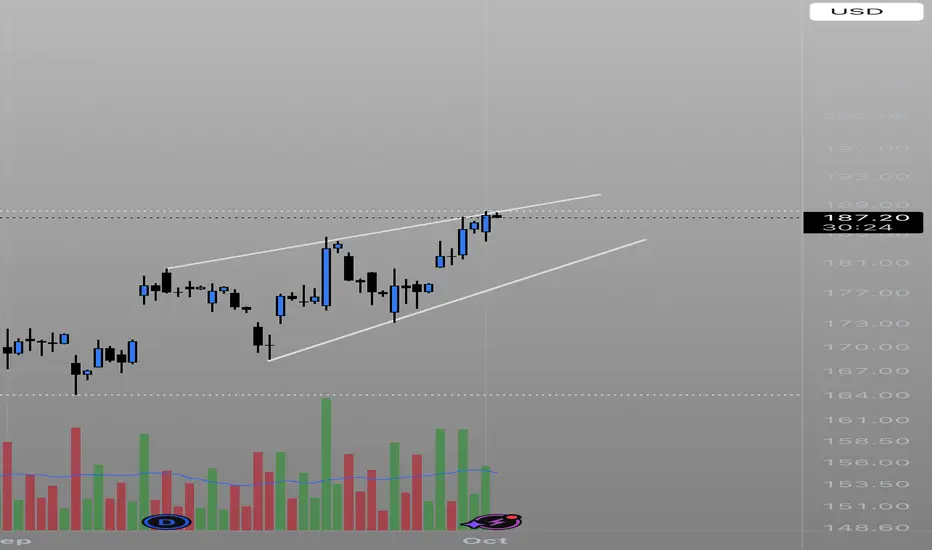
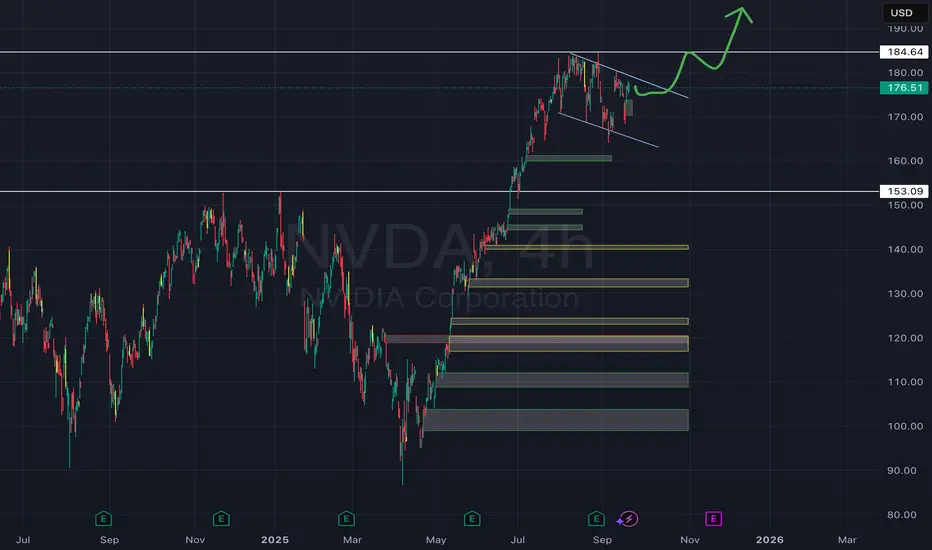
bull flag and inverse head and shoulder breakout retestOn monday 22sept we broke the bullflag/ descending channel and also inverse head and shoulders on the 4hour chart with high volume.
Yesterday we went for a retest of the breakout as expected to 177.6
the 4hours candle closed as a bullish hammer candle.
Todays expectation is nvidia to retest or break its ATH at 184.
If we break 184 today we are lookig at the target of the inverse head and shoulder by end of week wich is 195.
if you look at the rsi ,the rsi is not overbought anymore and made a higher high so no signs of the bears.
NVDA NVIDIA Corporation Options Ahead of EarningsIf you haven`t bought NVDA before the previous earnings:
Now analyzing the options chain and the chart patterns of NVDA NVIDIA Corporation prior to the earnings report this week,
I would consider purchasing the 150usd strike price Calls with
an expiration date of 2025-9-19,
for a premium of approximately $13.35.
If these options prove to be profitable prior to the earnings release, I would sell at least half of them.

Higher 4 longer.Bull flag here on the longer time framez should play out. Maybe chop sidewayz then push back to ATH. AI nerrative still strong n no reason 2 go heavy shortin this scam. If u short u better take ur money on those small downturnz cause trust me, they dont last!
$200 PTStrong move with Open AI investment announcement. Barely made a new 52 week high, looking for a strong continuation tomorrow; $200 price target as next milestone in price discovery.

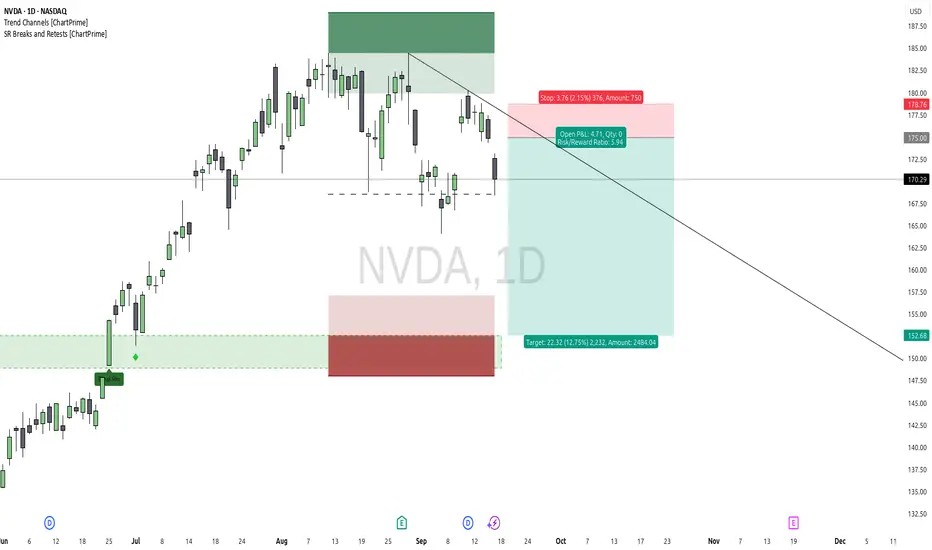
$NVDA: The River Changes Course - A Mean Reversion IdeaThe Technical Landscape
Our prior long setup on NASDAQ:NVDA was invalidated, providing us with the invaluable information that the bullish momentum has stalled. Following the Fed's announcement, the market's breath has changed. We now see a potential downtrend forming on the daily chart, with price creating lower highs and respecting a new descending trendline. The bears, who have been slumbering, appear to be waking up.
Instead of fighting this new current, we look to flow with it. The thesis is no longer about bullish continuation, but about a potential reversion to the mean. Price has a memory, and we are targeting a return to the scene of the previous major breakout, the demand zone around the $152 level. This is simply one piece of the puzzle, viewed without bias or ego.
The Philosophy - Listening When The Market Speaks
The trend is your friend, until it isn't. Our job is not to predict when the friendship will end, but to recognize when the dynamic has changed and act accordingly.
Our previous attempt at a long wasn't a failure; it was the market telling us, at a very small cost, that our hypothesis was incorrect for the current conditions. A limitless trader embraces this information with gratitude, for it protects us from the much greater cost of being stubborn. We are not "flipping" from bull to bear out of emotion. We are simply listening, adapting, and aligning with the price action that is presenting itself right now. Don't be a salmon, stubbornly fighting a new and powerful current. A limitless trader considers all outcomes, and right now, the path of least resistance appears to be pointing down.
An Illustrative Setup
Style: Short / Mean Reversion
Entry: An area of confluence around $175, near the descending trendline resistance.
Stop Loss: A defined stop above recent highs and trendline resistance at $178.75. If price breaks this level, our bearish thesis is invalidated.
Take Profit: Targeting the area of prior breakout, around $152.50.
Risk/Reward: Approximately 1 : 5.9
A safer, more conservative entry could be sought on a break and hold below the $168 support level, but always remember to manage your own risk based on your personal strategy.
Disclaimer: This is not financial advice. It is for educational and informational purposes only. Please conduct your own research and manage your risk accordingly.
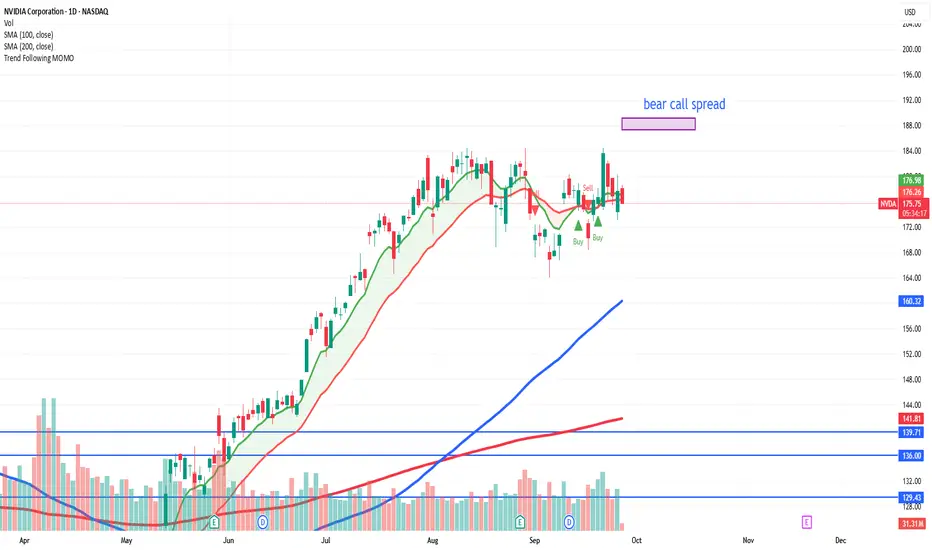
Nvidia Returns to Yearly Highs on Temporary Boost in ConfidenceNvidia’s stock started the week with a gain of more than 4%, maintaining a steady bullish bias after it was announced that the company will invest over $100 billion in OpenAI to support the development of artificial intelligence infrastructure. As part of the agreement, Nvidia is expected to receive OpenAI shares as compensation. This move reflects both companies’ commitment to sustained growth in the AI industry and suggests that Nvidia views this project as a key step to strengthen its position beyond microchip production, seeking to consolidate itself as a strategic player in the sector over the long term. For now, market confidence has fueled buying pressure, and if further announcements are made, this trend could continue to dominate in the short term.
Short-Term Sideways Range at Risk
In recent weeks, Nvidia’s price had been moving within a sideways range, with a ceiling near $183 per share and a floor around $162. However, the latest bullish momentum is pushing the stock to test this resistance. If buying pressure holds, the range could break out and pave the way for a more relevant bullish bias in the coming sessions.
RSI
The RSI line remains above the neutral level of 50, showing that short-term bullish momentum has begun to dominate the average of the last 14 sessions. As long as this trend continues and the indicator does not enter overbought territory, buying pressure could become even more relevant in the short term.
MACD
The MACD histogram has started to show oscillations above the neutral 0 level, suggesting that the average strength of the moving averages has entered a steady bullish zone. If this signal persists, it could open the door to a stronger bullish bias in the short term.
Key Levels to Watch:
$183 – Yearly Resistance: Marks the yearly high and is the most important barrier in the short term. A sustained breakout above this level could drive the continuation of the broader bullish trend seen in recent weeks.
$173 – Nearby Barrier: Aligns with the zone marked by the Ichimoku cloud. Price action around this level could generate neutrality and extend the ongoing sideways formation.
$162 – Critical Support: Matches the 100-period moving average and the 23.6% Fibonacci retracement. A break below this support would activate a more relevant bearish bias, opening the door to a short-term downtrend.
Written by Julian Pineda, CFA – Market Analyst

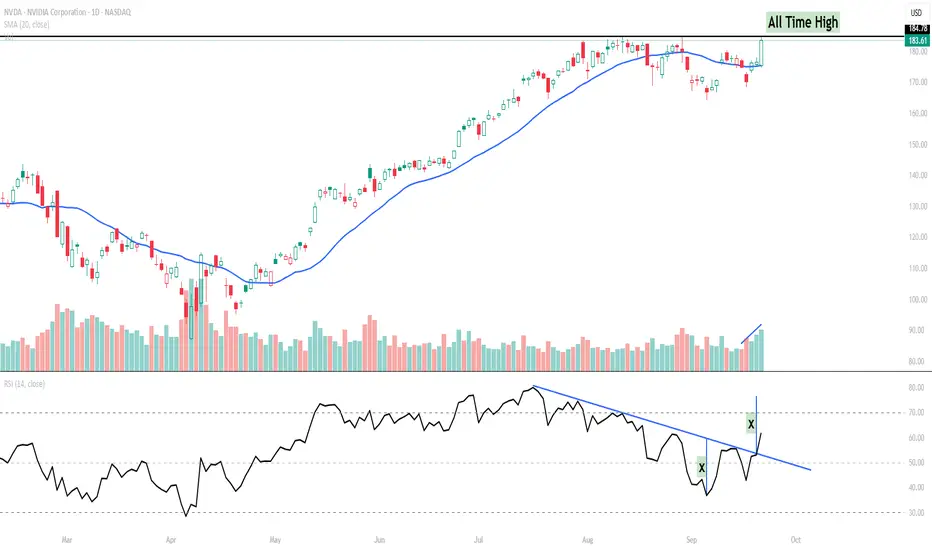
NVIDIA (NVDA) – RSI Trendline Breakout Signals Momentum Shift NVIDIA has staged a sharp move higher, reclaiming momentum after weeks of sideways-to-lower action. What makes this setup notable is not just the price, but the RSI trendline breakout.
Key Points:
RSI Trendline Breakout: The RSI broke above a descending trendline, suggesting momentum is shifting back in favour of buyers.
Volume Confirmation: The breakout coincided with a strong volume spike – often an early tell that institutions are stepping in.
Price Action: Price is now retesting the all-time high zone (~$184–185). A sustained close above this level could open the door for further upside.
Short-Term View: As long as NVDA holds above the $175–177 support zone, the bias remains bullish with potential for acceleration if RSI pushes toward the overbought zone.
Watchlist Levels:
Upside breakout trigger: $185+ (new all-time high)
Immediate support: $175
Momentum invalidation: Below $175
This is a classic case of how RSI trendline analysis can provide an early signal, often before price fully confirms the breakout.
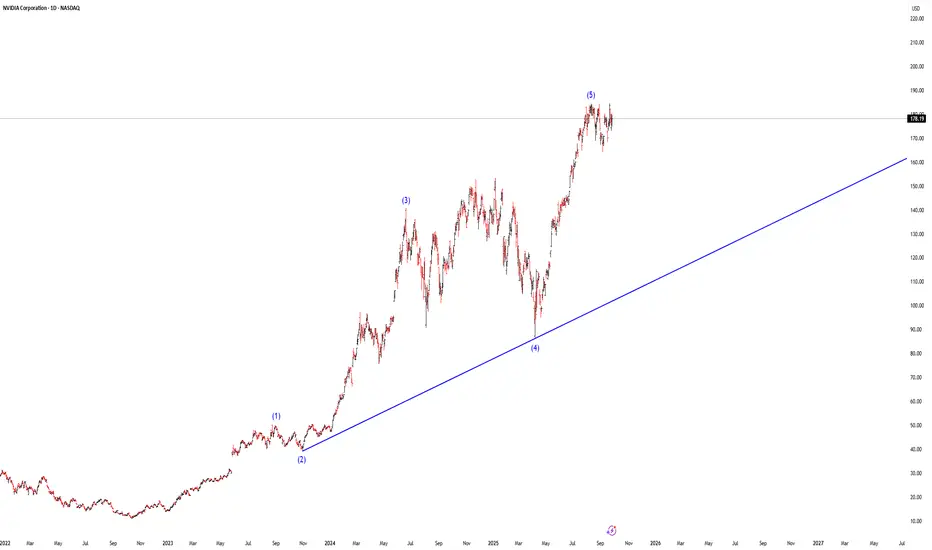
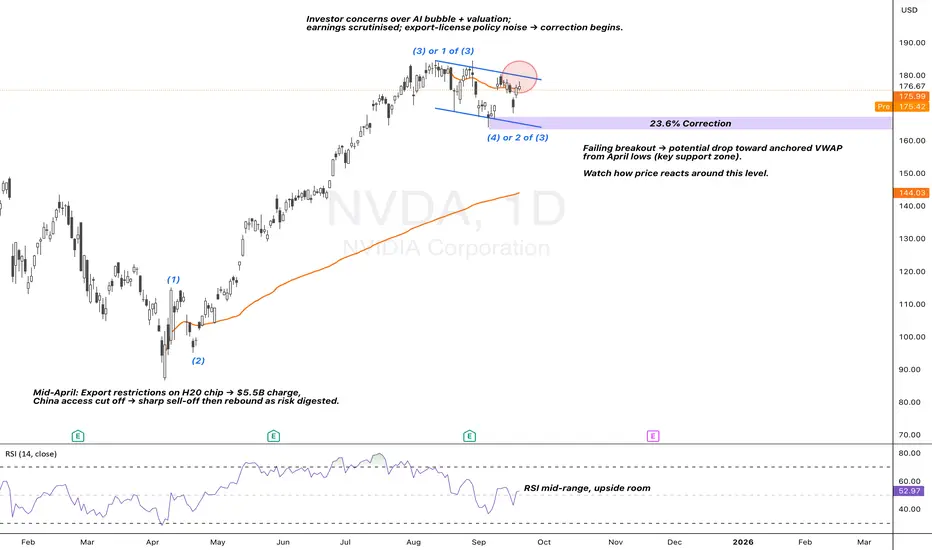
NVDA | Wave (3) in Play at Key Consolidation ZoneNVIDIA’s rally since April was powered by AI infrastructure demand and a rebound in risk sentiment after tariff and export-control concerns were digested. Strong hyperscaler capex and global AI partnerships reinforced the bottom-up story, while a broader tech bid lifted growth equities. Yet, the same catalysts pose risks: valuation stretch, regulatory noise, and questions on AI monetisation timelines leave room for volatility.
Technical Lens:
Price action suggests NVDA is tracking a larger wave (3). However, the sub-wave structure remains unproven, with only a shallow 23.6% retracement, leaving scope for further correction. Current consolidation sits at a decision point, supported by RSI, which remains mid-range with room to extend higher.
Scenarios:
If breakout holds: Momentum can carry into the next impulsive leg of wave (3), supported by structural demand.
If breakout fails: Price could rotate lower toward the anchored VWAP from April 2025 lows, a key support zone.
Catalysts:
Ongoing AI-driven hyperscaler spend and sovereign partnerships (upside).
Renewed U.S.–China export restrictions or capex digestion (downside).
Macro policy shifts and market positioning into year-end.
Takeaway:
This is a consolidation decision point within wave (3). Breakout = continuation, failure = correction toward April VWAP support.
Nvidia and OpenAI Announce Partnership, NVDA Shares SurgeNvidia and OpenAI Announce Partnership, NVDA Shares Surge
Yesterday it was revealed that leading chipmaker Nvidia and leading artificial intelligence research laboratory OpenAI have announced a strategic partnership, under which Nvidia will invest $100 billion in OpenAI.
A network of data centres will also be created to train and operate the most advanced artificial intelligence models:
→ the network will be based on Nvidia’s next-generation platform, Vera Rubin;
→ the network’s total capacity is unprecedented, reaching 10 gigawatts;
→ the first phase of the project is expected to launch in the second half of 2026.
Nvidia (NVDA) shares reacted sharply to the news. During Monday’s trading, 22 September, the company’s stock price jumped by roughly 4%, climbing at yesterday’s high above $184.30 (marking a new all-time record, as shown on the chart). The chipmaker’s market capitalisation closed in on $4.5 trillion, cementing its status as the most valuable company in the world.
Technical Analysis of Nvidia (NVDA) Chart
Previously, in our 1 September analysis of NVDA, we:
→ plotted an ascending channel describing NVDA’s price movements following the bullish impulse at the end of June;
→ noted unsuccessful attempts by the bulls to break resistance at $183, which provided grounds to view the chart in the context of a Triple Top pattern (1-2-3);
→ assumed that the bears were exerting pressure on an overvalued stock and considered a correction scenario.
Since then, the Nvidia stock price corrected to $165, from where it resumed its upward trend (shown with a broken arrow).
The new data provide grounds to:
→ expand the channel (shown in blue) without changing its slope, adding the QH and QL lines to divide the wider channel into quarters;
→ plot the trajectory of the correction (in red).
Within this context, it is reasonable to assume that:
→ the stock price of NVDA found support at the QL line and moved up towards the midline;
→ the red lines form a Bullish Flag pattern;
→ yesterday’s rise broke out of this corrective pattern, with the bulls attempting to resume the upward trend, though the $183 level still provides resistance.
It is not excluded that the strong fundamental background, the development of AI technologies, and the supportive driver of the Fed’s rate cut may ultimately enable the bulls to overcome the $183 level, paving the way for NVDA’s share price to approach the psychological $200 mark.
This article represents the opinion of the Companies operating under the FXOpen brand only. It is not to be construed as an offer, solicitation, or recommendation with respect to products and services provided by the Companies operating under the FXOpen brand, nor is it to be considered financial advice.
NVIDIA Corporation (NVDA) Expands AI Chip LeadershipNVIDIA Corporation (NVDA) is a global leader in graphics processing units (GPUs) and AI computing platforms. Best known for powering gaming, data centers, and professional visualization, NVIDIA also drives innovation in autonomous vehicles, healthcare, and supercomputing. The company’s growth is fueled by explosive demand for AI chips, the rise of cloud computing, and its ability to expand GPU technology into nearly every corner of the digital economy.
On the chart, a confirmation bar with rising volume highlights bullish momentum. The price has entered the momentum zone after climbing above the .236 Fibonacci level. A trailing stop can be placed just below this Fibonacci line using the Fibonacci snap tool, helping traders lock in profits while staying positioned for more potential upside.

$NVDA 15-Min: The God Candle That Spoke Loudest NASDAQ:NVDA exploded on the 15-minute chart today.
One bar, full conviction — the type of move traders call a god candle.
But here’s the truth: it isn’t about chasing candles.
It’s about having a process that makes you ready when they appear.
The groundwork is done before the bell.
Pre-market calculations define the risk, filter the noise, and set the stage for the opening drive.
When the signal aligns, you don’t predict — you execute.
Most of the time, the market is noise.
Occasionally, it speaks clearly.
Your job is to cut the losers fast, let the winners breathe, and keep showing up until the edge reveals itself.
