Breaking: Nvidia ($NVDA) Crush Q3 Earnings Nvidia ( NASDAQ:NVDA ) stock saw a noteworthy uptick of 5% in early Thursday premarket trading albeit market turmoil. The asset reported earnings yesterday after market close sparking bullish sentiment.
The asset is approaching the $200 resistant as the RSI is at 47 giving room for massive upside.
The Shares of Nvidia popped in premarket trade after the U.S. firm beat expectations in third-quarter results after the closing bell on Wednesday.
Shares were last trading 5.5% higher at 4:15 a.m. ET.
Nvidia topped forecasts for revenue, which jumped 62% to $57.01 billion year-on-year, and issued stronger-than-expected fourth-quarter sales guidance.
“There’s been a lot of talk about an AI bubble,” Nvidia CEO Jensen Huang told investors on an earnings call, as the firm set out its view of the industry. “From our vantage point, we see something very different.”
Financial Performance
In 2024, NVIDIA's revenue was $130.50 billion, an increase of 114.20% compared to the previous year's $60.92 billion. Earnings were $72.88 billion, an increase of 144.89%.
Financial Performance
In 2024, NVIDIA's revenue was $130.50 billion, an increase of 114.20% compared to the previous year's $60.92 billion. Earnings were $72.88 billion, an increase of 144.89%.
About NVDA
NVIDIA Corporation, a computing infrastructure company, provides graphics and compute and networking solutions in the United States, Singapore, Taiwan, China, Hong Kong, and internationally. The Compute & Networking segment includes its Data Centre accelerated computing platforms and artificial intelligence solutions and software; networking; automotive platforms and autonomous and electric vehicle solutions; Jetson for robotics and other embedded platforms; and DGX Cloud computing services.
Trade ideas

NVDA: 1 week before earnings effect. Supply-demand imbalance.Parretto principle (20-80): small important things can have great influence in grand scheme of things. Some events have greater weight, than say 80-90% of daily events.
Stocks move based on Supply-demand dynamics (disbalance etc), patterns or trends are just a feedback.
The problem with using charts as a feedback for strength (or feedback for S-D strength) is that: (1) on a expensive market, with extended prices (with high supply too), (2) during important NVDA earnings, it's almost predictable how markets would sink, or at least be volatile.
Demand stalls. Supply gets worried. Price down.
//People are risk averse. Hence.. predictable.

NVDA to $170? AI Bubble Risk, Big Money Exits & Heavy Shorts !I f you haven`t bought NVDA before the previous earnings:
Now you need to know that NVIDIA has dominated 2023–2025, becoming the face of the global AI boom. But the higher the climb, the harder the fall. While NVDA is still seen as “untouchable,” several major signals suggest the stock could revisit levels near $170 — a healthy correction of 10–15% from here.
1. Major Investors Are Exiting — SoftBank Dumped Everything
SoftBank, one of Nvidia’s earliest and most influential institutional backers, sold its entire stake in late 2025, worth roughly $5.8 billion.
Smart-money exits near all-time highs should never be ignored.
SoftBank rarely sells unless it believes:
- the sector is overheated
- the valuation has run too far
- risk/reward becomes asymmetric
This mirrors their strategy in 2021–2022 when they unloaded overvalued tech before the correction.
SoftBank’s full exit is a red flag for anyone ignoring the possibility of an AI bubble.
2. Michael Burry Bought Massive Puts — A Direct Bet Against the AI Mania
Michael Burry — famous for predicting the 2008 crisis — has quietly increased his put positions on NVIDIA and other AI names.
Why does this matter?
Because Burry doesn’t short “normal” overvaluations.
He shorts bubbles.
His AI thesis:
- expectations are unrealistic
- revenue growth is priced as infinite
- companies are spending billions on AI with no short-term monetization
- chip demand could normalize faster than markets expect
When a contrarian with Burry’s track record bets against a trend, it’s worth paying attention.
3. NVIDIA’s Valuation Is Stretched Even for a Hyper-Growth Company
Even bulls agree: NVDA’s multiples are once again aggressively priced.
Key issues:
• Price-to-Sales historically elevated
NVDA is trading at a P/S ratio that would be insane for any company approaching a $5 trillion market cap.
• Revenue growth expectations assume perfect long-term AI adoption
If AI monetization slows or plateaus even slightly, NVDA’s valuation collapses fast.
4. Are We in an AI Bubble? Many Indicators Say Yes
Top analysts, academics, and even bullish investors admit:
AI has bubble-like behavior.
Evidence of a bubble:
- Stock prices rising faster than actual earnings growth
- Companies buying GPUs “because everyone else is doing it”
- Zero clarity on monetization for many AI firms
- AI startups valued at billions with no revenue
- Media hype similar to 1999 dot-com sentiment
Harvard Business Review, Wired, and Investopedia already discuss the “AI bubble thesis.”
If AI expectations don’t materialize fast enough, NVDA becomes the single most vulnerable stock on the market.

I'm betting for a big pullback in NVDANVDA is still strong in the broader sense, but the shorter-term internal strength (momentum, volume) is waning. If it busts above ~$190-195 with volume, it could resume big.
If it doesn’t, beware the risk of a pullback or consolidation.
Choose your option path accordingly.
NVDA is still strong in the broader sense, but the shorter-term internal strength (momentum, volume) is waning. If it busts above ~$190-195 with volume, it could resume big.
If it doesn’t, beware the risk of a pullback or consolidation. Choose your option path accordingly.

NVDA Head and Shoulders- Dec Rate Cuts has changed setupNvidia’s setup has shifted. With the Fed signaling a likely rate cut on December 10th, the market will start baking that optimism into asset prices ahead of time. When monetary conditions ease, high-valuation tech often gets an extra tailwind, which means the expected head-and-shoulders pattern on NVDA may fail to play out cleanly. The chart might still roll over, but the macro backdrop now works against a decisive breakdown. Short positions here demand caution.
Original post
Nvidia’s bear case rests on one core idea: the stock price assumes a flawless, world-eating AI future, and markets almost never deliver on “perfection narratives.” NVDA trades at extreme valuation multiples for a hardware-driven, highly cyclical business. Those multiples only hold if AI infrastructure spending keeps compounding at its current breathtaking pace for years. But that demand is dangerously concentrated in a handful of hyperscalers who are spending now and rationalizing later. Michael Burry’s recent argument sharpens this point: he claims true end-demand for AI horsepower is vastly overstated, and that much of the current GPU frenzy is a self-reinforcing loop of capital, hype, and accounting gimmicks rather than broad, organic need. If boards pause to question real ROI, or if the circular funding loop breaks Nvidia’s revenue curve can flatten quickly, dragging the valuation down with it.
Competition, long dismissed by NVIDIA bulls, is another structural headwind. AMD is now shipping accelerators that hyperscalers are actually integrating, and every major cloud provider is building in-house silicon to reduce dependence on NVDA’s margins. Even if Nvidia maintains leadership, it doesn’t need to lose the crown to lose the multiple, slight shifts in workload allocation or a handful of missed design wins are enough to pressure margins. And Burry’s critique deepens this point: he argues Nvidia’s reported profitability is flattered by depreciation assumptions and massive stock-based compensation that buybacks have failed to offset, meaning the “true” economic profit is less bulletproof than headlines suggest. Add to that the fact that U.S. export controls have effectively erased the China data-center market, once 20–25% of revenues and expectations of a seamless global TAM look increasingly unrealistic.
Technically, NVDA is doing exactly what a euphoric, overowned stock does when gravity starts tugging: momentum is fading, the price is slipping under short-term moving averages, and reactions to spectacular earnings have been strangely sluggish. That’s often the early signature of distribution rather than accumulation. And this lines up directly with Burry’s broader thesis: when a narrative becomes crowded and reflexive, the slightest wobble triggers violent air pockets. NVDA has become the ultimate proxy for the AI boom, the most crowded long in the market, meaning it’s the first thing funds sell when risk appetite cools, and the last thing buyers chase during corrections.
Put simply, Nvidia is a phenomenal company priced as if nothing can ever go wrong, while Burry is arguing that much of what looks “perfect” is not what it seems. The bear case isn’t that Nvidia collapses. It’s that the AI boom normalizes, competition accelerates, accounting realities catch up, margins slip toward something earthbound, and investors recalibrate how much they’re willing to pay. In that world, NVDA doesn’t need bad news to fall. It only needs the news to arrive slightly less euphoric than the fantasies currently baked into the price.
#NVDA #Bearish #HeadandShoulders #MichaelBurry

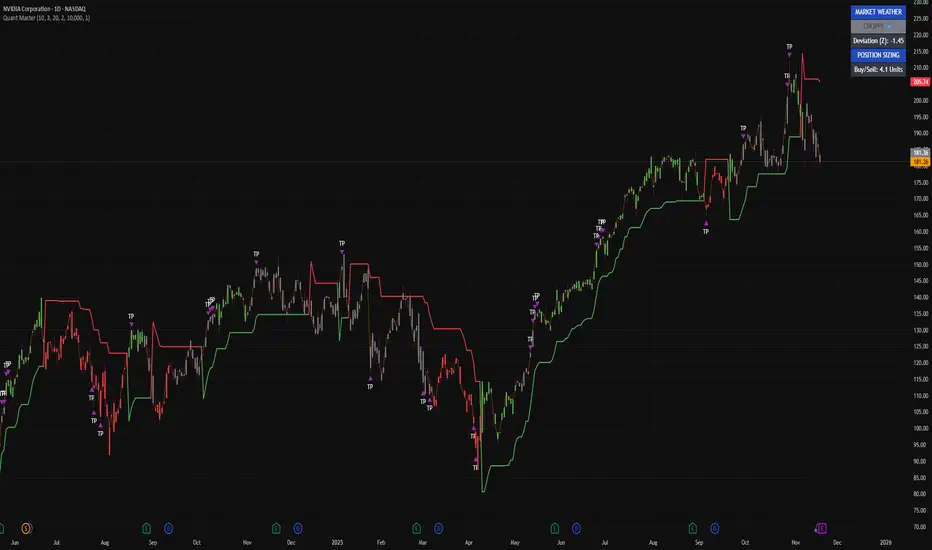
I’m reading NVIDIA through pure structureThis is NVDA on the 1-day with my Quant Master Trend System, and right now the message is simple: we’ve transitioned from impulse to instability.
The ribbon is still red from the recent flip, and every candle since that flip has respected the stop level. That’s the part most people miss — when the ribbon turns red while Market Weather is CHOPPY, it means the trend engine isn’t aligned. There’s pressure, but not clean momentum.
That’s exactly what you’re seeing here.
NVDA topped, printed a string of TP clusters during distribution, and then lost its green momentum base. Once that base broke, it instantly acted as resistance — a classic behavior in this model. The current deviation reading at Z ≈ -1.45 confirms price is stretched, but not in capitulation. This is structural unwind, not panic selling.
Look back at the last time NVDA printed this signature:
Green ribbon → long rally → heavy TP clustering → red flip → CHOPPY weather → multi-week digestion phase.
The system is showing the same rhythm right now.
So here’s how I see it:
The uptrend is no longer intact.
Momentum has shifted from expansion to dispersion.
Market Weather says don’t trust breakouts, don’t trust dips.
The clean trend is gone — this is recalibration.
And until NVDA builds a fresh green momentum base and holds above it, I’m treating every bounce inside red conditions as a continuation of the unwind.
NVIDIA – Limited Correction or Sentiment Change?There is no getting away from it, NVIDIA’s earnings, which are due on Wednesday after the close are making traders nervous. The problem with being the largest company in the world by market capitalisation (approx.$4.53 trillion) with a roughly 7.5% weighting in the S&P 500 and closer to 10% weighting in the Nasdaq 100 is that everything related to your company matters, especially when you are seen as the global AI benchmark at a time when traders are wondering if lofty valuations given to the leading companies in the space are justified or not.
Suddenly, stories like Softbank selling its entire NVIDIA stake of $5.8 billion last week, gets more headline space in the financial press and now your Q3 earnings are potentially being seen as important to the direction of market sentiment and risk appetite as whether the Federal Reserve decides to cut interest rates again at its final meeting of the year on December 10th.
The earnings, when they are released are anticipated to be strong, with Reuters reporting analysts expecting an average 54% year on year rise on Q3 earnings per share. However, while traders may be judging the actual results against market expectations, they may also be keen to hear the updates from CEO Jensen Huang regarding future revenue and chips sales moving forward.
With the potential for extra volatility in NVIDIA’s share price across the next 48 hours being apprised of the technical backdrop could be important.
Technical Update: Limited Correction or Sentiment Shift?
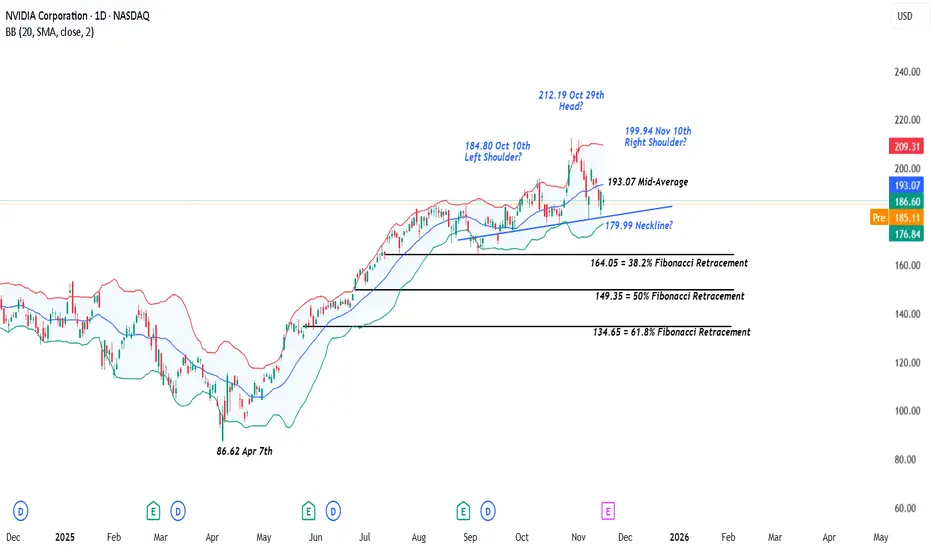
It has been a choppy period for the Nvidia share price since mid-September 2025, activity that has seen 3 distinct highs in price posted. As the chart below shows, these stand at 184.80 on October 10th, 212.19 from October 29th and 199.94, scored on November 10th.
As you can also see on the chart, the 2nd of these 3 peaks at 212.19, is higher than the other 2, which is important from a technical perspective. This may lead some analysts to suggest this activity could be forming a potential Head and Shoulders top pattern.
It is important to stress that a Head and Shoulders pattern must be completed by a close below the ‘neckline’ or the trend connecting recent price lows, which in the case of Nvidia currently stands at 179.99.
Even then, completion of such a pattern isn’t a guarantee of a sentiment shift, but as we approach Nvidia earnings on Wednesday, risks may turn towards increased price volatility, and being aware of potentially relevant support and resistance levels may prove useful.
[bWhat if Closes Below 179.99 Support are Seen?:
Having seen recent price weakness held and reversed to the upside by the uptrend currently standing at 179.99, this could now be viewed as the first support focus. However, with it also possibly being the neckline of a potential Head and Shoulders pattern, it may prove to be pivotal moving forward.
While there is no guarantee closes that below the support at 179.99 may lead to a further phase of price weakness, it might skew risks towards continued declines. Focus may then turn towards 164.05, a level equal to the 38.2% retracement level of April to October strength, possibly even towards 149.35, which is the 50% retracement.
What if 179.99 Support Remains Intact?:
As already said, any Head and Shoulders pattern must see closes below neckline support to suggest a completion and risks for further price declines. For Nvidia the 179.99 support is still intact on a closing basis, and it could be argued this is not yet a valid reversal pattern.
As such, while the 179.99 level holds, traders may view recent price declines as a limited correction within what could still be classed as an uptrend in price.
However, if a further phase of price strength is to materialise, traders may require closes back above the still rising Bollinger mid-average currently at 193.07. Such moves if seen, could then lead to tests of 199.94 the November 10th high, even on towards 212.19, the October 29th extreme.
The material provided here has not been prepared accordance with legal requirements designed to promote the independence of investment research and as such is considered to be a marketing communication. Whilst it is not subject to any prohibition on dealing ahead of the dissemination of investment research, we will not seek to take any advantage before providing it to our clients.
Pepperstone doesn’t represent that the material provided here is accurate, current or complete, and therefore shouldn’t be relied upon as such. The information, whether from a third party or not, isn’t to be considered as a recommendation; or an offer to buy or sell; or the solicitation of an offer to buy or sell any security, financial product or instrument; or to participate in any particular trading strategy. It does not take into account readers’ financial situation or investment objectives. We advise any readers of this content to seek their own advice. Without the approval of Pepperstone, reproduction or redistribution of this information isn’t permitted.
Nvda- Er this week I believe it has more in the tank!!Nvda smashes ER were going to see a massive inpulse! I don't see in heavy volume selling on the daily.. I think this one will be the last big pop we see before a major correction.. All other hyperscalers have performed and had major gaps on er.. Nvda is next bookmark this!!

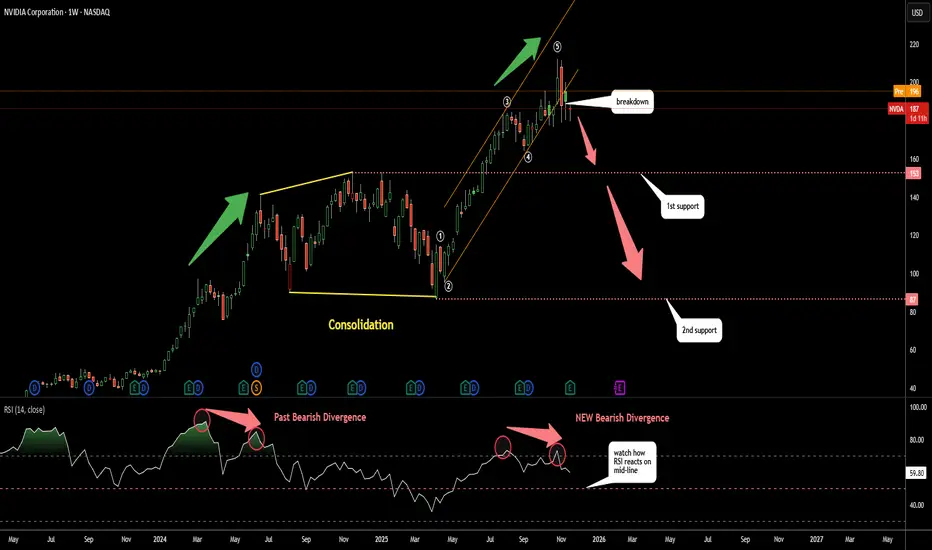
Nvdia (NVDA): How Deep It Can Dip?The RSI is not buying the hype as it shows clear Bearish Divergence
This aligns with the current impulse wave count suggesting the 5 wave structure may now be complete and the orange uptrend has been broken
Last year a similar Bearish Divergence triggered a large consolidation phase marked in yellow
It may repeat again
First support is at 153 the top of the previous consolidation
Second support is at 87 the bottom of that consolidation
#NVIDIA $NVDA The new leader!Nvidia is the world's number one after passing $MSFT.
-Valuation soars to $3.34 trillion.
Nvidia completed a 10-for-1 stock split on June 7. The chipmaker last month posted yet another blockbuster quarter, noting a 262% increase in revenue and a 462% increase in profits year-over-year.
I'm not going to write to much here. The market sentiment is clearly bullish and here are my projections for $NVDA.
The chart should speak for itself. Targets zone is shown on the chart.
Short term, expect price to consolidate withing the red projection marker based on divergences and anomalies in the relative strength index followed by a continuation of the upwards trend (green projection marker).
Targets: (-128),146,160,200
|----Range-----|
(alfa)
I will take a bullish longer term stand on NASDAQ:NVDA from where we currently sit. Short term, expect a pullback/consolidation at the current level before a possible continuation.
(Can add more intraday targets if requested).

NVDA down MVP SYSTEM
MOMENTUM:
RSI Broke down from widening wedge
VOLUME:
to downside
PRICE ACTION:
big red engulfing at the lower border of the widening wedge
I don’t hold positions in NVDA. I use it as a barometer for the market.

NVDA earnings thsi week - will that be catalyst for a move?Its been another few months of great bullish moves on NVDA, however the last couple of weeks have been choppy. We rejected the $200 level and now find ourselves sat above $180 and the Weekly 20MA.
If the numbers are good then I'm sure the giddiness will take us higher. If the numbers are poor the you have to ask will $180 and the Weekly 20MA act as support, or will they collapse? If they do, what will happen to tech and US markets in general? It means that its going to be an interesting week!

DECODED ANALYSIS OF NVIDIANVIDIA is currently in its second last quarterly pattern. After correcting its uptrend form, to restore this pattern the price must either move above $213.99 or hold the support levels at $158.96, $156.29, with major support at $151.05.
Broken pattern support, $106.90
Quarterly skip support, $27.51
Multiple skip supports, lowest at $0.0385
Above current resistance levels are $213.99, $229.61, $250.86, $269.46
Resistance noted for 2030 at $618.83
This message is for educational purposes only.
Always DYOR.

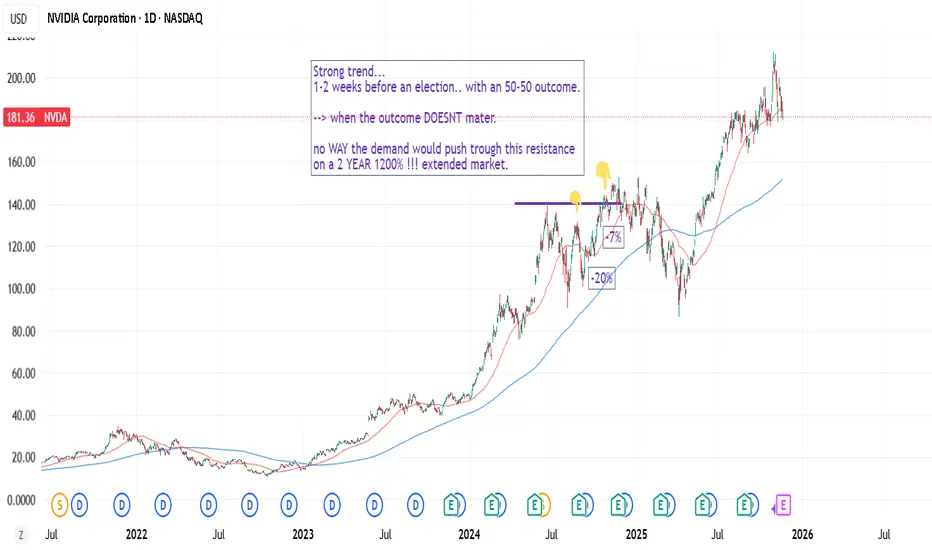
Markets are predictable. Trading S/D imbalances.Pre-election. 1200% extension after a 2-year rally. Facing ATH with strong trend and expectations.
This is a rule or factorial based approach. What most people think - is usually how most people are positioned, or usually also is the logical truth.
When something extends... and some risks emerge -- you can't really trust charts (ie demand strength). that's a prejudgement? ie sloppy way to look at things.
Also somewhat predictable is the 2 year rally, 3rd year weakness. If markets stall -- markets sells off on expectations of that "rule" lol
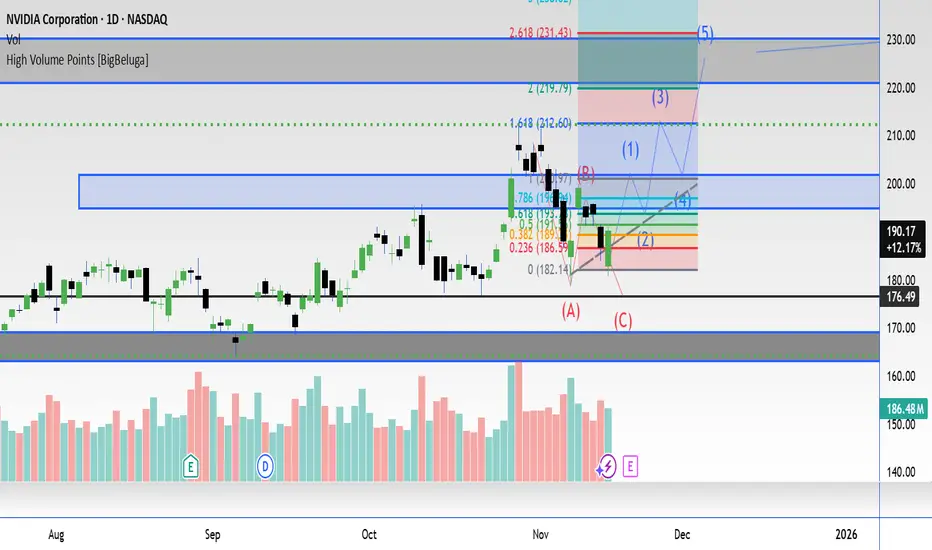
NVDA | Long | R/S Flip at 172 + 0.5 Fib | Nov 20, 2025NVDA | Long | R/S Flip at 172 + 0.5 Fib + VWAP Support in Rising Channel | Nov 20, 2025
🔹 Thesis Summary
NVIDIA remains the S&P 500’s largest single weight and the AI-infrastructure bellwether. After a fast shakeout to channel support, the chart sets up a defined-risk long as risk sentiment sits at Extreme Fear—a backdrop that historically favors mean reversion and leadership rebounds.
🔹 Trade Setup
Bias: Long
Entry Zone: 172–182 (R/S flip and ~0.5 retrace inside the ascending channel)
Stop Loss: 152–156 (below VWAP/structure and prior base)
Take-Profits:
TP1: 188–192 (channel mid / prior supply)
TP2: 205–208 (upper-mid channel)
TP3: 214–220 (channel top / measured move)
Max Target: 230–246 (channel extension if trend resumes)
R:R (from ~175): ~1.5–3.0 depending on exit path and scaling.
🔹 Narrative & Context
Structure: Daily up-channel intact; recent spike down tagged the lower rail and immediately reclaimed the R/S band near 172. That zone aligns with ~0.5 Fib of the prior impulse and anchored VWAP support—classic “shakeout-and-go” anatomy.
Flow: Pullbacks within strong secular trends often pivot when broader risk metrics hit extremes. Current readings show Extreme Fear across equities and crypto (dashboard needles in single-digits/low-teens), consistent with forced-de-risking rather than trend change.
Leadership: Info Tech is 34% of the S&P 500 by weight. NVDA itself sits at ~8.06% of the index’s top-25 weight table—structurally important for passive flows. Re-risking tends to bid the heaviest weights first, providing tailwinds if indices stabilize.
Correlations to watch: NQ strength, breadth stabilization in SOX, and dollar drift lower typically amplify NVDA recovery legs.
🔹 Valuation & Context (Pro Metrics, Framed Simply)
Forward P/E: ~35–45x vs Semi/Tech peers typically ~20–25x → Market pays a premium per $1 of next-12-mo earnings → Premium reflects dominant AI compute share and visibility; multiple compression risk is why we anchor to defined stop.
P/FCF: High-teens to 20s vs peers in low-teens → Investors pay up for cash conversion → Acceptable so long as AI DC demand/ASP mix persists.
Quality (ROE/ROIC): Very high (well above typical large-cap tech) → Capital turns + software stack (CUDA) lift returns → Supports buying pullbacks, not chasing verticals.
Growth: EPS growth well above sector on AI data-center ramps → Outlier growth justifies trend-following bias.
Risk (Debt/Equity): Low/Conservative → Balance sheet flexibility if cycle wobbles.
🔹 Contrarian Angle (Your Edge)
Consensus fixates on “too expensive” optics and headline sentiment. The technical reaction at 172–182 with fear gauges at extremes argues for a positioning reset, not a trend break. With channel structure intact and flows concentrated in megacap AI, we see a credible path toward 214–220 first, then 230–246 on continuation.
🔹 Risks
Positioning/Multiple Risk: Any guide-down or supply hiccup can compress the premium multiple.
Sector Rotation: A sharp unwind in AI/semis or factor shift to defensives.
Macro Shock: Dollar spike/real-yield jump or regulatory headlines impacting export mix.
🔹 Macro Considerations
Sentiment: Equity & crypto Fear & Greed dials show Extreme Fear (single-digit/low-teens) — fuel for relief rallies when flows turn.
Index Mechanics: Tech at 34% of S&P weight; NVDA among top index constituents (~8.06% of top-25 weight list). Stabilization in SPX/NQ mechanically supports NVDA.
Flow Triggers: SOX breadth thrust, NQ reclaim of prior breakdown area, and any cooling in rates/FX volatility would accelerate the upside path.
🔹 Bottom Line
NVDA’s premium is real, but so are its cash generation and AI demand drivers. The 172–182 buy-zone offers a clean, conviction long with 152–156 as invalidation. Manage in tranches toward 188 / 205 / 214–220, leaving a runner for 230–246 if momentum and macro confirm.
🔹 Forward Path
If this gains traction (10+ likes), I’ll post: (1) a weekly/time-frame add-on with updated channel math, (2) live notes on any break/retest of 205 and 214–220, and (3) Q&A on risk management.
Like & Follow for structured ideas, not signals. I post high-conviction setups here before broader narratives play out.
⚠️ Disclaimer: This is not financial advice. Do your own research. Levels derived from the attached chart; sentiment and index weights from the referenced images. Charts/visuals may include AI enhancements.
🔹 Footnote
Forward P/E: Price divided by expected earnings over the next 12 months. Lower = cheaper relative to profits.
P/FCF (Price-to-Free-Cash-Flow): Price vs. the cash left after investments. A measure of efficiency.
FCF Yield: Free cash flow per share ÷ price per share. Higher = more cash returned for each dollar invested.
ROE (Return on Equity): Net income ÷ shareholder equity. Shows management efficiency with investor capital.
ROIC (Return on Invested Capital): Net income ÷ all invested capital (equity + debt). A purer profitability gauge.
Debt/Equity: Debt divided by equity. <1 usually means balance sheet is conservative.
R:R (Risk-to-Reward): Ratio of expected upside vs. downside. 3:1 = you risk $1 to make $3.

Pop and drop part deuxLooks like that is possible, although right now it definitely feels more bullish than not. I think the market will be choppy the next few days at least. Gold is at resistance. VIX looks like an ABC forming. Oil falling but likely a test of the bottom before a rally. BTC could get to 92500 but it will find resistance there. Good luck!

$NVDANASDAQ:NVDA reports earnings next week, but I feel the hype is slowing down.
The only catalysts that could keep them strong are deeper ties with Israel’s defense systems and the new military tech initiatives they’re trying to build.
But even with that, the price needs a balance point.
NVDA is too extended it needs a healthy correction before the next leg.

NVDA Swing Trade Today✅ Positives / Bull Case
Strong recent earnings + guidance: NVIDIA beat in Q3 and the commentary is upbeat for Q4 (“crazy good” according to CEO Jensen Huang).
StockAnalysis
+4
Fox Business
+4
Investors
+4
Wall-Street bullish consensus: Analyst average target ~$243 from current ~$185-$195, suggesting ~30% upside in the medium term.
TipRanks
+1
Strong fundamental backdrop: Dominance in AI chips, data-centers, large TAM (total addressable market) etc. Makes for a good “momentum” swing candidate if you believe the thesis.
⚠️ Risks / Bear Case
Valuation & expectations are already very high: With consensus expecting big growth, there’s little margin for error. If guidance disappoints or general tech/macro weakens, it could pull back.
Sector/market risk: AI stocks are in “expectation land” to a large extent. Some analysts caution about a possible bubble.
MarketWatch
+1
Very volatile: As a swing trade you’ll need good risk control. Big moves both ways possible.
Short-term catalysts may be thin: Some notes (e.g., Goldman Sachs) suggest lack of new catalysts for near term.
Business Insider
🎯 Setup for a Swing Trade
Here’s how you might structure a swing trade given your approach:
Entry
Current price ~ US$195.67 (per latest)
You could wait for a pullback into a support zone (for example around US$180-190) to improve risk/reward.
Or if momentum is strong and you want to ride it you could enter near current levels—but expect higher risk.
Stop-Loss
For example, a stop could be placed just below a recent support: say US$175-180 zone (depending on your risk tolerance).
Given high volatility, a tighter stop may lead to getting whipsawed.
Target
Given the ~30% upside to ~$243 (consensus target) you could set a medium swing target around US$235-250. That gives about +20-30% upside.
Alternatively, for a shorter swing you may aim for +10-15% (US$215-225) and then re-evaluate.
Time Horizon
Since you said “swing trade”, perhaps 1-4 weeks depending on catalyst flow.
If using until next earnings/guidance or sector move, keep flexible.
Risk/Reward
Suppose you enter at US$195, stop at US$175 (≈10% risk) and target US$235 (≈20% reward) → ~2:1 R/R, decent.
But if you enter higher, risk increases quickly.
Market/Context Conditions
Ensure broad market tech/AI risk isn’t spiking down (i.e., avoid entering if tech is breaking down).
Watch for macro/interest-rate cues, since growth stocks are sensitive.
Keep an eye on news related to export rules (China), chip supply constraints, large customer guidance — any negative shock could hit.
🔍 My Verdict
I like NVDA as a swing trade candidate if you:
enter with risk control (stop in place),
accept the volatility,
have conviction in the AI/data-centre tailwinds.
However, I’d be somewhat cautious on entering right at the high unless you see a fresh catalyst or a strong pullback to reduce risk. If you’re more conservative, waiting for a retest of support or slight consolidation might be wiser.
If I were making a call today: enter around current levels or after a modest pull-back, stop-loss at ~$175-180, target ~$235 for the swing, and be ready to adjust if market tech sentiment weakens.

NVDA QuantSignals V3 — Katy Flags Subtle Reversal MoveNVDA (QuantSignals V3)
Market Structure:
NVDA is showing neutral-to-weak momentum with price hovering near short-term resistance at $189–190. Buyers are losing strength, and the tape shows lower high formations, signaling potential exhaustion.
Trend Outlook:
The Katy 1M model flags soft downside pressure. Despite the neutral trend reading, intraday structure leans toward a controlled pullback, supported by moderate volatility (16.5%).
Order Flow Insight:
Momentum flow appears to be slowing, with reduced upward volume. The micro-trend suggests fade-the-rip behavior—small rallies may get sold into.
Key Levels:
Resistance: $189.40 / $191.70
Support: $188.00 / $186.80
Short Trigger Zone: $188.50–$189.00
Vision Summary:
NVDA shows lower momentum, weak buyer conviction, and a short-biased micro-shift. Best setup aligns with a tight short scalp targeting the next liquidity pocket below $188.00.
Nvidia Bearish Engulfing Candle at 100 DMAIf this breaks through the 100DMA and has a sustained drop, expect it to go to the next support level of $150 to $152.

Nvidia: Downside Pressure Nvidia has recently faced notable downward pressure, but so far has managed to hold above the support level at $176.21. As a result, we continue to anticipate an imminent rally as part of the beige wave V, which should lift the stock into the now-red Target Zone between $227.38 and $260.60. However, if the stock immediately drops below the $176.21 mark, we would expect a new low for the beige wave alt.IV, with the lower $145.50 level still likely to hold.

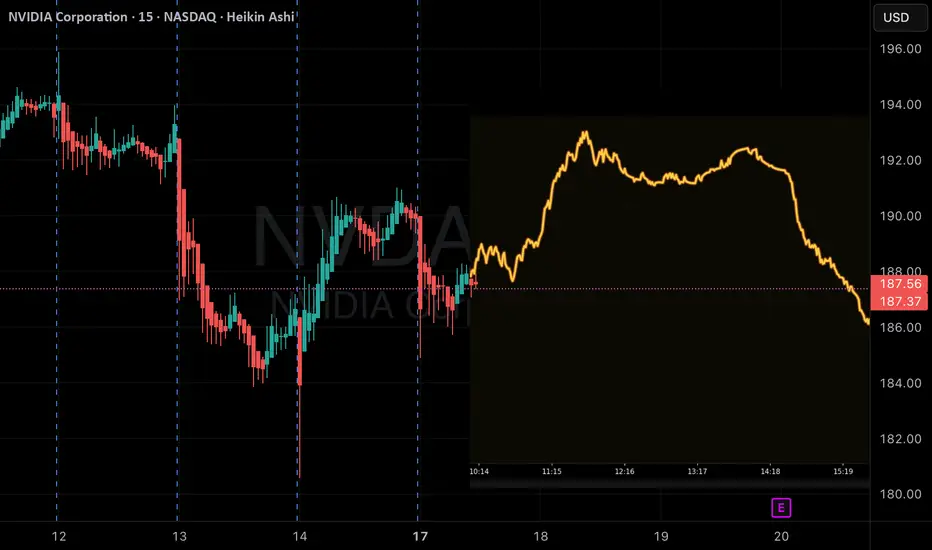
Nvidia Erases Post-Earnings RallyShortly after publishing its earnings, shares of tech giant Nvidia jumped more than 5% at the start of the session; however, a new bearish sentiment quickly took hold of the market, and the stock fell over 7% in the final trading hours, wiping out the gains seen after the results. The company reported strong figures, with revenue of $57 billion, above the expected $54 billion, and projected fourth-quarter sales near $65 billion.
Despite the positive numbers, selling pressure began weighing on the price, mainly because the optimism was likely already priced in, prompting short-term profit-taking. In addition, growing concerns about emerging competition have fueled ongoing weakness in the stock. If market confidence fails to recover soon, selling pressure could intensify in the coming sessions.
Uptrend Losing Momentum
Since November 11, indecisive price action has led to a break of the long-standing upward trendline that had been guiding the stock’s movement. This uncertainty has created a short-term sideways range, with a ceiling at $196 and a floor at $179 per share. As long as these levels hold, a neutral and sideways phase is likely to dominate, indicating lack of clear direction in the short term.
RSI
The RSI remains slightly below the neutral 50 level, suggesting that selling momentum slightly outweighs buying pressure, though not strongly enough to establish a consistent short-term trend. As long as the RSI stays near 50, neutrality in price movement is likely to persist.
TRIX
The TRIX indicator shows a downward slope, moving closer to the zero line, indicating a balance in the strength of the exponential moving averages. This reinforces the indecision in the stock’s short-term behavior.
Key Levels to Watch:
$196 – Main Resistance: Corresponds to the most recent upward retracement zone. A break above this level could revive the bullish bias and reactivate the long-term uptrend.
$188 – Nearby Barrier: Area aligned with the 50-period simple moving average. Price moves near this level could support the formation of a more defined sideways range.
$179 – Key Support: Represents the lowest area from the past two months and serves as the most critical bearish barrier. A drop below this level could trigger a stronger selling bias and mark the start of a short-term downtrend.
Written by Julian Pineda, CFA, CMT – Market Analyst
