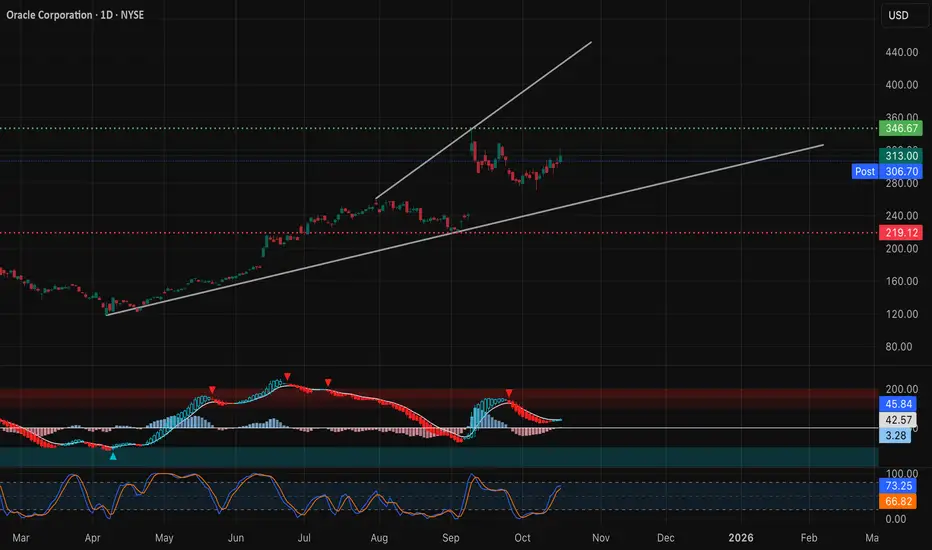
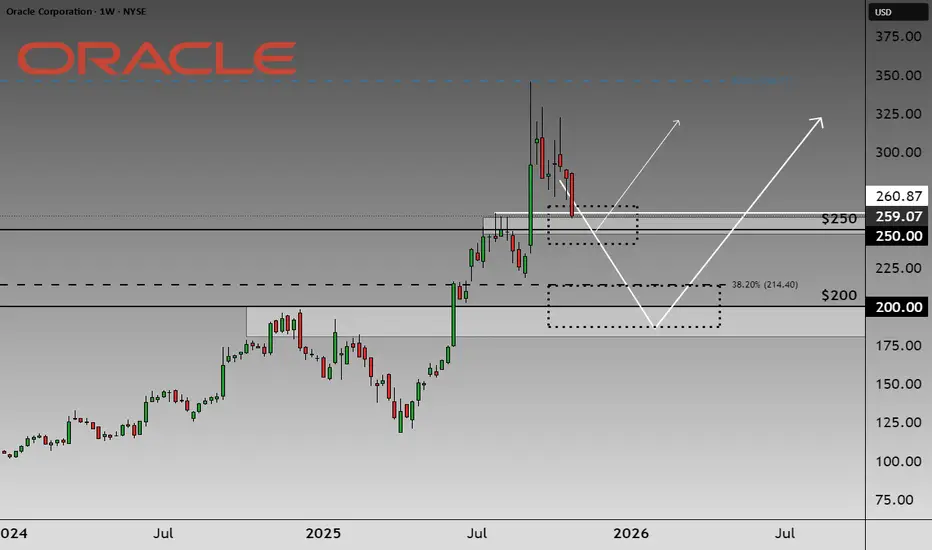
ORACLE The collapse won't stop here.Oracle (ORCL) has been correcting violently ever since its early September news-related pump that made new All Time Highs (ATH). The correction has already almost reached the 1W MA50 (blue trend-line), resembling the technical pull-back of both December 2024 - April 2025 and the 2022 Inflation Crisis.
Based on the 1W RSI, we expect Oracle to follow that Bear Cycle and seek its 1W MA200 (orange trend-line) for Support, which has been he most optimal long-term buy entry of the past 5 years.
If this Channel Up holds, this time the bottom should be above the 0.5 Fibonacci retracement level. Our Target is $170.
---
** Please LIKE 👍, FOLLOW ✅, SHARE 🙌 and COMMENT ✍ if you enjoy this idea! Also share your ideas and charts in the comments section below! This is best way to keep it relevant, support us, keep the content here free and allow the idea to reach as many people as possible. **
---
💸💸💸💸💸💸
👇 👇 👇 👇 👇 👇
Trade ideas

ORCL watch $212-220: Double Golden Fib zone really needs to holdThis is a followup to my TOP CALL below.
ORCL's massive surge slammed into a Double Golden zone to top
Now retraced into another Double Golden zone at $212.67-220.21
Surge has been completely retraced so bulls must now hold this.
.
Previous WARNING at the EXACT TOP:
Hit BOOST and FOLLOW for more such PRECISE and TIMELY charts.
========================================================
.

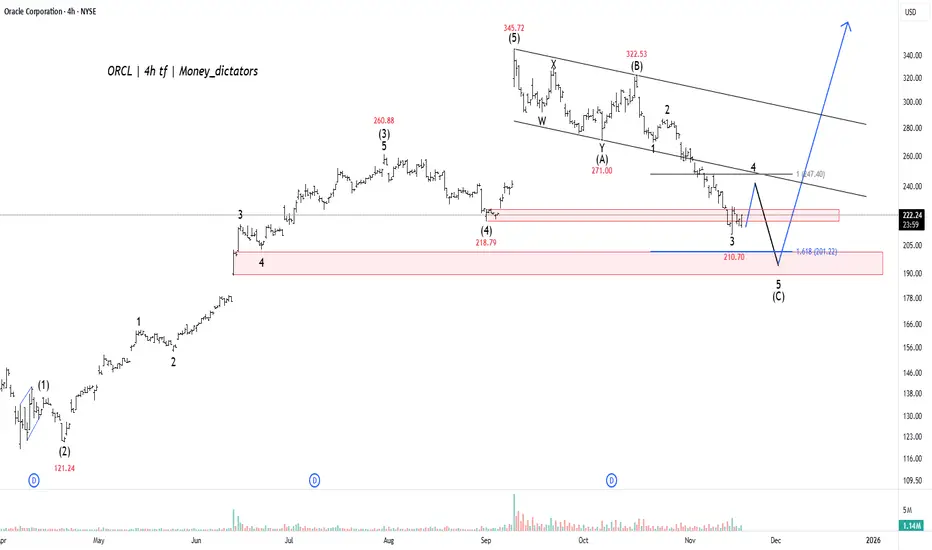
ORCL - Launchpad to New HighsWave Projection of Oracle (ORCL) suggests the stock is currently in the final stages of a major correction, specifically concluding the last downward leg, wave (C), of a larger pullback. The chart indicates that after a temporary bounce, the price is expected to make one final, sharp drop to complete this corrective phase. This action is essential for the market to "reset" before the next significant rally.
The critical support area for the end of this correction is identified in a tight range between $207.72 (the $1.618$ Fibonacci extension) and the immediate low of $210.70 . This zone offers strong confluence with previous structural support, making it the highest probability area for the market to find a decisive bottom. The analysis projects that the current selling pressure will exhaust itself within this $207-$211 range.
Once the price successfully reaches and holds this projected support zone, the analysis anticipates the launch of a major, long-term bullish impulse wave, likely the start of the final wave (5) of a large-scale uptrend. This new wave is expected to drive the stock significantly higher, with a target to surpass the previous all-time high of $345.77 . This pattern suggests that the current decline should be viewed as a final buying opportunity before a powerful upward trend begins.
$ORCLExecutive Summary:
Oracle Corporation ( NYSE:ORCL ) has experienced a significant bearish catalyst following its earnings report on Tuesday, September 9th, leading to a pronounced breakdown of its previous technical structure. The violation of a key Bull Flag pattern has invalidated the prior consolidation's bullish implications and suggests a new near-term downtrend is now in force. In this context, our strategy shifts to identifying strategic support levels for potential capital allocation once the selling pressure subsides. Key Fibonacci retracement levels at $205.61 and $167.52 provide initial targets, while the major psychological support at $200.00 presents a high-conviction buying zone where long-term value and technical support are expected to converge.
Detailed Technical Breakdown:
1. The Catalytic Event and Pattern Breakdown:
The bearish gap down and subsequent sell-off post-earnings on September 9th represent a fundamental shift in market sentiment. This event acted as the decisive catalyst that shattered the technical picture.
Bull Flag Failure: The pattern that was previously interpreted as a Bull Flag—a typically bullish continuation signal—has now been conclusively broken to the downside. Instead of pausing before a move higher, the pattern has failed, indicating that the underlying supply (sellers) has overwhelmed demand (buyers). This breakdown signals that the path of least resistance has shifted downward, and the pattern's prior support level has now become a new resistance zone.
2. Revised Support Framework and Downside Targets:
Given the newly established downtrend, we utilize Fibonacci retracement levels of the stock's major prior upward swing to identify logical areas where the decline may find footing and buyer interest may return.
Initial Support (Shallow Retracement): 61.8% Fibonacci Level at $205.61
This level, known as the "Golden Ratio," is a deep but common retracement zone in a strong stock. A hold here would suggest that the long-term uptrend remains structurally sound despite the recent earnings-driven setback. However, given the magnitude of the breakdown, a mere bounce at this level may be temporary.
Secondary Support (Deep Retracement): 78.6% Fibonacci Level at $167.52
A retracement to this depth would indicate a more severe correction is underway, potentially shaking out weaker hands. While this suggests greater near-term weakness, it also represents a more significant "washout" level that could create a powerful long-term base and a higher-risk, higher-reward entry point.
3. The High-Conviction Value Zone: The $200.00 Psychological Support
Beyond the Fibonacci calculations, the $200.00 threshold stands as a critical major support. This round number carries immense psychological weight and often serves as a magnet for price action and a focal point for institutional buyers. The convergence of this major psychological level with the deep 61.8% Fibonacci retracement in the $205-$200 range creates a high-probability zone for a substantial buyer response.
Strategic Outlook & Scenario Planning:
Bearish Scenario (Immediate): The near-term momentum is bearish. Rallies are likely to be sold into, with the broken Bull Flag pattern (now resistance) capping any upward movements. The initial downside target is the $205.61 support zone.
Accumulation Scenario (Strategic): Our primary interest lies in the $205-$200 support band. A stabilization and reversal from this area, particularly on bullish volume patterns, would signal that the corrective phase may be complete and offer a compelling opportunity to establish or add to a position. A further decline toward the $167.52 level would represent a steeper de-valuation but would require a reassessment of the fundamental thesis.
In conclusion, while the breakdown is unequivocally bearish in the short term, it is also creating a potential value opportunity. The strategy is to exercise patience, allowing the sell-off to exhaust itself near the key technical and psychological supports at $205-$200, where the risk-reward profile becomes increasingly favorable for a strategic long-term entry.

Oracle on BIG DISCOUNTShort Post:
NYSE:ORCL
Buy this now and wait for magic until next earnings in December. THIS IS A NO BRWINER FOLKS

What’s Next for ORCL After a 39%+ Decline? Potential Buy Oracle recently surged to an all-time high of approximately $346, followed by a sharp correction of more than 39%, bringing the price into the key Fibonacci 61.8% retracement zone.
This level has historically acted as a strong technical area for potential reversals.
The decline has also resulted in the development of an ascending trendline, which is currently serving as a major support zone on the chart.
Technical Outlook
Potential Buy Zones:
Entry Zones: $219.86 (Entry 1 & 2)
Target Levels:
TP 1: $260
TP 2: $300
Risk Consideration
If the ascending trendline fails to hold, the chart suggests a possible additional downside of approximately 8% before the next support region.
As always, apply strict risk management and adjust your position sizing accordingly.
Feel free to share your views—and kindly follow for more chart breakdowns and market insights.
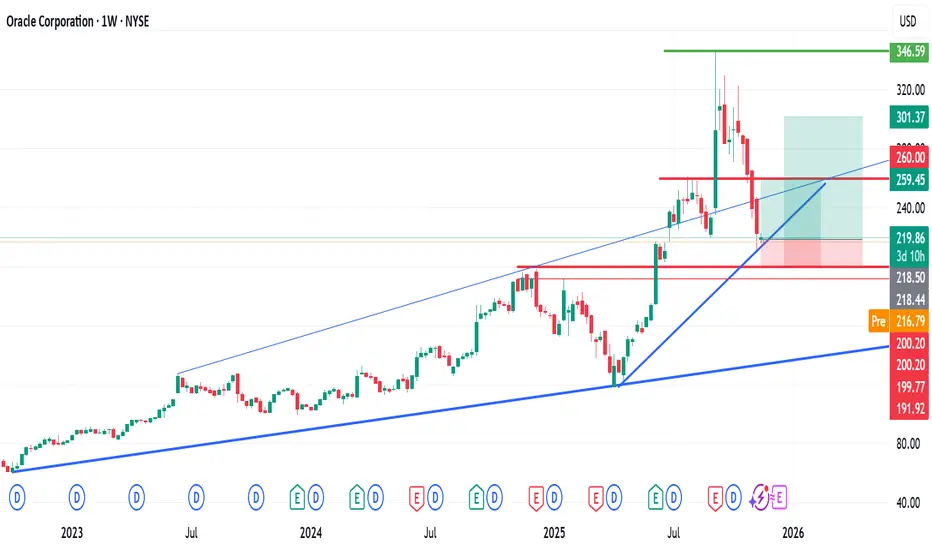
Oracle (ORCL) Hits Major Support Zone —Big Rebound or Breakdown?Oracle Corporation (NYSE: ORCL) is entering a critical phase as the stock pulls back sharply from its recent high at $345. The retreat brings ORCL back toward a long-term trendline that has acted as structural support and resistance for almost three years. Whether the stock holds this trendline or loses it will determine the next major move.
Technically, ORCL is testing the support zone at the ascending trendline, around $222. This region marked the prior ascending resistance that the stock broke above in 2024 during its strong cloud-driven rally. If bulls defend this level and volume stabilizes, ORCL could rebound and retest the $350 region. A clean hold above the trendline keeps the long-term bullish structure intact.
However, a failure to hold $222 could trigger a deeper slide toward the major support around $135–$145, a level where institutions accumulated heavily in 2022–2023. This zone also aligns with a large volume shelf, making it the next downside magnet if sellers remain in control.
Fundamentally, Oracle remains well-positioned despite the recent correction. Strong demand for its AI-optimized cloud solutions, growing adoption of Oracle Cloud Infrastructure (OCI), and continued expansion of its healthcare data platform (Cerner) support long-term revenue growth. Oracle is one of the few cloud companies benefiting from rising enterprise AI spending as businesses shift toward more efficient data-first solutions.
Macro conditions may also influence price action. With expectations of Fed rate cuts in December and cooling inflation, tech valuations could stabilize and attract renewed capital flows. Lower borrowing costs historically benefit high-growth software companies, and ORCL could see momentum return once macro pressures ease.
Overall, ORCL sits at a crucial technical zone. Holding the long-term trendline keeps the bullish path alive; breaking below opens the door to deeper downside. The next few weeks will determine the stock’s trajectory into 2025.

My levels to manage $ORCL positionsORCL has dropped sharply, breaking below recent support levels. If this move holds, it could signal a short-term bearish phase.
• Key Levels:
• Support: Watch for stabilization near $230–$232, which aligns with prior demand zones and trendline support.
• Resistance: The previous high near $245 now acts as resistance. A reclaim of this level would suggest bullish momentum resuming.
This drop could be interpreted as:
• Phase C (Shakeout) if volume spikes and price rebounds quickly—suggesting a spring setup.
• Phase E (Markdown) if breakdown continues with weak volume recovery—favoring bearish continuation.

Oracle (ORCL) – Weekly Demand Zone Re-Test Setup🧠 Oracle (ORCL) – Weekly Demand Zone Re-Test Setup 🟢
Symbol: NYSE:ORCL
Timeframe: 1W
Current Price: ~242 USD
Setup Type: Swing Long from Demand Zone
📊 Technical Overview
After a strong bullish impulse from late 2024 through early 2025, Oracle Corporation entered a corrective phase, pulling back toward a major weekly demand zone around 235 – 245 USD. This zone previously acted as resistance during the mid-2025 breakout and now aligns perfectly with a confluence of multiple bullish indicators suggesting potential continuation of the longer-term uptrend.
🔍 Confluence of Bullish Indicators
1️⃣ Demand Zone Re-Test
The current price action sits right above a strong weekly demand block formed during the breakout in early 2025. Buyers previously absorbed heavy supply here before initiating the rally toward 330 USD. The market is now retesting this key zone for liquidity, a classic accumulation pattern before another leg up.
2️⃣ Fibonacci Retracement Support
The recent correction retraced to approximately the 0.5–0.618 Fibonacci zone of the entire bullish leg (from 180 USD to 330 USD), which historically serves as a powerful re-entry level in trending markets.
3️⃣ Volume Profile
The highest volume node (HVN) on the visible range volume profile aligns with 240 USD, confirming strong institutional interest at this price level. Volume contraction on recent red candles further suggests selling exhaustion.
4️⃣ Moving Averages
20 EMA (weekly) is flattening beneath current price, acting as dynamic support.
50 EMA (weekly) remains firmly below, confirming that the long-term structure is still bullish.
A bullish crossover between shorter EMAs (on daily/weekly) would serve as secondary confirmation for trend resumption.
5️⃣ RSI Reset
Weekly RSI cooled down from overbought levels (>70) to around 45–50, a neutral zone often marking the end of a corrective wave before new accumulation begins. This reset supports the idea of a continuation move upward.
6️⃣ Candlestick Behavior
The last few weekly candles show declining bearish momentum with long lower wicks, indicating buyers are stepping in to defend the 240 USD area. A bullish engulfing candle on this level would strongly validate the setup.
🎯 Trade Plan (Example)
Entry Stop Loss Target 1 Target 2 Target 3
242 USD 225 USD 280 USD 310 USD 350 USD
Risk/Reward: ~1:4
Position Type: Swing / Mid-term Hold
🧩 Summary
✅ Price sitting on a multi-timeframe demand zone
✅ Fibonacci confluence with HVN support
✅ RSI reset and EMA alignment
✅ Declining selling volume with possible reversal candles
These factors together form a high-probability swing long setup, assuming bullish confirmation next week. Patience is key, as the market might accumulate for several candles before breakout.
🗣️ Final Thoughts
Oracle remains one of the strongest large-cap tech charts structurally. While short-term volatility is possible, the macro trend and technical confluence favor continuation toward new highs as long as the 225 USD support holds.,

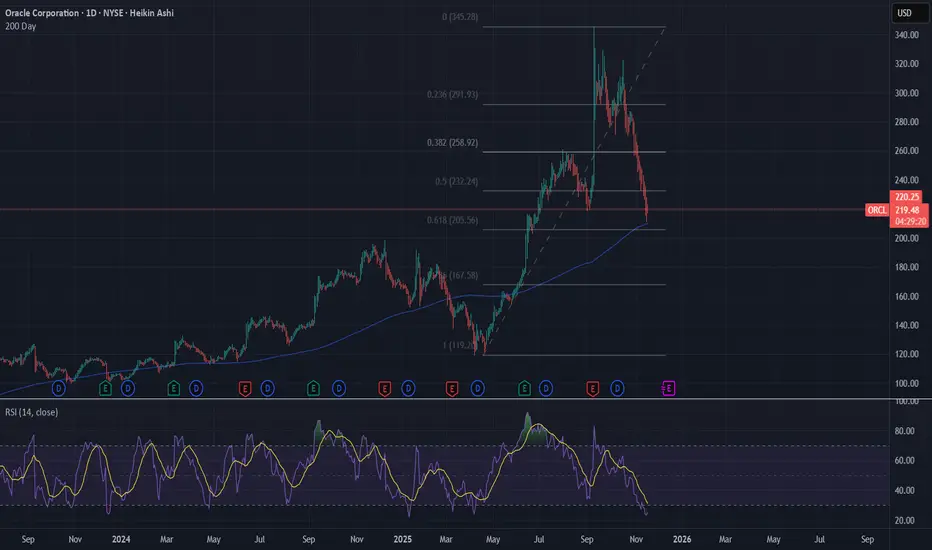
ORCL an opportunityWill be buying NYSE:ORCL shares heavily here.
Stock heavily oversold and reached the 200 day MA alongside my golden retracement level on my Fibonacci.
Sold of primarily due to its debt and credit default swaps, however still very strong value in the long term.
Rare occasion a company of this size and strength reaches this level. This will be clip 1/3 of purchasing
ORCL NOV 2025ORCL testing 220-210 support after 7B+ distribution.
Holding could refill the 245-310 gap; breakdown opens 185, then 145.
260 Resistance
#ORCL #globaltrade #investment #investing #stockmarket #wealth #realestate #markets #economy #finance #money #forex #trading #price #business #currency

ORCL Bearish Momentum — Short-Term Trade OpportunityORCL QuantSignals Katy 1M Prediction 2025-11-14
Ticker: ORCL
Current Price: $220.57
Trend: Bearish
Confidence: 75%
Volatility: 34.3%
📊 AI & Technical Forecast
30-Minute Target: $218.05 (–1.14%)
Final Prediction: $213.61 (–3.15%)
Strong bearish momentum projected over short-term horizon
Insights:
ORCL exhibits declining trend with controlled volatility
Katy AI indicates high probability of short-term downside
🎯 Trade Setup
Parameter Value
Direction PUT
Entry $220.57
Target $215.00
Stop Loss $223.88
Expected Move –3.15%
Confidence 75%
🚨 Risk Notes
Short-term trade, monitor closely
Stop loss above $223.88 limits risk
Summary
ORCL presents a high-confidence short setup based on Katy AI 1M prediction with a clear downside target, suitable for traders seeking short-term bearish exposure.

ORCL 100 Point PullbackBig opportunity long term on this pullback will start scaling in here might see this a little lower , might not....

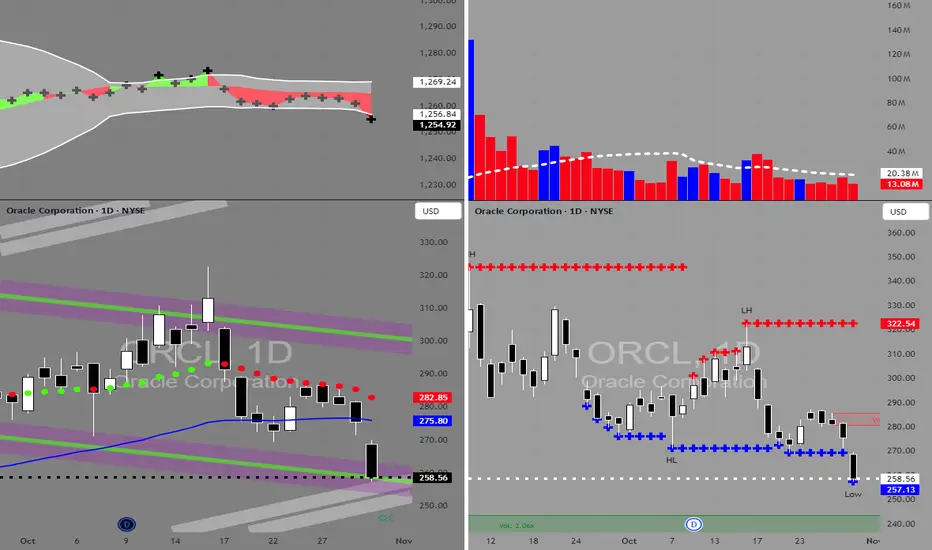
ORCL Bearish: Breakdown Below 255 Eyes 241 then 230Oracle (ORCL) has rolled over on the 1D chart after its September peak, confirming a short-term downtrend. Price is below the 20/60 MAs and has closed under the lower Bollinger Band, while a clean Double Top is confirmed with a decisive break beneath the neckline around 280. The latest bearish engulfing candle adds momentum to the downside and frames 255.00 as the line in the sand.
Primary path: a daily break-and-hold below 255.00 favors continuation toward the MA120 near 241.39, with extension into the measured move area at 234.00–230.00 if 241.39 gives way. If price retests 255.00 from below and rejects, that would strengthen the bearish case and improve risk-to-reward for shorts. Resistance sits first at the reclaimed-neckline zone 280–284, then higher at 316.00.
Alternative: if buyers quickly reclaim 280–284 (or a daily close >285.00), the breakdown is likely a trap and a squeeze toward 316.00 becomes feasible. For tactical risk, shorts initiated on a breakdown can use 268.00 as invalidation; aggressive longs off 241.39 need a firm reversal signal and should invalidate on a daily close <240.00. Targets: 241.39 first, then 234.00–230.00 on sustained weakness; topside target 316.00 on a confirmed reclaim.
This is a study, not financial advice. Manage risk and invalidations

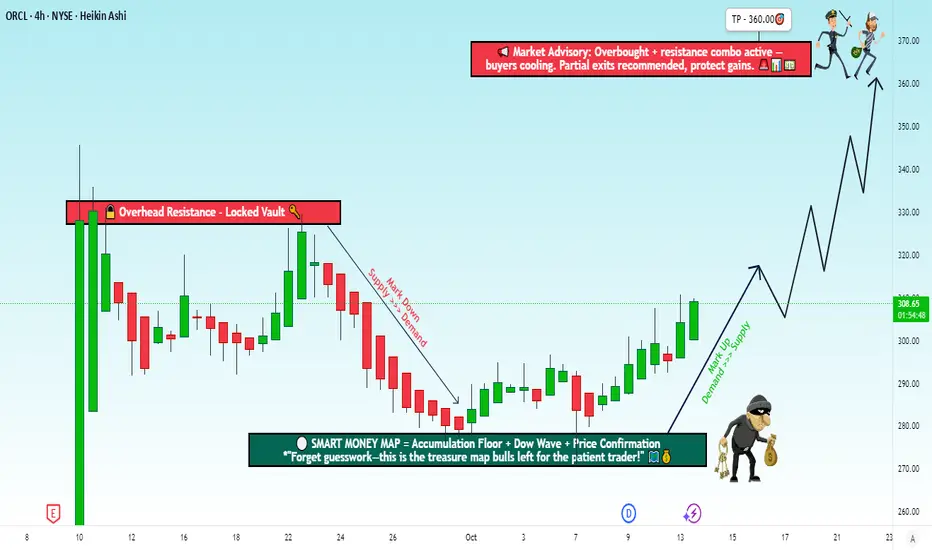
Will Oracle Push Higher? Strategic Entry Levels Revealed🎯 ORCL: The "Thief Strategy" Profit Heist 💰 | Swing/Day Trade Setup
🚨 THE HEIST PLAN: BULLISH OPERATION 🚨
Oracle Corporation (ORCL) is setting up for what I call the "Thief Strategy" – a layered entry approach that lets you sneak into positions like a professional vault cracker. No single entry YOLO here, folks. We're playing it smart, calculated, and ready to grab profits when the market isn't looking. 😎
💼 ENTRY ZONES: THE LAYERED HEIST APPROACH 💼
Instead of going all-in at one price (rookie mistake!), we're using multiple limit orders to build our position strategically:
🎯 Layer 1: $280.00
🎯 Layer 2: $290.00
🎯 Layer 3: $300.00
🎯 Layer 4: $310.00
Feel free to add more layers based on your capital and risk appetite. The beauty of the Thief Strategy is flexibility – you control the robbery!
Alternative: If you're feeling confident and want to enter at current market price, you can do that too. But layering gives you better average cost and less risk exposure.
🛑 STOP LOSS: THE ESCAPE HATCH 🛑
Thief's Stop Loss: $270.00
⚠️ IMPORTANT NOTE: Dear Thief OG's (Ladies & Gentlemen), this is MY stop loss level based on my risk tolerance. You're the captain of your own ship! Set YOUR stop loss based on YOUR risk management rules. Take profits and manage risk at YOUR OWN DISCRETION. I'm not here to hold your hand – I'm here to share the blueprint! 🗺️
🎯 TARGET: ESCAPE BEFORE THE COPS ARRIVE! 🎯
Target Zone: $360.00 🚔
This level acts as a POLICE BARRICADE – think of it as strong resistance where the market could turn into a trap. Overbought conditions + resistance = time to take your profits and RUN! Don't get greedy when you're already carrying the bag. 💼✨
⚠️ PROFIT-TAKING NOTE: Again, Thief OG's, this is MY target. You do YOU. If you want to take profits earlier or hold for more, that's your call. Make money, take money – at your own risk and on your own terms!
📊 RELATED PAIRS TO WATCH 📊
Keep an eye on these correlated assets – they move with ORCL or give us clues about tech sector momentum:
NASDAQ:MSFT (Microsoft) – Cloud computing competitor, tech sector leader
NYSE:CRM (Salesforce) – Enterprise software correlation
XETR:SAP (SAP SE) – Direct ERP software competitor
NASDAQ:GOOGL (Google) – Cloud infrastructure correlation
NASDAQ:QQQ (Nasdaq-100 ETF) – Overall tech sector health indicator
Key Correlation: ORCL is heavily tied to enterprise tech spending and cloud growth. Watch the broader Nasdaq trends and cloud computing momentum. If tech is strong, ORCL follows. If cloud earnings disappoint sector-wide, expect headwinds.
🔑 KEY TECHNICAL POINTS 🔑
✅ Bullish momentum building on multiple timeframes
✅ Layered entry strategy reduces risk and improves cost average
✅ Risk-to-reward ratio favorable with defined stop and target
✅ Resistance at $360 – historically strong level, watch for rejection
✅ Support layers from $280-$310 provide cushion for entries
⚡ WHY THE THIEF STRATEGY WORKS ⚡
This isn't gambling – it's calculated position building. By spreading entries across multiple price levels, you:
Reduce risk of buying at the absolute top
Lower average entry price if the stock dips
Stay flexible with market volatility
Avoid FOMO and emotional trading
Think of it like a professional heist – you don't just run in guns blazing. You plan, you execute in phases, and you know when to escape with the loot! 🏃💨
⚠️ DISCLAIMER ⚠️
This is the Thief Style Trading Strategy – a fun, strategic approach to the markets. This is NOT financial advice. I'm sharing my analysis for educational and entertainment purposes only. Trade at your own risk. Markets can be unpredictable, and you could lose money. Do your own research, manage your risk, and never invest more than you can afford to lose. This strategy is just for fun and learning! 🎲
✨ If you find value in my analysis, a 👍 and 🚀 boost is much appreciated — it helps me share more setups with the community!
#ORCL #OracleCorporation #ThiefStrategy #SwingTrading #DayTrading #TechStocks #TradingIdeas #LayeredEntry #RiskManagement #BullishSetup #StockMarket #TradingStrategy #TechnicalAnalysis #EnterpriseSoftware #CloudComputing
Oracle's (ORCL) next big move is quietly building?Many have asked me where Oracle’s strongest technical support zones are...
Actually, no one has asked — but I’ll answer anyway. 😄
Strongest zones:
240–260 → where the price is currently trading
185–215 → the next major demand area
If you plan to start building a position from today’s price levels, be ready to commit — the average entry point could end up around the $200 region.
That $200 zone is technically stronger, but there’s also a fair chance that if you like the stock fundamentally, you might never get the chance to buy it there.
As always, the choice is yours!
Good luck!
ORCL in BUY ZONEMy trading plan is very simple.
I buy or sell when at either of these events happen:
* Price tags the top or bottom of parallel channel zones
* Money flow volume spikes beyond it's Bollinger Bands
So...
Here's why I'm picking this symbol to do the thing.
Price in buying zone at bottom top of channel
Money flow momentum is spiked negative and under at bottom of Bollinger Band
Entry at $258
Target is upper lower channel around $300
Top 3 Candlestick Patterns You Could Use Finding a candlestick pattern:
Morning star
Bullish engulfing
Hammer
These strategies help you detect if a price is in an uptrend or not.
The problem is if you enter when the pattern is not touching support.
Make sure
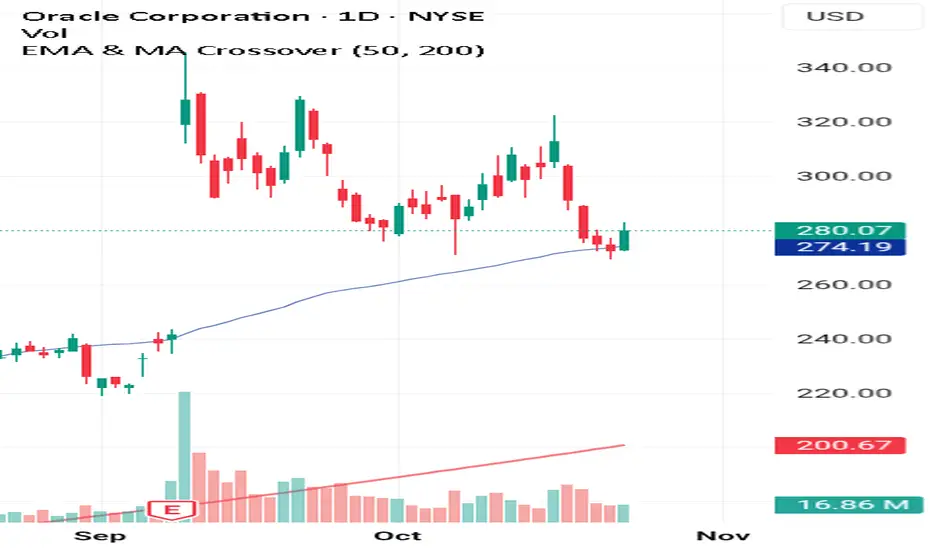
Price is above 50 EMA
Price is above 200 EMA
Price is indicating a candlestick
Now sometimes the price will not go up immediately.If that's the case you need to exit your position.
Also consider looking at it like the price is a consolidation or range this means volatility kicking in.
So try to give your position atleast 2 weeks also set stop loss positions
to exit when you feel you are not
Able to risk all your capital.
It will take time to master trading.
Rocket 🚀 Boost This Content To Learn More.
Disclaimer ⚠️ Trading is risky please learn about risk management and profit taking strategies and feel free to use a simulation trading account before you use real money.
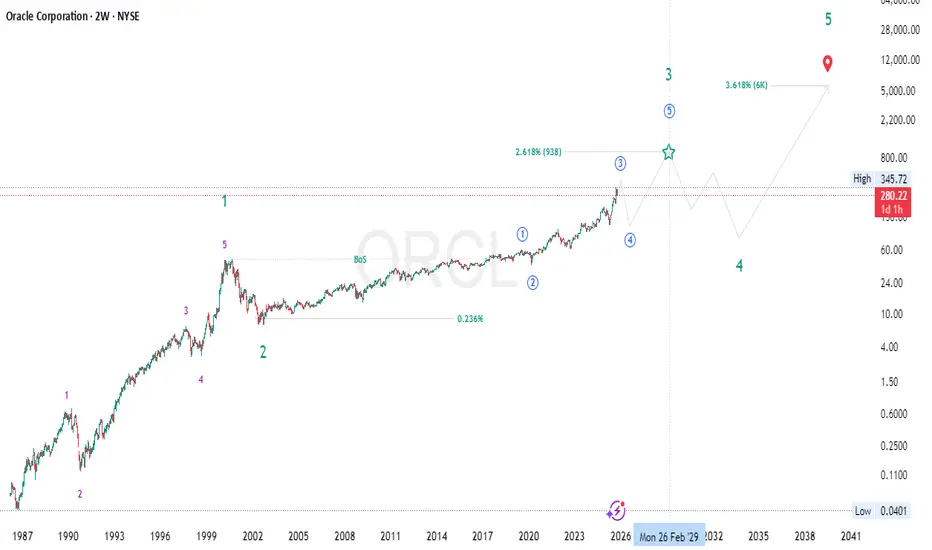
ORACALE (ORCL) Rally! Cycle 3 → $400, Eyes on Supercycle $6,000🌀 ORACLE (ORCL) – Elliott Wave Supercycle Analysis | Smart Money & Fibonacci Confluence
🔭 Macro Perspective
Oracle’s long-term chart (NYSE: ORCL) showcases a powerful Supercycle (III) wave in motion — a multi-decade expansion phase fueled by institutional participation, structural growth, and technological innovation.
The internal Cycle waves (1–5) are clearly defined, with current price action positioned deep within Cycle Wave (3) — the strongest segment of this major bullish leg.
🟢 Supercycle Wave (I) (1987 – 2000)
Elliott Behavior: The first grand impulsive advance, representing Oracle’s rise during the early software and database revolution.
Fibonacci Structure: Wave (3) extended toward the 2.618× of Wave (1), typical of an early institutional growth wave.
SMC Dynamics:
Breaks of structure (BoS) at each impulsive stage.
Liquidity sweeps before rallies — consistent smart money accumulation patterns.
Fundamentals: Explosive earnings growth through enterprise software adoption and global market expansion.
💥 Conclusion: The dot-com peak in 2000 completed Supercycle (I).
🔵 Supercycle Wave (II) (2000 – 2002)
Nature: The sharp, emotion-driven retracement following the tech bubble.
Fibonacci Retracement: Retraced into the 0.236 zone of (I), providing the long-term discount region for accumulation.
SMC Characteristics:
Liquidity grab beneath 1998–1999 structure.
Long accumulation base confirming institutional re-entry.
Fundamentals: Oracle streamlined operations and built the groundwork for enterprise-level solutions.
🧱 Bottom: Wave (II) ended around 2002 — the base of today’s decades-long uptrend.
🟣 Supercycle Wave (III) (2002 – 2030s, ongoing)
This ongoing macro impulsive wave contains five internal Cycle Waves (1–5) .
⚪ Cycle Wave (1) (2002 – 2019)
Elliott Context: A powerful, sustained impulsive leg lasting nearly two decades.
Structure: Clean five-wave advance with strong extensions during 2010–2019.
Fibonacci Note: The move achieved near the 1.618× extension relative to its starting point.
SMC Insight:
Consistent higher highs and higher lows throughout the period.
BoS continuation patterns confirming institutional markup.
Fundamentals: Expansion of Oracle’s business model — cloud transition, data analytics, and enterprise software dominance.
📈 End: Cycle (1) peaked near 2019 , completing the first internal impulsive leg of Supercycle (III).
🔵 Cycle Wave (2) (2019 – 2020)
Nature: A sharp yet shallow correction that coincided with the global market decline (COVID crash).
Fibonacci Retracement: Retraced around the 0.236–0.382 zone of Wave (1).
SMC Dynamics:
Liquidity sweep under 2018–2019 structure.
Fast accumulation pattern — strong re-accumulation footprint.
Fundamentals: Short-term market shock, but Oracle’s fundamentals remained intact and rebounded swiftly.
🧭 Conclusion: Cycle (2) ended in 2020, setting the foundation for the explosive ongoing Cycle (3) rally.
🟢 Cycle Wave (3) (2020 – ~2026, in progress)
Elliott Context: The most powerful internal impulsive wave — currently unfolding.
Target Zone: Projected to complete near $380–$400 , expected around late 2025 to early 2026 .
Fibonacci Extension: The 2.618× extension of Wave (1) perfectly aligns near $400.
SMC & Market Structure:
Continuous BoS and HH–HL formations — clear institutional control.
No macro distribution yet; structure remains intact.
Liquidity inducements near highs suggest ongoing markup phase.
Price Action: Aggressive impulses, shallow retracements, and orderly continuation patterns.
Fundamentals:
Rapid expansion in Cloud Infrastructure (OCI), AI-driven services, and recurring revenue models.
Sustained EPS growth and improved margin performance support wave maturity.
🚀 Expectation: Completion near $400 will likely trigger a Cycle (4) corrective structure before the final impulsive push.
🟠 Cycle Wave (4) (Projected: 2026 – 2028)
Elliott Behavior: A corrective phase — retracing part of the strong Cycle (3) run.
Fibonacci Retracement: Expected correction into the 0.236–0.382 zone of Wave (3), roughly $200–$280.
SMC Insight:
Break of structure (BoS) near top zones to induce liquidity.
Re-accumulation base forming after liquidity sweep below key supports.
Market Psychology: Cooling from euphoria, consolidation, and rebalancing of valuations.
Fundamentals: Period of stabilization after several years of aggressive expansion.
📉 Outlook: Likely forms the structural foundation for the next rally phase (Cycle 5).
🟢 Cycle Wave (5) (Projected: 2028 – early 2030s)
Elliott Context: The final impulsive leg completing Supercycle (III).
Target Zone: Fibonacci 3.618× extension (~$900–$950) of Cycle (1).
SMC Structure:
Final markup phase with strong BoS continuation patterns.
Climax rallies as retail sentiment peaks.
Price Action: Parabolic trend, thin retracements, and expanding volatility.
Fundamentals: Oracle could cement its dominance in global data, AI, and enterprise infrastructure markets.
💎 Completion: Cycle (5) will mark the end of Supercycle (III), leading into the long-term corrective Supercycle (IV).
🔶 Supercycle Wave (IV) (Projected: 2030s – 2040s)
Nature: Major macro correction after decades of expansion.
Fibonacci Depth: Likely retraces into the 0.382–0.5 zone of (III).
SMC Behavior: Distribution → liquidity sweep → re-accumulation.
Market Context: Could align with macroeconomic tightening or sectoral rotation.
📊 Purpose: To reset valuations and build energy for the final Supercycle (V).
🟩 Supercycle Wave (V) (Projected: 2040s – 2050s)
Elliott Context: The final impulsive wave of Oracle’s century-long trend.
Fibonacci Target: 3.618× expansion (~$6,000).
SMC Behavior: Final institutional markup followed by distribution and secular reversal.
Fundamentals: Could coincide with Oracle’s role as a global AI–data infrastructure leader.
🚀 Legacy Wave: The culmination of decades of innovation and expansion.
⚙️ Macro Summary
Accumulation (1980s–1990s) – Smart money foundation.
Expansion (2000s–2020s) – Institutional markup phase.
Distribution (2030s) – Macro correction and rotation.
Re-accumulation (Post-2040s) – Long-term reset for future cycles.
🧠 Technical & Fundamental Alignment
✨ Elliott Structure: Clear impulsive (I–V) sequence with macro rhythm.
✨ Fibonacci Confluence: $400 (2.618× of Wave 1) & $900 (3.618× of Wave 1).
✨ SMC: Institutional control with clean BoS → reaccumulation → continuation.
✨ Price Action: Aggressive bullish order flow with no macro distribution yet.
✨ Fundamentals: Oracle’s AI + Cloud strategy drives sustainable growth.
🌍 Conclusion
Oracle (ORCL) continues to trend within Supercycle (III) — the most powerful long-term wave.
Cycle Wave (3): In progress, targeting $380–$400 by end of 2025 / early 2026.
Cycle Wave (4): Anticipated retracement toward $200–$280 zone.
Cycle Wave (5): Final impulsive run toward $900+ into the early 2030s.
📈 Macro Bias: Long-term bullish — institutional structure intact.
📊 Short-term Outlook: Momentum strong but nearing Cycle 3 completion; prepare for corrective rotation.
💬 Summary: Oracle’s price evolution beautifully mirrors its technological growth story — a near-perfect alignment of Elliott Wave symmetry , Smart Money structure , and fundamental strength . The completion of Cycle 3 near $400 will open the door to an ideal re-entry opportunity for the next macro leg higher.
#ORCL 📈 #Oracle 💼 #ElliottWave 🌊 #WaveAnalysis 🔹 #Supercycle 🚀 #Fibonacci 📊 #SmartMoney 💎 #PriceAction 🕯️ #MarketStructure 🏗️ #LongTermBull 🟢 #StockAnalysis 💹 #TechnicalAnalysis ⚙️ #Investing 💰 #TradingViewIdeas 💡
💬 Respected traders and analysts!
Your insights matter. Share your views, confirmations, or constructive criticism in the comments below. Let’s discuss ORCL’s structural evolution, Elliott Wave setup, and long-term Supercycle potential 🚀📈.
— Team FIBCOS 💎
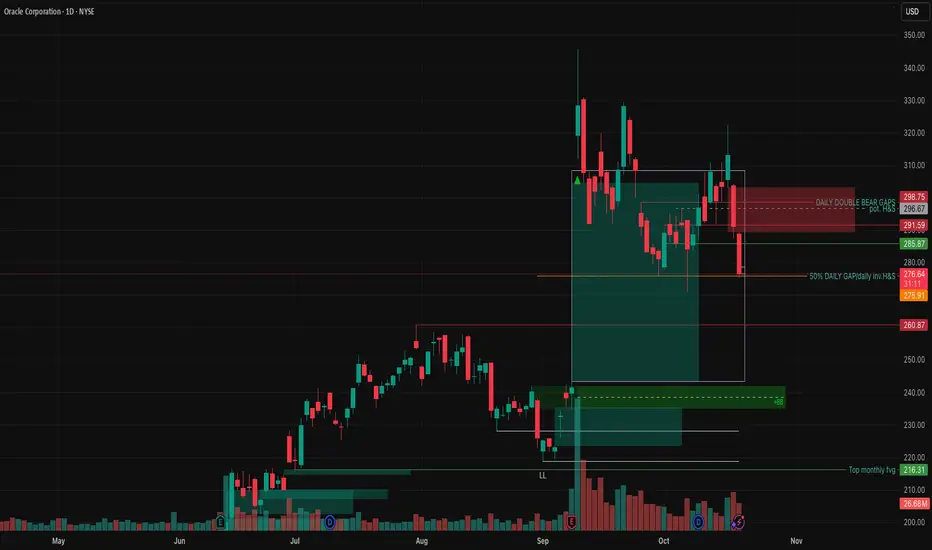
Inverted H&S on ORCL DailyThere is solid support on ORCL in this bottom range for a bounce. Also inverted H&S on top of being 50% of the fair value gap up on the daily that was previously created. NYSE:ORCL
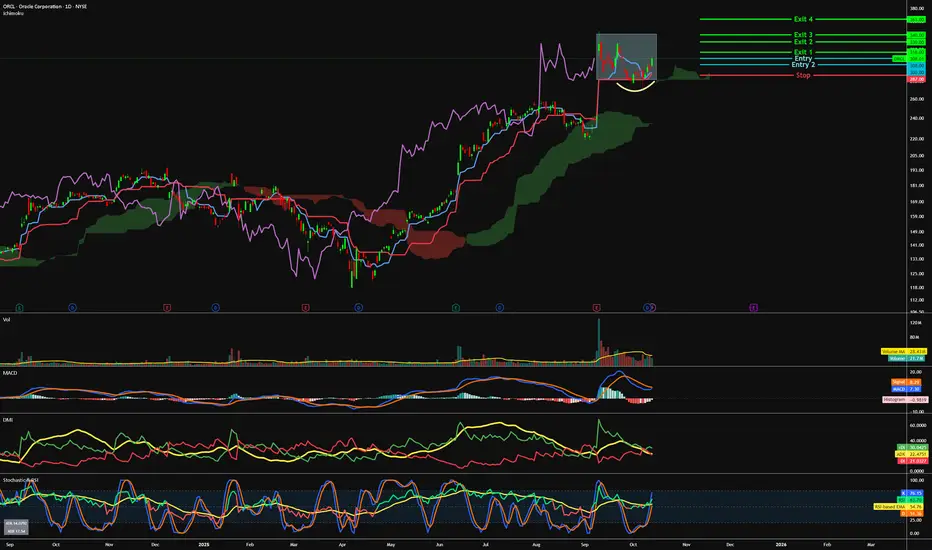
ORCL - A step to a new high=======
Volume
=======
-slight decrease
==========
Price Action
==========
- rounding bottom and bullish flag noticed
- Weak selling pressure
=================
Technical Indicators
=================
- Ichimoku
>>> price above cloud
>>> Green kumo budding
>>> Tenken + Chiku - above clouds and moving away
>>> Kijun - Above clouds and moving away
=========
Oscillators
=========
- MACD turning bullish
- DMI bullish
- StochRSI, bullish
=========
Conclusion
=========
- short to long term breakout swing
- price may reverse at current level, to enter spot or wait for pullback at entry 2.
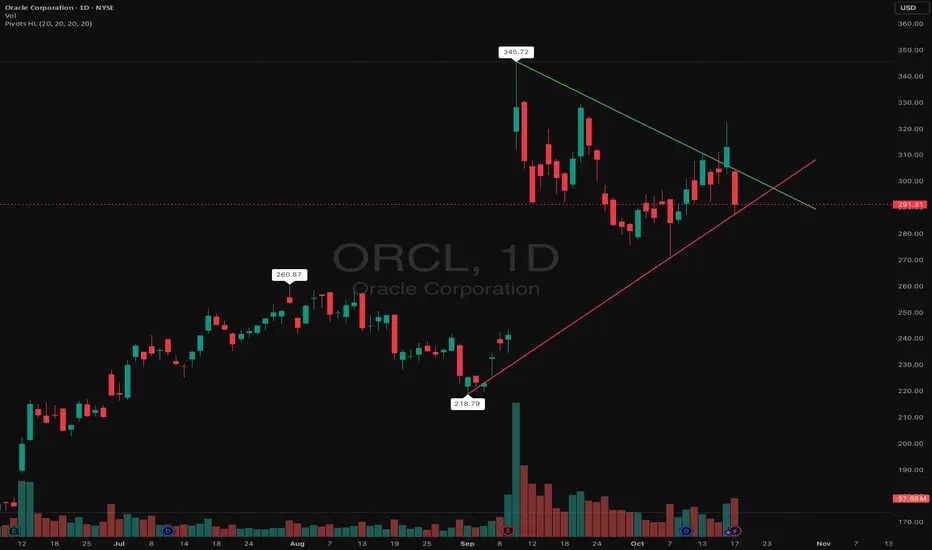
$ORCL - BULL need to defend or BEAR will WINORCL broke below the ascending red support line on heavy volume, signaling a trendline breakdown.
If price fails to recover above $300 the next major support lies at $260-265
ORCL Friday Setup – Bulls Regain Control Above $306. Oct.17ORCL Friday Setup – Bulls Regain Control Above $306 as Gamma Builds for a Breakout
🕒 1. Daily Chart – Macro Structure (“The Why”)
Oracle (ORCL) has reawakened after a month-long consolidation, staging a clean CHoCH → BOS sequence off the $276 base. The recent daily ‘Buy’ trigger aligns with renewed momentum above the trendline that has guided the broader uptrend since May.
The macro structure remains firmly bullish. Price is currently retesting the prior breakout area around $306–$313, sitting just beneath the upper channel resistance at $322–$325. The higher-timeframe chart suggests the recent correction phase is ending, and a continuation pattern is forming.
Macro Bias: Bullish, with $299–$306 acting as a critical demand reaccumulation zone before a potential leg higher toward $322+.
⏰ 2. 1-Hour Chart – Active Market Structure (“The Setup”)
On the 1-hour chart, ORCL continues to form a well-defined ascending structure. Recent price action shows multiple BOS levels confirmed, followed by a minor CHoCH pullback that tapped the intraday trendline near $305–$306 — now acting as dynamic support.
The MACD remains positive, though histogram momentum has cooled — typical of mid-trend pauses before continuation. The Stoch RSI is cycling from oversold levels, suggesting fresh buying pressure may enter if $305 continues to hold.
Both 9 EMA and 21 EMA remain upward-sloping, supporting a bullish short-term bias. Any retest of the 9 EMA around $305–$306 could attract dip buyers.
Key Levels:
* Support: $305 → $299 → $295
* Resistance: $311 → $314 → $322
💹 3. 15-Min Chart – Intraday Execution (“The How”)
On the 15-min timeframe, ORCL recently printed a BOS to the upside followed by a controlled retracement — classic breakout–retest structure.
The stock found demand at $305–$306, creating a liquidity sweep below the short-term low and reclaiming support swiftly — a bullish tell heading into Friday.
MACD histogram is turning back toward positive territory, and Stoch RSI is lifting from the lower zone, signaling potential continuation momentum if volume confirms.
Scalp Plan:
* Bullish Entry: Above $308, target $311.5 → $314, stop below $305.5
* Bearish Scenario: Failure to hold $305 with volume; target $299 → $295, stop above $308.5
Momentum traders should monitor the intraday EMA alignment — a bullish cross and retest setup here could set up a strong Friday run.
📈 4. GEX (Gamma Exposure) Chart – Dealer Positioning (“The Fuel”)
Option flow and gamma positioning support the bullish structure. The highest positive GEX and call resistance cluster sits near $312–$322, matching the same upper technical resistance seen on the charts.
The HVL zone at $306–$307 aligns perfectly with the current price — a magnetic gamma pivot area that dealers will likely defend into expiration.
* Positive Gamma: $312 → $322 (call side, upside cap until squeeze)
* Put Support: $295 → $290 (negative gamma pocket, volatility risk if lost)
* IVR: 67.4
* IVx avg: 67.1
* Call Bias: 31.4%
Dealer positioning indicates controlled gamma above $306, but once $311–$314 is breached, hedging could flip bullish — setting up a clean gamma squeeze into $320+.
🎯 Final Outlook
Friday’s tone for ORCL favors continuation as long as $305 holds as intraday demand.
A reclaim of $311+ could trigger fast upside momentum into $314–$322, especially if SPY or QQQ maintain strength into the session.
Failure to defend $305, however, would open a retest of $299 — the key line in the sand for bulls.
I’m watching for a morning liquidity sweep under $305 followed by a reclaim as the ideal entry trigger. If that happens with MACD confirmation and rising volume, this could be a textbook Friday continuation play.
Disclaimer:
This analysis is for educational purposes only and not financial advice. Always do your own research and trade responsibly.