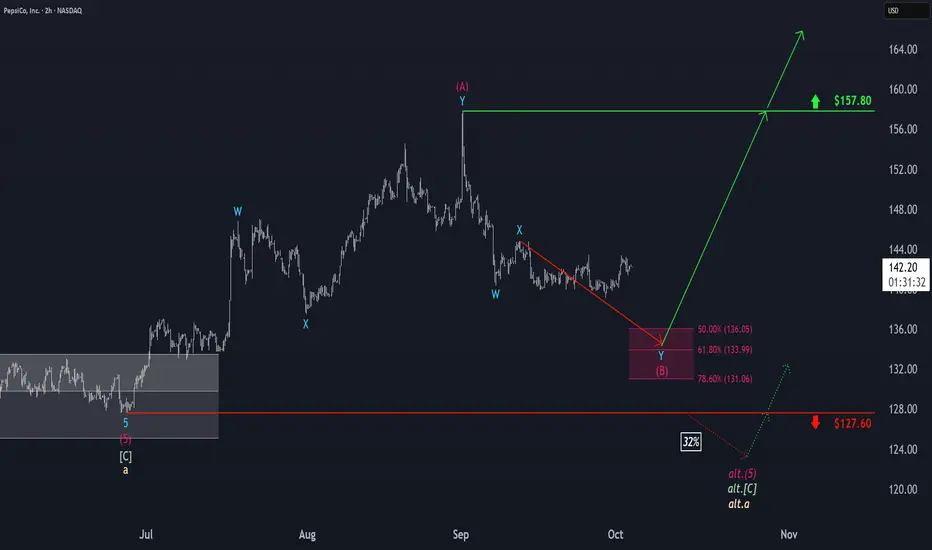
PepsiCo: Approaching the Target ZonePepsi shares have traded mostly sideways within a broader range over the past two weeks. Our primary outlook is that the ongoing magenta wave (B) will continue to move lower, eventually bottoming within the similarly colored long Target Zone between $136.05 and $131.06. From that point, we expect th
Next report date
—
Report period
—
EPS estimate
—
Revenue estimate
—
178.99 THB
329.37 B THB
3.16 T THB
1.36 B
About PepsiCo, Inc.
Sector
Industry
CEO
Ramon Luis Laguarta
Website
Headquarters
Purchase
Founded
1965
ISIN
TH0150122206
FIGI
BBG01NBK6Q70
PepsiCo, Inc. engages in the manufacture, marketing, distribution, and sale of beverages, food, and snacks. It operates through the following business segments: Frito-Lay North America (FLNA), Quaker Foods North America (QFNA), PepsiCo Beverages North America (PBNA), Latin America (LatAm), Europe, Africa, Middle East, and South Asia (AMESA), and Asia Pacific, Australia and New Zealand, and China Region (APAC). The FLNA segment consists of branded convenient food businesses in the United States and Canada. The QFNA segment includes cereals, rice, and pasta under the Quaker, Pearl Milling Company, Quaker Chewy, Cap'n Crunch, Life, and Rice-A-Roni brands. The PBNA segment is composed of beverage concentrates, fountain syrups, and finished goods under various beverage brands such as Pepsi, Gatorade, Mountain Dew, Diet Pepsi, Aquafina, Diet Mountain Dew, Sierra Mist, and Mug. The LatAm segment covers beverage, food, and snack businesses in the Latin American region. The Europe segment offers beverage, food, and snack goods in Europe and Sub-Saharan Africa regions. The AMESA segment deals with all beverage and convenient food businesses in Africa, the Middle East, and South Asia. The APAC segment refers to all business operations in the Asia Pacific, Australia and New Zealand, and China region. The company was founded by Donald M. Kendall, Sr. and Herman W. Lay in 1965 and is headquartered in Purchase, NY.
Related stocks
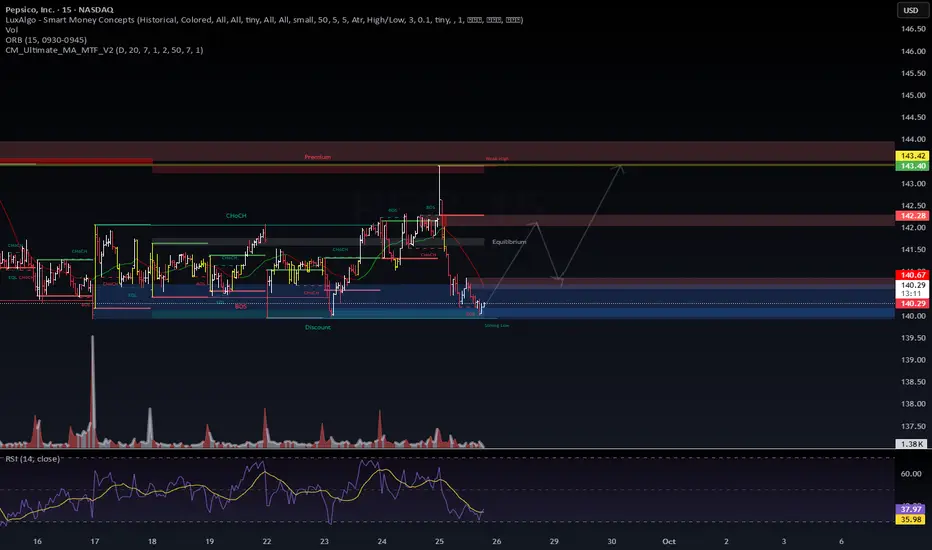
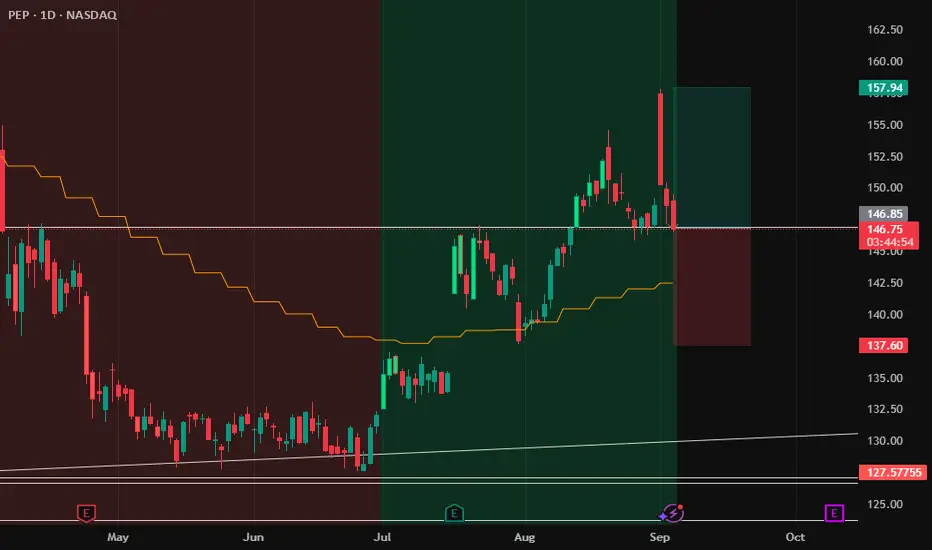
PEP: Discount Zone Test – Will Buyers Defend?NASDAQ:PEP | Discount Zone Test – Will Buyers Defend?
Price is sitting inside the discount / strong low zone (~140) after a sharp selloff.
Scenarios:
🟢 Bullish case: If buyers defend this level, expect a reclaim of 142.28 equilibrium, which opens a move toward the 143.40–143.42 premium zone.
🔴
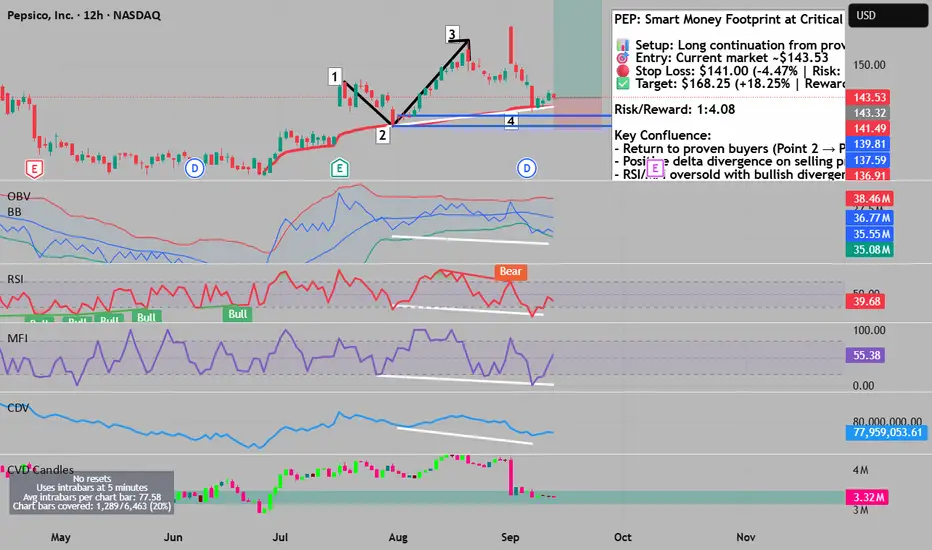
Footprint Data Reveals Stealth Buying at Critical Support### Market Structure & Context
PepsiCo has demonstrated a robust uptrend architecture spanning May through September, establishing a clear sequence of higher highs and higher lows. The current retracement presents a textbook opportunity as price revisits a proven demand zone where institutional
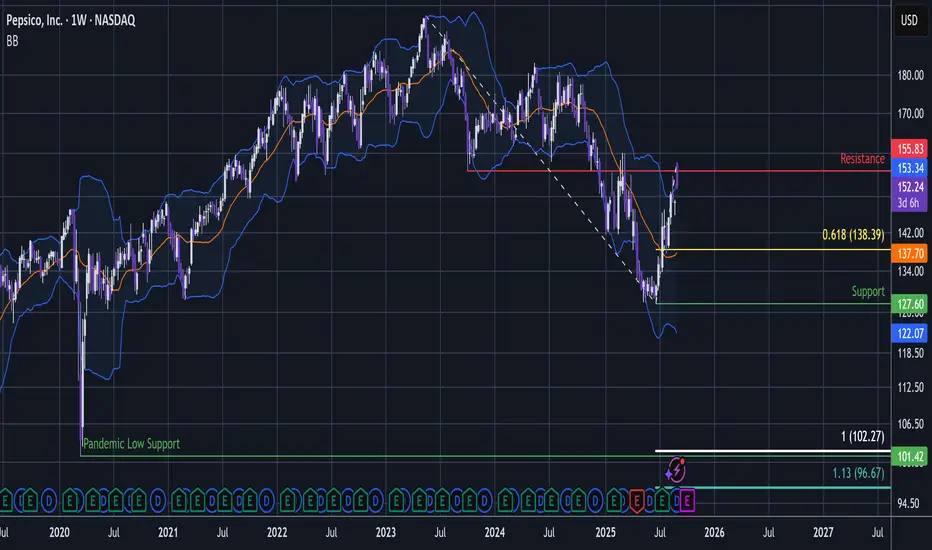
$PEP Bullish SetupNASDAQ:PEP Bullish Setup 🥤📈
PepsiCo has pulled back sharply from $180+ to $140s, testing long-term channel support. RSI is rebounding from oversold, but price action still suggests some downside chop before a full reversal. That said, the setup is attractive: Pepsi is a global staple brand with pr
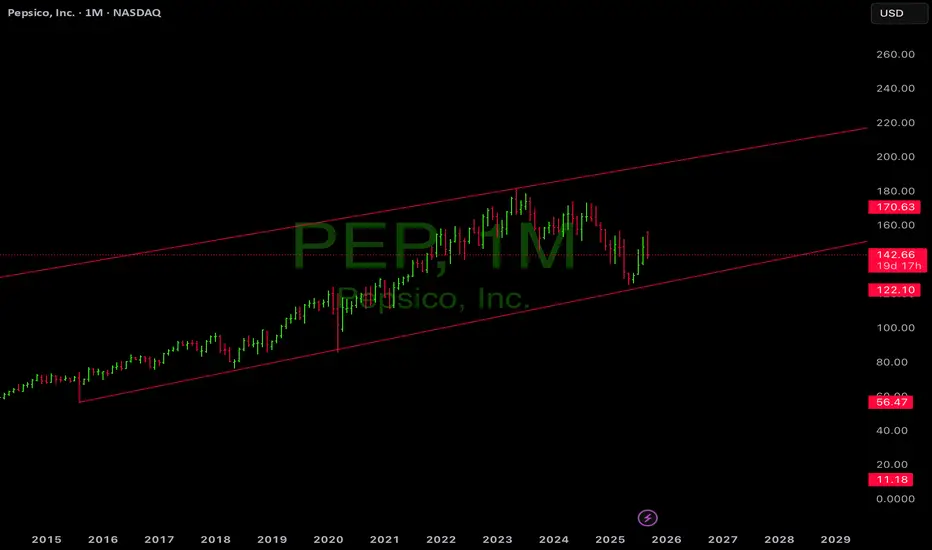
PEP - Good News For Dumb Money: Pepsico Prints A HTF Sell Signal"Good news" for non-technical buyers as "Elliott takes aim at PepsiCo with $4 billion stake; shares rise."
But PepsiCo is printing a nasty Gap-up-dump-down shakeout pattern above resistance as September opens.
This appears to be a terminal shakeout that can send PEP tumbling.
Up on the week chart
PEP (daily): long the cup and handlePepsi long based on technicals: looks to be resolving the handle part of the cup and handle, holding trend from June lows and riding the 20EMA. Williams ticking up, Neutral RSI has room to run, MACD ticking up. Increased tie-up with Celsius seen as positive. This could absolutely take off on a mo

PEP CFD: I bought Pepsico stock CFDI bought PEPSICo stock now, will explain the reason in the upcoming videos.
Disclaimer: This is not an investment or financial advise, this content is for education only.
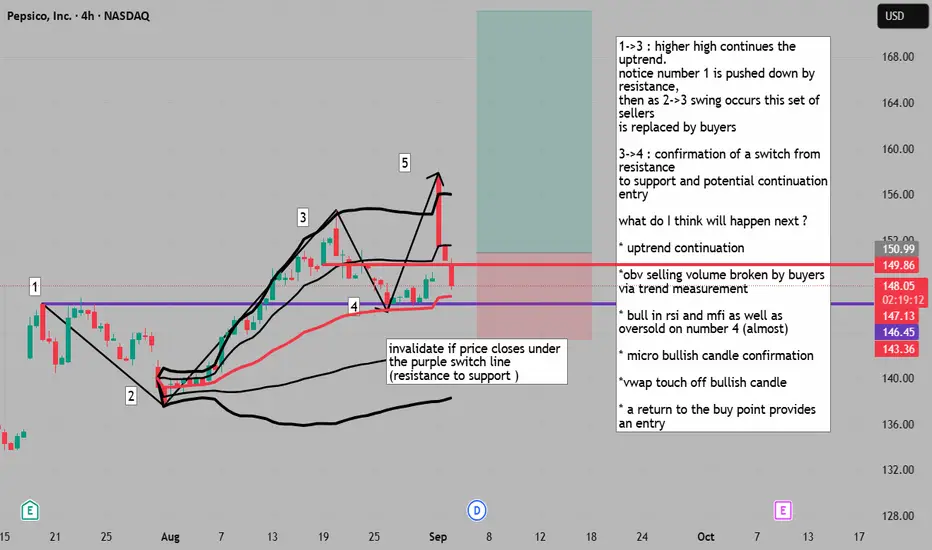
idea for return to support being a cheap entry 1->3 : higher high continues the uptrend.
notice number 1 is pushed down by resistance,
then as 2->3 swing occurs this set of sellers
is replaced by buyers
3->4 : confirmation of a switch from resistance
to support and potential continuation entry
what do I think will happen next ?
* uptrend
PEP 20/08/2025 LongPrice on the monthly chart is trying to close above the 100MA after a long period of downtrending. If the candle closes, it will confirm the return of the uptrend

PEP wedge breakout and 200day sma cross [/imag
NASDAQ:PEP is ready to rip. Bulls just need to step in here so it can go up to 160
I bought in at 135 area, holding shares LT, but there could be opportunities for some swing trading on a solid daily candle close above the wedge.

See all ideas
Summarizing what the indicators are suggesting.
Oscillators
Neutral
SellBuy
Strong sellStrong buy
Strong sellSellNeutralBuyStrong buy
Oscillators
Neutral
SellBuy
Strong sellStrong buy
Strong sellSellNeutralBuyStrong buy
Summary
Neutral
SellBuy
Strong sellStrong buy
Strong sellSellNeutralBuyStrong buy
Summary
Neutral
SellBuy
Strong sellStrong buy
Strong sellSellNeutralBuyStrong buy
Summary
Neutral
SellBuy
Strong sellStrong buy
Strong sellSellNeutralBuyStrong buy
Moving Averages
Neutral
SellBuy
Strong sellStrong buy
Strong sellSellNeutralBuyStrong buy
Moving Averages
Neutral
SellBuy
Strong sellStrong buy
Strong sellSellNeutralBuyStrong buy
Displays a symbol's price movements over previous years to identify recurring trends.


