Tsla - Box is Box?I have what seems like a thousand tesla charts now...and they are all telling me tesla needs to have a seat soon.
Tesla has been consolidating on the daily timeframe for quite a while now.
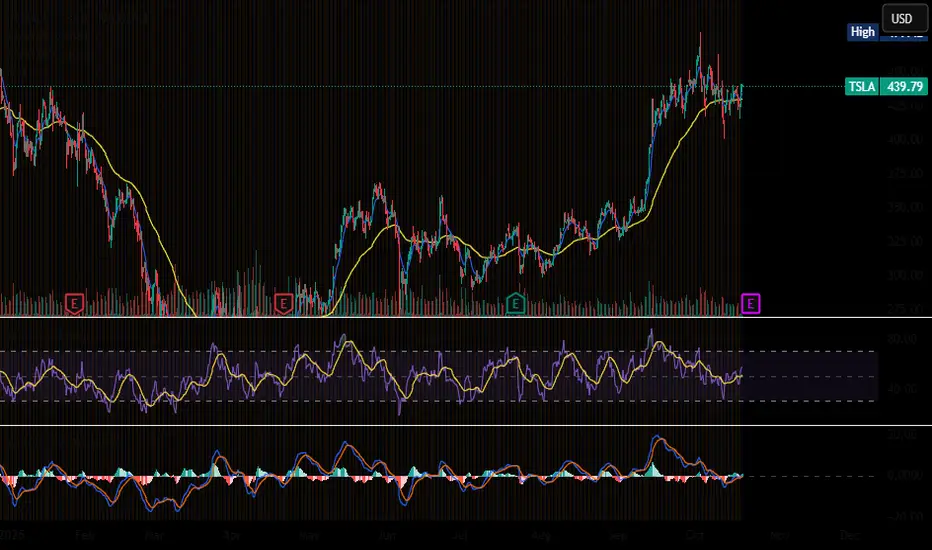
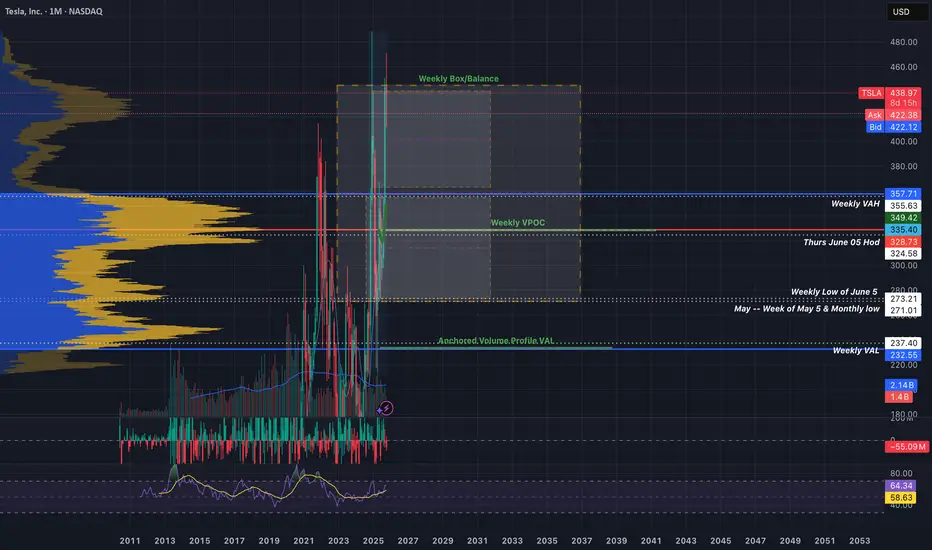
What happens if we continue to see presistent failures at the top of box or a look above and fail on the weekly? I'd put my money on a return to value.
At some point, tesla should revert back to the mean and I will be there waiting to LEAP at the opportunity(get it?).
I would love tesla around the weekly volume point of control around $245 area (this may shift as the days go by). If tesla retests the weekly value area high around $314 and is rejected then we may take a trip down to VPOC town.
Granted, for any of this to happen, we would need technicals to cooperate, meaning a LAAF of box and failure to hold the midpoint($384ish), as well as a turn in sentiment.
This could happen this fall or next march, who knows, but I'll be there when it does.
~The Villain
Trade ideas
Global Market Insights1. Introduction
The global market represents the vast, interconnected system through which goods, services, capital, and information flow across international borders. It encompasses multiple sectors—finance, manufacturing, technology, energy, commodities, and consumer markets—all interwoven through trade, investment, and policy networks. Global markets serve as the backbone of the modern economy, reflecting shifts in geopolitical influence, technological innovation, and consumer behavior. Understanding global market insights requires an in-depth view of these interconnections, examining how trends in one region or industry can ripple throughout the entire world economy.
The 21st century has witnessed dramatic globalization driven by digital transformation, liberalization of trade, and the rise of emerging economies. Yet, the landscape remains volatile due to political tensions, climate challenges, pandemics, and rapid technological disruption. Thus, global market insights today involve balancing opportunity with risk, short-term speculation with long-term sustainability.
2. The Structure of the Global Market
The global market is not a single unified entity but a network of interdependent systems. Its structure is defined by several core components:
a. Financial Markets
These include global exchanges for stocks, bonds, currencies, and derivatives. The major financial centers—New York, London, Tokyo, Hong Kong, and Singapore—drive liquidity and capital allocation worldwide. Financial markets influence investment decisions, currency valuations, and risk sentiment, often serving as early indicators of economic health.
b. Commodity Markets
These markets handle the trading of raw materials such as oil, gold, agricultural goods, and metals. Commodity prices are vital indicators of global supply-demand balance and economic activity. For instance, oil price fluctuations impact energy costs, inflation, and geopolitical stability.
c. Trade Networks
International trade forms the lifeblood of the global economy. Institutions such as the World Trade Organization (WTO) and regional trade agreements (e.g., USMCA, EU Single Market, ASEAN) shape cross-border exchange rules. Global supply chains connect producers and consumers across continents, emphasizing efficiency but also exposing vulnerabilities during crises.
d. Labor and Human Capital
A globally mobile workforce enables talent optimization, outsourcing, and competitive labor markets. Countries like India, the Philippines, and Vietnam have emerged as service and manufacturing hubs due to skilled labor and cost advantages.
e. Technological Ecosystems
Digital platforms, AI, and automation redefine how markets function. Technology companies now dominate global capitalization rankings, with firms such as Apple, Microsoft, and Tencent leading innovation-driven growth.
3. Key Drivers of Global Market Dynamics
Several forces collectively shape the global market environment. Understanding these drivers provides insight into long-term investment and policy trends.
a. Globalization and Trade Liberalization
Trade liberalization has historically propelled global economic growth by reducing tariffs and barriers. However, recent trends of protectionism and “friend-shoring” (relocating supply chains to allied nations) have created new trade dynamics. Countries are balancing globalization benefits with domestic economic security.
b. Technological Innovation
Artificial intelligence, blockchain, green energy, and biotechnology are revolutionizing productivity and business models. Fintech innovations democratize finance, while automation enhances manufacturing efficiency but also disrupts traditional labor markets.
c. Monetary Policy and Interest Rates
Central banks, particularly the U.S. Federal Reserve, European Central Bank, and Bank of Japan, influence global liquidity through interest rate policies. Low-rate environments stimulate investment, while tightening cycles tend to slow growth and shift capital flows.
d. Geopolitical Tensions
Conflicts, trade wars, and sanctions significantly affect global stability. For instance, U.S.-China rivalry shapes global technology access, supply chains, and foreign investment patterns. Similarly, regional conflicts like those in Eastern Europe and the Middle East disrupt energy supplies and commodity prices.
e. Environmental and Climate Considerations
Climate change has emerged as both a risk and an opportunity for global markets. Green energy investments, carbon pricing, and sustainable finance are transforming industries. Companies increasingly adopt ESG (Environmental, Social, Governance) frameworks to align profitability with sustainability.
4. Regional Market Insights
a. North America
The United States remains the world’s largest economy, driven by innovation, consumer spending, and strong financial markets. Canada complements this with robust energy and resource exports. North American markets are characterized by technological dominance, resilient consumption, and deep capital markets, though debt levels and political polarization pose risks.
b. Europe
Europe’s markets are defined by regulatory strength and industrial diversity. The European Union (EU) remains a global trade powerhouse, but it faces challenges such as slow growth, aging populations, and energy dependency. The post-Brexit landscape continues to redefine trade and financial dynamics.
c. Asia-Pacific
Asia is the epicenter of global growth. China’s transition from manufacturing to consumption-driven growth, India’s digital and service-led expansion, and Southeast Asia’s emerging consumer economies drive demand and innovation. Japan and South Korea continue to lead in technology and advanced manufacturing.
d. Latin America
Rich in natural resources, Latin America’s growth is often tied to commodity cycles. Political instability and inflation challenges persist, yet nations like Brazil, Chile, and Mexico are modernizing their industries and integrating more deeply into global value chains.
e. Africa and the Middle East
Africa’s markets offer high growth potential due to demographics and natural resources. However, infrastructure deficits and governance issues limit progress. The Middle East remains energy-centric, but nations like Saudi Arabia and the UAE are diversifying into tourism, technology, and renewable energy.
5. Global Market Trends and Transformations
a. Digitalization and E-Commerce
E-commerce, digital payments, and data-driven marketing have reshaped consumer behavior. Platforms such as Amazon, Alibaba, and Shopify integrate technology with logistics, enabling borderless retail markets.
b. Shift to Green Economies
Sustainable finance and renewable energy investments are accelerating. Electric vehicles, solar energy, and carbon credit markets exemplify the shift from fossil fuels toward decarbonized economies.
c. Rise of Emerging Markets
Emerging economies contribute over 60% of global GDP growth. Rapid urbanization, expanding middle classes, and technological adoption make these regions central to future global demand.
d. Supply Chain Realignment
COVID-19 exposed vulnerabilities in global supply chains. Companies now diversify sourcing through “China+1” strategies, reshoring, or nearshoring to enhance resilience.
e. Financial Digitalization
The global financial system is undergoing a technological revolution—cryptocurrencies, central bank digital currencies (CBDCs), and decentralized finance (DeFi) redefine how value is exchanged and stored.
6. Challenges in the Global Market
a. Economic Inequality
Globalization has lifted millions out of poverty but also widened income gaps. Developed nations face stagnating wages, while emerging markets grapple with uneven wealth distribution.
b. Inflation and Debt Pressures
Post-pandemic stimulus and geopolitical disruptions have driven inflationary pressures. High public and private debt levels threaten fiscal stability in several economies.
c. Geopolitical Fragmentation
Rising nationalism, trade barriers, and regional conflicts threaten global cooperation. The move toward multipolarity—where power is distributed across multiple regions—complicates policy coordination.
d. Technological Disruption
While innovation fuels growth, it also causes displacement. Automation, AI, and robotics could replace millions of jobs, demanding urgent skill development and policy adaptation.
e. Environmental Risks
Climate change, resource depletion, and extreme weather events increasingly disrupt markets. Sustainable investment and risk mitigation are becoming essential components of global economic strategy.
7. Opportunities in the Global Market
a. Green and Renewable Technologies
Investing in renewable energy, electric vehicles, and sustainable infrastructure offers massive long-term potential. Global climate policies encourage public-private collaboration in this sector.
b. Digital Transformation
AI, IoT (Internet of Things), 5G, and cloud computing provide opportunities for companies to enhance efficiency and innovation. Digitalization also opens new frontiers in fintech, healthcare, and education.
c. Emerging Market Expansion
Asia, Africa, and Latin America present enormous consumer and investment opportunities. Infrastructure development, mobile banking, and digital entrepreneurship are rapidly scaling.
d. Healthcare and Biotechnology
The pandemic accelerated innovation in healthcare, telemedicine, and biotechnology. Aging populations and increased health awareness drive continued global demand.
e. Financial Inclusion and Fintech
Fintech startups are democratizing access to financial services. Mobile payments, digital lending, and blockchain solutions bridge the gap for unbanked populations.
8. The Role of Policy and Global Institutions
Global markets depend on policy coordination and institutional support. Organizations such as the IMF (International Monetary Fund), World Bank, WTO, and OECD provide frameworks for trade, investment, and development. Meanwhile, regional alliances—like the EU, ASEAN, and BRICS—enhance collective bargaining power.
Monetary policies from leading central banks influence global liquidity. Regulatory bodies now emphasize transparency, cybersecurity, and ESG standards to safeguard global market stability. Effective governance remains essential to mitigate systemic risks and foster inclusive growth.
9. The Future Outlook
The future of global markets will be defined by adaptation—economic, technological, and environmental. We are entering a multipolar world, where economic influence is shared among the U.S., China, the EU, and emerging economies. Technology will continue to integrate markets, but digital sovereignty and cybersecurity will emerge as major battlegrounds.
Artificial intelligence and automation will revolutionize industries, while green transitions redefine energy and transportation systems. However, sustained global growth depends on balancing profit with sustainability, and innovation with inclusivity.
Global markets are likely to remain volatile in the short term due to inflation cycles, geopolitical uncertainty, and climate challenges. Yet, long-term prospects remain positive, driven by human ingenuity, digital innovation, and cross-border collaboration.
10. Conclusion
Global market insights reveal a dynamic, interconnected, and ever-evolving system that mirrors humanity’s economic ambitions and collective challenges. The interplay of technology, policy, and capital continues to transform industries and societies. While globalization has delivered prosperity and innovation, it also presents new risks—economic inequality, environmental degradation, and political fragmentation.
The key to thriving in the global market lies in adaptability, diversification, and sustainable strategy. Businesses, investors, and governments must embrace change, leverage digital transformation, and commit to ethical and resilient growth models. In this intricate web of interdependence, understanding global market insights is not just an academic pursuit—it is a strategic necessity for the future of global prosperity.
Quantitative and Algorithmic Trading in the Global MarketIntroduction
In the ever-evolving world of financial markets, quantitative and algorithmic trading have emerged as the twin engines powering modern investment and trading strategies. They represent the fusion of finance, mathematics, statistics, and computer science to create data-driven, rule-based systems capable of executing trades with precision and speed beyond human capability. Over the past three decades, these methods have transformed global trading dynamics — reshaping liquidity, price discovery, and even the structure of exchanges. Quantitative and algorithmic trading now dominate trading volumes in equities, forex, commodities, and derivatives markets worldwide.
This essay explores the concepts, strategies, technologies, advantages, and risks associated with quantitative and algorithmic trading, as well as their impact on global financial markets.
Understanding Quantitative and Algorithmic Trading
Quantitative trading refers to the use of mathematical and statistical models to identify trading opportunities. It relies heavily on quantitative analysis, which involves collecting large sets of historical and real-time market data, identifying patterns, and forecasting potential price movements. Quantitative traders, often called “quants,” use sophisticated models to test hypotheses and develop systematic strategies for profit generation.
Algorithmic trading (Algo trading), on the other hand, is the practical implementation of these quantitative models through computer algorithms that automatically execute trades. It involves predefined instructions that specify when, how, and how much to trade, based on parameters such as timing, price, volume, and market conditions.
In simple terms, quantitative trading focuses on the “why” — the logic and mathematical framework — while algorithmic trading handles the “how” — the automation and execution of the strategy.
Historical Evolution
The roots of quantitative trading can be traced back to the 1970s when computers were first used for portfolio optimization and risk management. Pioneers like Edward Thorp, the author of Beat the Market, applied probability theory to stock trading and option pricing, laying the foundation for quant finance.
The 1980s and 1990s witnessed the rise of electronic trading platforms, which enabled automated order matching. Firms like Renaissance Technologies and D.E. Shaw built statistical arbitrage models that consistently delivered high returns using advanced mathematics.
By the 2000s, algorithmic trading became mainstream, aided by technological progress, faster data transmission, and regulatory changes such as the U.S. SEC’s approval of electronic communication networks (ECNs). High-Frequency Trading (HFT) — the fastest form of algorithmic trading — emerged, executing thousands of orders in milliseconds. Today, more than 70% of equity trades in developed markets like the U.S. and Europe are executed algorithmically.
Core Components of Quantitative and Algorithmic Trading
Data Acquisition and Management
Data is the lifeblood of quantitative trading. Traders collect massive datasets — historical prices, order book information, news sentiment, economic indicators, and alternative data such as satellite images or social media trends. This data is cleaned, normalized, and stored for analysis using advanced databases and cloud computing systems.
Model Development and Backtesting
Quant models are developed using statistical and machine learning techniques to forecast price movements or detect inefficiencies. Backtesting evaluates these models on historical data to verify performance and robustness before deployment in live markets.
Execution Algorithms
Algorithms are designed to execute trades efficiently while minimizing market impact and transaction costs. Common execution algorithms include Volume Weighted Average Price (VWAP), Time Weighted Average Price (TWAP), and Percentage of Volume (POV).
Risk Management Systems
Every quantitative model includes strict risk controls — such as stop-loss mechanisms, position limits, and exposure checks — to protect against unforeseen market events and model failures.
Infrastructure and Technology
Cutting-edge hardware, low-latency networks, and co-location services (placing trading servers near exchange data centers) are essential for high-frequency and algorithmic trading. Millisecond delays can mean the difference between profit and loss.
Types of Quantitative and Algorithmic Strategies
Statistical Arbitrage
This involves exploiting short-term price inefficiencies between related securities. For instance, pairs trading identifies two correlated assets — when their price relationship diverges, one is bought and the other is sold short, expecting reversion to the mean.
Trend-Following Models
These algorithms capitalize on persistent market trends using indicators like moving averages or momentum oscillators. When the price breaks above a defined resistance, a buy signal is triggered.
Mean Reversion Strategies
Based on the idea that prices tend to revert to their long-term average, these models look for overbought or oversold conditions.
Market Making Algorithms
Market makers continuously quote buy and sell prices, earning the bid-ask spread while providing liquidity. Algorithms dynamically adjust quotes based on volatility and order flow.
High-Frequency Trading (HFT)
HFT strategies execute thousands of trades per second to exploit micro-inefficiencies. Techniques include latency arbitrage and order anticipation.
Machine Learning-Based Strategies
Modern quants increasingly use artificial intelligence and deep learning models to analyze nonlinear patterns in large datasets, from news sentiment to macroeconomic variables.
Event-Driven Trading
Algorithms react to real-time events such as earnings announcements, mergers, or geopolitical developments. For example, a positive earnings surprise may trigger a buy signal.
Index Arbitrage and ETF Strategies
These exploit price differences between index futures, exchange-traded funds, and their underlying constituents.
Quantitative and Algorithmic Trading in Major Global Markets
United States
The U.S. is the global hub of algorithmic trading, accounting for the majority of automated volume. Major exchanges like NASDAQ and NYSE provide low-latency access, and firms such as Citadel Securities, Renaissance Technologies, and Jane Street dominate market making and quant strategies.
Europe
European markets, regulated under MiFID II, emphasize transparency and fairness in algorithmic trading. London remains a major center for hedge funds and algorithmic firms.
Asia-Pacific
Algorithmic trading is rapidly expanding in markets like Japan, Singapore, Hong Kong, and India. In India, the National Stock Exchange (NSE) supports co-location and direct market access, making it one of the fastest-growing algorithmic ecosystems.
Emerging Markets
Countries such as Brazil, South Africa, and the Middle East are adopting algorithmic platforms, although liquidity and infrastructure remain developmental challenges.
Benefits of Quantitative and Algorithmic Trading
Speed and Efficiency
Algorithms execute orders within microseconds, allowing traders to capture fleeting market opportunities impossible for humans to detect manually.
Reduced Human Bias
Trading decisions are based on predefined logic rather than emotion, minimizing psychological biases such as fear and greed.
Lower Transaction Costs
Smart order routing and optimal execution algorithms reduce slippage and market impact, enhancing profitability.
Liquidity Enhancement
Market-making algorithms continuously provide buy and sell orders, improving liquidity and narrowing bid-ask spreads.
Scalability
A single algorithm can manage thousands of securities across global markets simultaneously, offering unmatched scalability.
Backtesting and Optimization
Quantitative systems can be tested extensively on historical data, refining strategies before real-world application.
Risks and Challenges
Despite their advantages, quantitative and algorithmic trading come with significant risks:
Model Risk
Models are based on assumptions that may fail under changing market conditions. A small coding error or mis-specified model can cause massive losses.
Overfitting and Data Snooping
Over-optimization of models on historical data can produce unrealistic results that fail in live trading.
Liquidity and Flash Crashes
Excessive algorithmic activity can amplify volatility. The 2010 U.S. “Flash Crash” highlighted how algorithmic feedback loops could trigger rapid market collapses.
Regulatory Risk
Regulators globally are tightening oversight of algorithmic trading to prevent manipulation and ensure fairness. Compliance costs and monitoring requirements are rising.
Technology Failures
System outages, latency issues, or cyberattacks can disrupt trading and cause severe financial losses.
Competition and Market Saturation
As more participants adopt similar strategies, profit margins shrink, and edge becomes increasingly difficult to maintain.
Regulatory Framework and Global Standards
Regulators worldwide are implementing rules to govern algorithmic and high-frequency trading.
In the United States, the SEC and CFTC monitor automated trading for fairness, requiring disclosure of algorithms and pre-trade risk checks.
In Europe, MiFID II mandates firms to test algorithms, maintain kill-switch mechanisms, and provide detailed audit trails.
In India, SEBI regulates algorithmic trading by requiring pre-approval, audit certification, and real-time risk management systems.
These measures aim to balance innovation with market integrity and investor protection.
Technological Advancements Driving the Future
The next phase of quantitative and algorithmic trading will be shaped by technologies such as:
Artificial Intelligence and Deep Learning – Algorithms that learn autonomously from new data, improving accuracy over time.
Natural Language Processing (NLP) – Automated interpretation of news, tweets, and reports to derive trading signals.
Quantum Computing – Offering unprecedented processing power for portfolio optimization and complex simulations.
Blockchain Integration – Enhancing transparency, settlement efficiency, and security in algorithmic transactions.
Cloud Computing and Big Data – Allowing scalable data storage and computation across global markets in real time.
Impact on Global Market Dynamics
Quantitative and algorithmic trading have profoundly reshaped market structure. They have enhanced liquidity, tightened spreads, and accelerated price discovery. However, they also contribute to short-term volatility and market fragmentation across multiple venues.
Institutional investors now compete with sophisticated algorithms, while retail traders benefit indirectly through lower costs and better execution. Exchanges have evolved to accommodate high-speed connectivity, and data analytics has become a core asset for every financial institution. The global market, once driven by intuition and human judgment, is now governed largely by algorithms and machine intelligence.
Conclusion
Quantitative and algorithmic trading represent the pinnacle of financial innovation, combining mathematics, computation, and automation to redefine how markets operate. They have democratized access to efficient trading tools while challenging traditional notions of value, speed, and human decision-making.
Yet, with great power comes great responsibility — ensuring transparency, ethical deployment, and robust regulation will determine the sustainable future of algorithmic trading. As artificial intelligence and data science advance further, quantitative trading will continue to evolve, shaping global markets that are faster, smarter, and more interconnected than ever before.
TSLA – Mild Pullback Before Resuming Its Upward TrajectoryHello everyone,
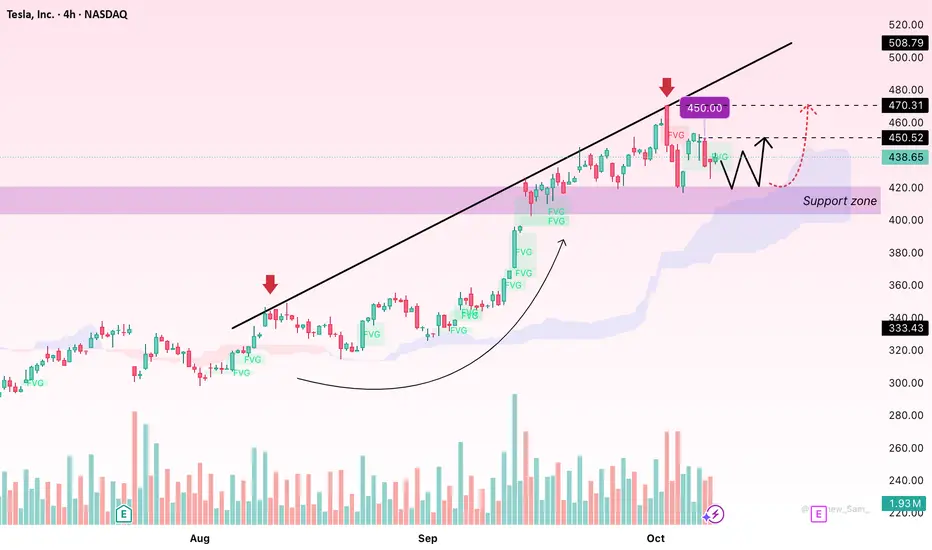
Tesla (TSLA) is showing a healthy technical pullback after an impressive rally, yet the broader bullish trend remains intact. The stock is currently hovering around $438.69, down 4.5% in the latest session — a move that reflects short-term profit-taking rather than a shift in market sentiment.
On the news side, Tesla has just unveiled lower-cost versions of the Model 3 and Model Y — a strategic decision aimed at expanding its mid-range customer base. However, the market’s reaction has been somewhat cautious, possibly due to concerns over shrinking profit margins as prices drop. Nevertheless, this move allows Tesla to strengthen its global footprint and improve competitiveness, particularly in key markets like China and Europe.
At the same time, the company continues to advance its Full Self-Driving (FSD) technology and the Robotaxi project — seen as Tesla’s long-term growth pillars. Once fully realised, autonomous mobility services could unlock significant recurring revenue, reinforcing investor confidence even amid short-term corrections.
From a technical perspective, the 4H chart indicates that price remains well above the Ichimoku cloud, confirming that the uptrend still dominates. Shallow Fair Value Gaps (FVGs) have been filled, hinting that price might retest support before rebounding. The $430–$420 area serves as a critical support zone, while resistance stands near $440 and $445. A clear breakout above $440 could open the path toward $450–$460.
Overall, Tesla appears to be consolidating within a natural pause rather than reversing. As long as the $420 level holds, the bullish structure remains valid.
What about you — do you see this pullback as a springboard for new highs, or the start of a longer consolidation phase for TSLA?
Tesla rebounds – Can $445 hold to push toward $460?Hello everyone,
Tesla has staged a notable recovery today, with price trading around $447.43, up 1.82% from the previous session. Importantly, the price has broken above the $443.70 resistance level, signalling that buying momentum has returned to the market.
Currently, the price structure leans towards a short-term bullish outlook. If Tesla can sustain above $445, the upward move may continue toward the $455–$460 region, which is seen as the next resistance zone. However, if the price weakens and falls back under $440, a corrective move toward $430 would come back into play. This remains a key support area to watch.
From a news perspective, market sentiment is being strongly supported. CEO Elon Musk has projected that Tesla’s vehicle sales could grow by 20–30% next year, easing investor concerns around the robotaxi project. Following his remarks, Tesla shares listed in Frankfurt surged as much as 12%, reaching their highest level in two weeks, suggesting that confidence is gradually returning to the stock.
So what do you think – will Tesla hold above $445 and head toward $460, or will it retest $440 before any continuation? Share your view below!

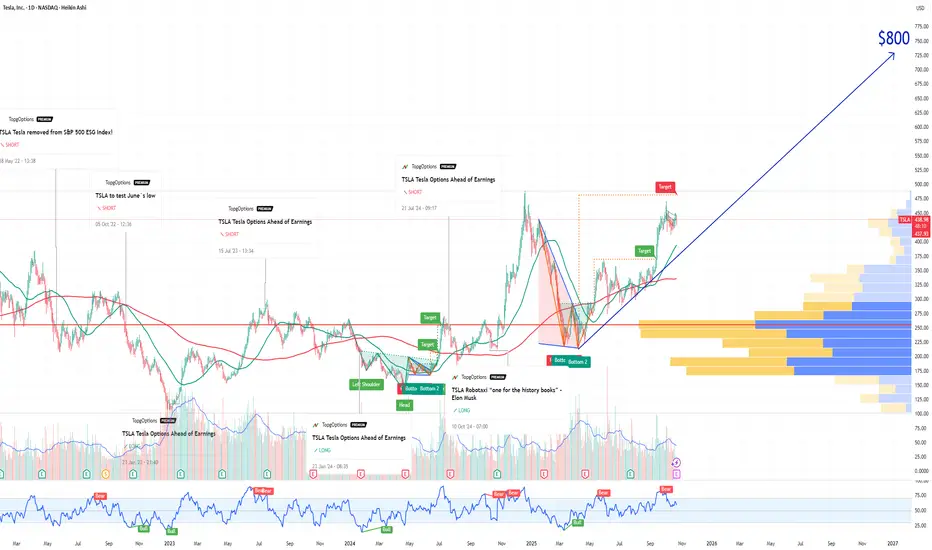
TSLA Tesla Options Ahead of EarningsIf you haven`t bought the dip on TSLA:
Now analyzing the options chain and the chart patterns of TSLA Tesla prior to the earnings report this week,
I would consider purchasing the 800usd strike price Calls with
an expiration date of 2027-1-15,
for a premium of approximately $40.30.
If these options prove to be profitable prior to the earnings release, I would sell at least half of them.
Tesla Earnings PredictionI expect price to fill gap at 400$ before price reaches all-time highs. Opposite scenario is price reaches and spikes above all-time highs then fills gap before continuing to the upside.

Tesla Earnings Tonight – Growth Era Under Pressure?TSLA reports Q3 2025 earnings after the bell.
Estimates: $0.55 EPS (+37.5% QoQ) and $26.46 B revenue (+18%).
Strong on paper — but the real story will come from forward guidance.
What’s beneath the surface:
Inventory is rising as production outpaces sales since Q4 2024.
Annual revenue growth turned negative in Q2 2025.
EBT has declined roughly 11% per quarter since Q3 2024.
China’s rare-earth export limits tighten Tesla’s margins and favour BYD & NIO.
Technical Outlook:
TSLA remains range-bound between $411.6 – $448.2 (heavy volume zone).
If price moves higher, watch $470.5 (previous high) and $488.5 (ATH).
If it dips, $367.9 (Value Area High) is the support to watch.
Volatility is tightening — tonight’s tone on guidance could decide whether Tesla stays range-bound or starts a new phase.

TSLA: Fundamentals Are Collapsing While Valuation Stays in OrbitTesla is trading near multi-month highs… but the fundamentals tell a very different story.
EPS has dropped by 50%, revenue growth has almost stalled, and yet the stock still carries a Forward P/E of 164.
This combination — slowing growth and extreme valuation — looks like the definition of an institutional bubble setup.
🧮 Fundamental Context
Over the past few years, Tesla’s growth has slowed dramatically:
Revenue rose from 31B → 53B → 81B → 96B → 97B — barely any increase.
EPS climbed from 0.2 → 1.6 → 3.6 → 4.3 — and then fell by half.
Quarter-over-quarter metrics remain negative, with no visible recovery trend.
Meanwhile, the Forward P/E of 164 implies double-digit expansion ahead — which clearly isn’t happening.
The fundamentals simply do not justify this kind of valuation.
Right now, Tesla’s numbers resemble the early phase of a valuation compression cycle — where prices eventually catch up with reality.
📉 Technical Structure
Technically, Tesla has been moving in a broad sideways range, forming what looks like a long-term Wave 4 structure.
We’re currently inside the “B” leg, which could already be complete or near completion.
Once that wave ends, the next expected move is a Wave C decline.
Key levels to watch:
📍 Upper resistance zone: $400 – $550
📍 Primary cluster: around $250
📍 Support zone: $150 – $200
The chart shows clear volume concentration around $250 — once that level breaks, the next liquidity pocket sits between $150 and $200.
That’s where a potential bottoming cluster could form before the final upward leg.
⚠️ Market Outlook
While other FANG names maintain solid balance sheets and stable earnings, Tesla’s fundamentals are deteriorating sharply.
Yes, the stock may still see short-term pumps driven by sentiment or Musk’s fan base — but markets always return to fundamentals.
And those fundamentals are pointing downward.
📊 Summary
EPS and revenue both trending lower 📉
Forward P/E at 164 — completely disconnected from growth metrics
Technical range suggests potential decline toward $200–$150
Current price action likely part of a larger corrective structure
Long-term investors should exercise extreme caution ⚠️
Tesla isn’t a short-term “growth story” anymore — it’s a valuation risk story.
Until earnings stabilize and margins recover, this stock looks massively overpriced.

Dip Buying Levels on TSLA Post Earnings"Abide in me, and I in you. As the branch cannot bear fruit by itself, unless it abides in the vine, neither can you, unless you abide in me. I am the vine; you are the branches. Whoever abides in me and I in him, he it is that bears much fruit, for apart from me you can do nothing."
- John 15:4-5
Hello Traders!
As part of my weekly equity trade analysis, I will be uploading my recordings of what I am seeing and intending to trade for the week. A quick summary of what's in the video is as follows:
- TSLA earnings are highly anticipated with most retail traders expecting bullish continuation from its breakout from previous consolidation
- We are expecting a retracement to resolve some imbalances, but to structurally hold key levels either above $408 or $385, and to close the week above last week's high over $440
- Our vehicle of choice this week are the $430 weekly calls or $415 calls (if price retraces further to $390)
Cheers,
DTD
Financial Risk Disclaimer |
DISCLAIMER: I am not a financial adviser. The videos on my channel are for educational and entertainment purposes only. I'm just showing you guys how I invest and day trade, but remember, investing of any kind involves risk. Your investments are solely your responsibility and not mine. While day trading can bring substantial gains, it can also bring serious losses! So make sure you do your research to fully understand the market before diving in. The possibility exists that you could sustain a loss of some or all of your initial investment, and therefore should not invest money that you can't afford to lose. The fluctuation of the market can work for you or against you. You should carefully consider your investment objectives and experience before deciding to trade in the market. Again, what you invest in is solely your responsibility.

TSLA earnings thoughtsI personally believe / think TSLA will open flat and option premium will dry up. Any put sales or CC over earnings I will buy to close after a flat open
and probably sell more for late NOV depending on open...

TESLA New Bullish Leg to $600 has started.Last time we took a look at Tesla (TSLA) more than a month ago (September 11, see chart below), we gave a massive buy signal that worked out instantly, as we saw the resemblances between the recent Triangle accumulation pattern and that of late 2024, setting a $600 long-term Target:
This time we take a better look at the Channel Up that has emerged. Technically it looks like a Bearish Leg (red Channel Down) has ended and with the 1D MA50 (blue trend-line) holding, a new Bullish Leg has been initiated.
The previous Bullish Leg, which by the way started after a 1D MA100 (green trend-line) hold, rose by +59.26%. This puts the next Higher High technically above our $600 long-term Target.
Notice also how the 1D MACD is about to form a new Bullish Cross, with all previous ones being a strong Buy Signal. At the same time, the 1D RSI found support and bounced on its 5-month Higher Lows trend-line.
-------------------------------------------------------------------------------
** Please LIKE 👍, FOLLOW ✅, SHARE 🙌 and COMMENT ✍ if you enjoy this idea! Also share your ideas and charts in the comments section below! This is best way to keep it relevant, support us, keep the content here free and allow the idea to reach as many people as possible. **
-------------------------------------------------------------------------------
💸💸💸💸💸💸
👇 👇 👇 👇 👇 👇


3 Common Trading Mistakes Traders Should AvoidTraders of all levels, from beginners to experienced professionals, can fall prey to psychological mistakes that can lead to poor trading decisions and ultimately, losses. Understanding and avoiding these common mistakes is crucial for developing a sound trading strategy and achieving consistent success in the markets.
Here are three of the most prevalent trading mistakes traders should strive to avoid:
FOMO (Fear of Missing Out): FOMO is a pervasive emotion that can cloud traders' judgment and lead them to make impulsive decisions based on the fear of missing out on potential profits. This often involves chasing trends or entering trades without proper analysis, increasing the risk of losses.
To combat FOMO, traders should adhere to their trading plan, prioritize discipline, and focus on identifying high-probability trading opportunities rather than reacting to market movements out of fear.
Revenge Trading: Revenge trading is the emotional urge to recoup losses from previous trades by making hasty and ill-advised decisions. This often stems from a desire to prove one's rightness or regain a sense of control over the market.
To avoid revenge trading, traders should cultivate emotional detachment, accept losses as a natural part of trading, and avoid the temptation to let emotions dictate their trading decisions.
Gambler's Fallacy: The gambler's fallacy is the mistaken belief that past events influence the outcome of future events, leading to an assumption that trends will continue indefinitely or that random events can be predicted.
To overcome the gambler's fallacy, traders should recognize that each trade is an independent event with its own unique probabilities, and past performance is not a guarantee of future results. They should rely on sound trading analysis and risk management techniques rather than relying on hunches or superstitions.
By avoiding these common psychological mistakes, traders can develop a more disciplined and rational approach to trading, increasing their chances of achieving long-term success in the markets.

TSLA – Sideways Accumulation Phase Ahead of Major NewsTesla’s stock is currently showing a stable sideways movement around the 430–445 USD range as the market awaits the company’s Q3 earnings report (on October 22).
Recent news reflects cautious investor sentiment , especially after ISS recommended rejecting Elon Musk’s massive compensation package and amid forecasts suggesting a slight decline in Q3 profits.
On the 4-hour chart, TSLA continues to maintain a medium-term uptrend, with prices oscillating around the EMA34 and EMA89, which act as equilibrium zones.
The 432 USD area remains the main support, while 493 USD stands as a key resistance level.
The chart indicates a high likelihood that the price will continue sideways within this range until the market reacts more clearly after the earnings release.
Summary
Currently, TSLA is in an accumulation phase , reflecting a tug-of-war between expectations of increased production and concerns over profit margin pressures.
In the short term, the trend is expected to remain sideways with a slight bullish bias, awaiting a potential breakout driven by the upcoming earnings announcement.

TSLA Breakout Watch – Key Resistance at $450
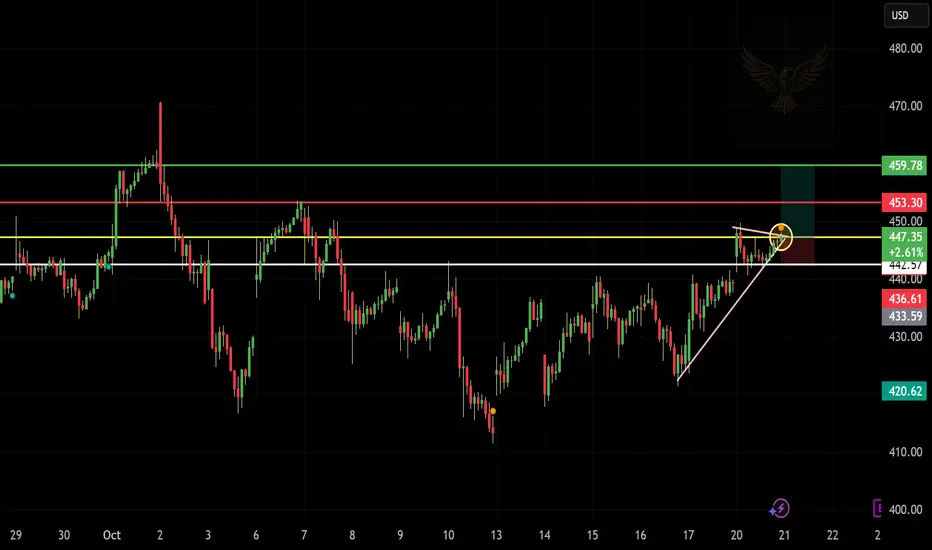
Tesla (TSLA) is forming a bullish ascending triangle pattern, testing the $447–$450 resistance zone.
A breakout above this level could trigger upside momentum toward $453 and $459 (next resistance levels).
If rejected, the stock may retest $442 or $436 support before the next move.
📊 Bias: Bullish above $447 — Breakout confirmation needed.
🎯 Targets: 453 / 459
🛑 Support: 442 / 436
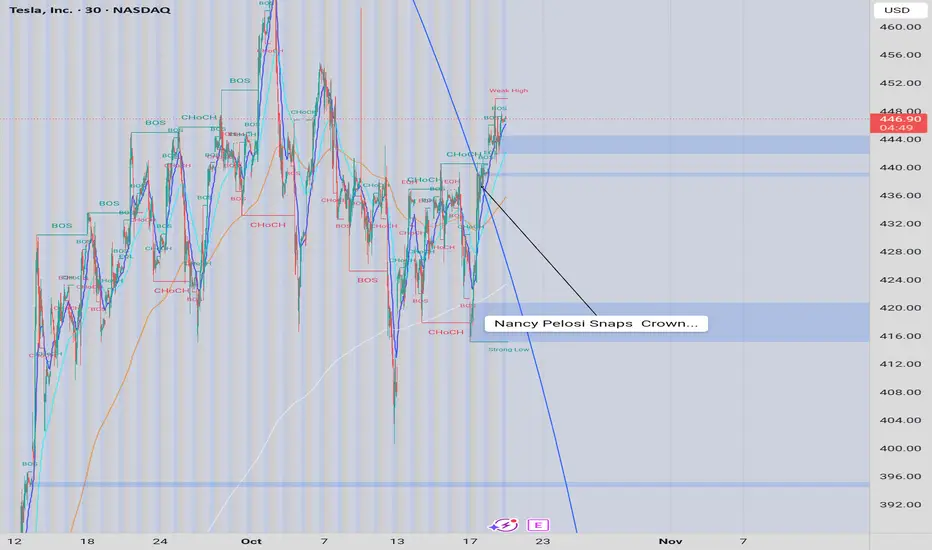
The "No kings" pattern. Another sign liberals are just complainers and add no substance to society. Almost a quarter million dollars in rallies because you can't read a chart. Will Nancy still profit from tesla earnings this week?
Volatility Period: Around October 22nd (October 21st-23rd)
Hello, traders!
If you "Follow" us, you'll always get the latest information quickly.
Have a great day.
-------------------------------------
(TSLA 1M Chart)
The key is whether the price can rise above the target level of 488.54 by following the rising channel.
If the price fails to rise, we should check for support near 381.59.
-
(1W Chart)
The rising trend line (1) has formed, forming an ascending channel.
Therefore, the key is whether the price can maintain above the rising trend line (2) and rise along the rising channel.
The HA-High ~ DOM(60) range on the 1W chart is formed in the 382.40-421.06 range. If the price remains above this range, a stepwise uptrend is expected to continue.
-
(1D chart)
The key question is whether the price can continue its upward trend toward 488.54 after passing through this volatile period around October 22nd (October 21st-23rd).
To do so, we need to see if it can find support and rise around 439.60-442.79.
-
Thank you for reading to the end.
I wish you successful trading.
--------------------------------------------------

Check Out Tesla's Chart Heading Into This Week's Earnings ReportTesla NASDAQ:TSLA will report earnings this week at a time when the stock is trailing the S&P 500 year to date, although it's beating the key index in the six-month, one-year and five-year periods. What does the electric-vehicle giant's technical and fundamental analysis say?
Let's check things out:
Tesla's Fundamental Analysis
It wasn't that long ago (2023) that CEO Elon Musk forecast that TSLA could end up producing roughly 250,000 Cybertrucks per year.
But so far, that projection has been a "no-go." Cox Automotive reported the other day that the electric-vehicle giant sold just some 5,400 of the trucks in Q3. That's a 63% year-over-year contraction -- and for comparison's sake, Ford NYSE:F sold more than 207,000 F-Series pickups during the same period, including 10,000 F-150 Lightning electric trucks.
Meanwhile, Car and Driver recently reported that the lower-cost Cybertruck Long Range model doesn't match the range of the (admittedly more expensive) dual-motor R1T electric pickup from Rivian NASDAQ:RIVN .
But all is not lost, sort of, for Tesla.
The EV giant recently released Q3 delivery figures and reported that it shipped some 497,100 vehicles overall -- a record for the firm, and better than the 448,000 consensus that Tesla watchers had expected.
Apparently, there was an end-of-quarter rush as U.S. consumers tried to take advantage of a $7,500 federal electric-vehicle tax credit before the benefit expired on Sept. 30.
Tesla also built 447,000 vehicles during Q3 (a different metric from the number of cars delivered).
As for earnings, analysts' consensus view calls for Tesla to report $0.55 in adjusted earnings per share on about $26.6 billion of revenue when the firm releases results Wednesday after the bell. That would represent a 23.6% drop from the $0.72 in adjusted EPS that Tesla reported in the same period a year earlier, while reflecting 5.6% year-over-year growth from Q3 2024's $25.2 billion in revenue.
Still, 16 of the 25 sell-side analysts that I know of who cover TSLA have boosted their Q3 earnings estimates since the quarter started, while only five have revised things downward. (Four have left their estimates unchanged.)
Tesla's Technical Analysis
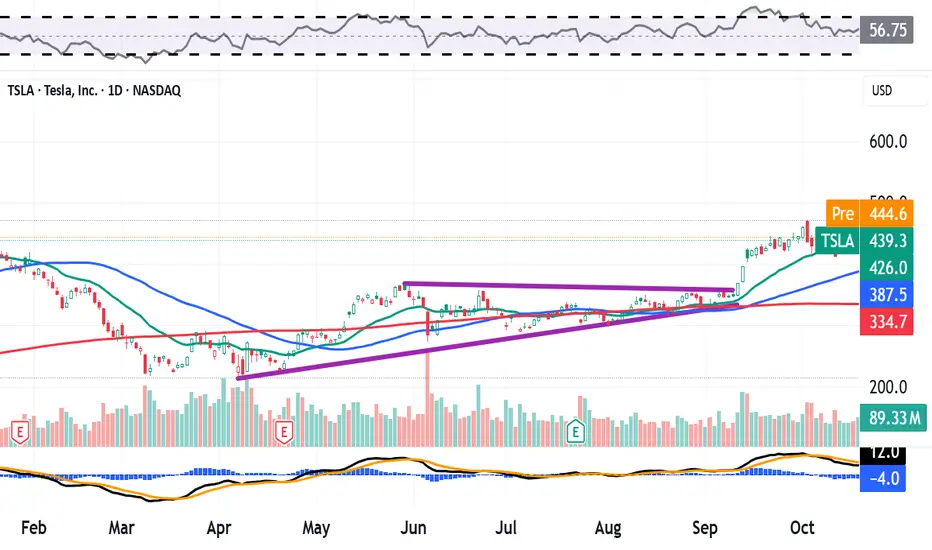
Now let's look at TSLA's year-to-date chart as of Tuesday afternoon:
Readers will see that a "closing-pennant" pattern (marked with purple lines) produced a mid-September breakout for the stock.
Closing pennants historically foretell a sharp spike in volatility for a stock, but don't tell you which direction the move will be: up or down.
In this case, Tesla went higher and built upon the breakout that the stock saw in May from a double-bottom pattern of bullish reversal (the jagged lines at the chart's left).
The stock apexed on Oct. 2 at $470, which is about what some investors might have expected from such a set-up. (Tesla closed Friday at $439.31.)
Now, TSLA looks as if it might have topped going into earnings, and the stock has recently relied upon its 21-day Exponential Moving Average (or "EMA," marked with a green line at $423.60 in the chart above) for support.
This suggests that the swing crowd is likely playing this earnings release, which could lead to some increased volatility after Tesla's Q3 numbers come out.
Looking at Tesla's secondary technical indicators, the stock's Relative Strength Index (the gray line at the chart's top) has drawn back towards neutral after exploding into technically overbought territory in September.
That said, assessing Tesla's daily Moving Average Convergence Divergence indication (or "MACD," denoted by black and gold lines and blue bars at the chart's bottom) is tricky.
The histogram of the 9-day EMA (the blue bars) dropped into sub-zero territory in early October, which is typically a short-term bearish technical signal.
However, both the 12-day EMA (the black line) and the 26-day EMA (the gold line) are still above that zero-bound, which implies a short- to medium-term bullish condition. Still, the 12-day line has crossed below the 26-day line. That's usually a bearish signal.
(Moomoo Technologies Inc. Markets Commentator Stephen "Sarge" Guilfoyle was long TSLA and F at the time of writing this column.)
This article discusses technical analysis, other approaches, including fundamental analysis, may offer very different views. The examples provided are for illustrative purposes only and are not intended to be reflective of the results you can expect to achieve. Specific security charts used are for illustrative purposes only and are not a recommendation, offer to sell, or a solicitation of an offer to buy any security. Past investment performance does not indicate or guarantee future success. Returns will vary, and all investments carry risks, including loss of principal. This content is also not a research report and is not intended to serve as the basis for any investment decision. The information contained in this article does not purport to be a complete description of the securities, markets, or developments referred to in this material. Moomoo and its affiliates make no representation or warranty as to the article's adequacy, completeness, accuracy or timeliness for any particular purpose of the above content. Furthermore, there is no guarantee that any statements, estimates, price targets, opinions or forecasts provided herein will prove to be correct.
Options trading is risky and not appropriate for everyone. Read the Options Disclosure Document ( j.moomoo.com ) before trading. Options are complex and you may quickly lose the entire investment. Supporting docs for any claims will be furnished upon request.
Options trading subject to eligibility requirements. Strategies available will depend on options level approved.
Maximum potential loss and profit for options are calculated based on the single leg or an entire multi-leg trade remaining intact until expiration with no option contracts being exercised or assigned. These figures do not account for a portion of a multi-leg strategy being changed or removed or the trader assuming a short or long position in the underlying stock at or before expiration. Therefore, it is possible to lose more than the theoretical max loss of a strategy.
Moomoo is a financial information and trading app offered by Moomoo Technologies Inc. In the U.S., investment products and services on Moomoo are offered by Moomoo Financial Inc., Member FINRA/SIPC.
TradingView is an independent third party not affiliated with Moomoo Financial Inc., Moomoo Technologies Inc., or its affiliates. Moomoo Financial Inc. and its affiliates do not endorse, represent or warrant the completeness and accuracy of the data and information available on the TradingView platform and are not responsible for any services provided by the third-party platform.
Tesla Momentum Builds Post-EV Sales Surge: Why $500 is in Sight
Current Price: $439.31
Direction: LONG
Targets:
- T1 = $465.00
- T2 = $500.00
Stop Levels:
- S1 = $425.00
- S2 = $410.00
**Wisdom of Professional Traders:**
This analysis synthesizes insights from thousands of professional traders and market experts, leveraging collective intelligence to identify high-probability trade setups. Tesla’s stock continues to draw significant interest as traders align around the increasing demand for its electric vehicles and growing revenues from complementary businesses such as energy storage solutions, vehicle software offerings, and charging networks. Professional sentiment suggests that Tesla’s leadership in autonomous driving and robust infrastructure investments may drive further upside.
**Key Insights:**
Tesla’s strong positioning in the EV market has seen ongoing demand even in 2025 despite the tightening macroeconomic environment. Analyzing recent trading patterns, Tesla’s robust revenue growth across Q3 showcases resilience, supported by increased adoption of advanced batteries like the new-generation 4680 cells. The CEO’s remarks about scaling manufacturing facilities globally—especially the Gigafactory expansion in Mexico—carry forward the vision of doubling production capacity, stimulating long-term growth prospects. Tesla’s diversified revenue streams, including solar and energy storage products, provide an additional financial buffer as they tap into global sustainability trends.
The recent rally in the stock price further underscores positive investor sentiment, with large institutional inflows reflecting faith in Tesla’s brand and technological advantage. Additionally, the sustained consumer demand for higher-margin vehicles such as the Model X and S continues to buoy the stock’s fundamentals.
**Recent Performance:**
Tesla’s stock surged by approximately 6% over the past two weeks, recovering from previous volatility tied to concerns over EV pricing pressure. As of October 2025, Tesla’s improved gross margins—highlighted in the Q3 earnings call—provide relief and optimism, with the stock stabilizing above $430. High trading volume has reaffirmed consolidation zones, indicating strong levels of support near $420 while opening room for upside potential heading into the next fiscal quarter.
**Expert Analysis:**
Market analysts are bullish on Tesla following its strong Q3 beat on earnings-per-share estimates, confirming its profitability is intact despite pricing challenges and increased competition. Tesla’s use of AI in its Full Self-Driving (FSD) beta saw meaningful adoption rates recently, further increasing its moat against rival automakers. Additionally, Tesla’s financial prudence ensures that it remains one of the few tech-centric automakers able to consistently operate without dilutive equity raises.
Technicals reveal Tesla has formed a solid base above its 200-day moving average with an RSI currently neutral but trending bullish—signaling momentum for a further breakout. Resistance zones at $450 have been tested and surpassed, with the next confluence zone near $465 aligning estimates for an extended move higher.
**News Impact:**
Tesla’s announcement of upcoming fleet expansion and partnerships with global logistics firms significantly reinforce its scaling potential while easing investor worries about profitability. Furthermore, Tesla's transparency in discussing supply chain improvements during the Q3 earnings call lends credibility to its operational growth outlook. These factors, paired with advancements in autonomous driving technology, could bolster Tesla’s revenue potential in 2025 and further validate its premium valuation.
**Trading Recommendation:**
Based on technical analysis, recent financial performance, and strong fundamentals, Tesla presents a compelling LONG opportunity with targets set at $465 and $500, supported by growing market dominance and consistent operational excellence. Investors should watch for confirmation of support levels at $425 to manage risk effectively. With institutional confidence high, traders are well-positioned to benefit from Tesla’s growth trajectory as the company continues its strong performance in the EV market and sustainable energy sectors.
Do you want to save hours every week? Register for the free weekly update in your language!

TSLA 4hr Chart- Bullish Setup in Motion Ahead of Earnings Tesla (TSLA) is showing real strength heading into earnings week, closing Friday around $439.31 (+2.46%) with solid momentum. On the 4-hour chart, we’ve been trading inside a descending channel, and that’s important because while it may look bearish at first, this type of channel often leads to bullish breakouts once volume and structure align.
Right now, price is testing the upper side of that channel with a clean bounce from the recent demand zone and reclaiming both the 10 and 20 EMAs. That’s a strong technical sign heading into Monday.
Technical Breakdown
Pattern: Descending Channel (Bullish Continuation Potential)
Trend: Uptrend Confirmed
Momentum: Strong Buy (MAs showing 93.33%)
Oscillators: Leaning Bullish (27.27% Buy Bias)
Entry Zone: Around $435 – $438 (breakout retest area)
Stop Loss: Near $428 (below 61.8% Fib retracement)
Targets:
TP1 → $444.76
TP2 → $454.15
Extended Target → $469.95 (premium supply zone)
Resistance to Watch:
$443.52 – prior swing high
$454.15 – Fib confluence
$469.95 – premium zone and potential top block
Support Levels:
$428 – key breakout retest
$414 – lower boundary of the channel
$401 – major structure support
Heading Into Monday
Bulls are clearly back in control. The chart shows a steady reclaim of momentum with higher lows forming and volume starting to pick up. If price holds above $435, we could see continuation toward $444 – $454 early in the week. A breakout above $443.52 with strong volume would confirm that shift in momentum toward the next leg up.
If we see a short-term dip, I’ll be watching $428 – $414 as the key demand zone where buyers might reload before earnings.
Final Thoughts
Don’t sleep on descending channels — they often set up the biggest bullish reversals once the breakout happens. TSLA is sitting in that pocket right now, with multiple indicators flashing Strong Buy across timeframes. As long as $435 holds, this setup continues to favor the bulls into earnings.
Bias: Bullish
Timeframe: 4H leading into Monday
Expect some volatility, but the trend remains intact and momentum looks healthy.
📘 This is for educational purposes only and not financial advice. Always do your own research before making any trade decisions.

$TSLA: bullishNASDAQ:TSLA we were/are in a Wave-4 correction. If NASDAQ:TSLA drops after ER, it'd be a buying opportunity.
Wave 5 will take NASDAQ:TSLA to/near all time high.
I already have NASDAQ:TSLA shares. I plan to harness the high time premium by buy covered stocks at $440 strike, equivalent to $422.50, with upside limited to $17.50 per share.

$TSLANASDAQ:TSLA earnings this week ⚡️
I passed through Tesla Texas and noticed their construction speeding up.
The average price of a new vehicle just topped $50K (Cox Automotive – Kelley Blue Book).
This could accelerate demand for affordable EVs and ease pressure on auto consumers.
Based on my observation, Tesla has strong momentum right now. 🚗