Sharda Cropchem - Breakout from Long-Term DowntrendNSE:SHARDACROP
📈Pattern & Setup:
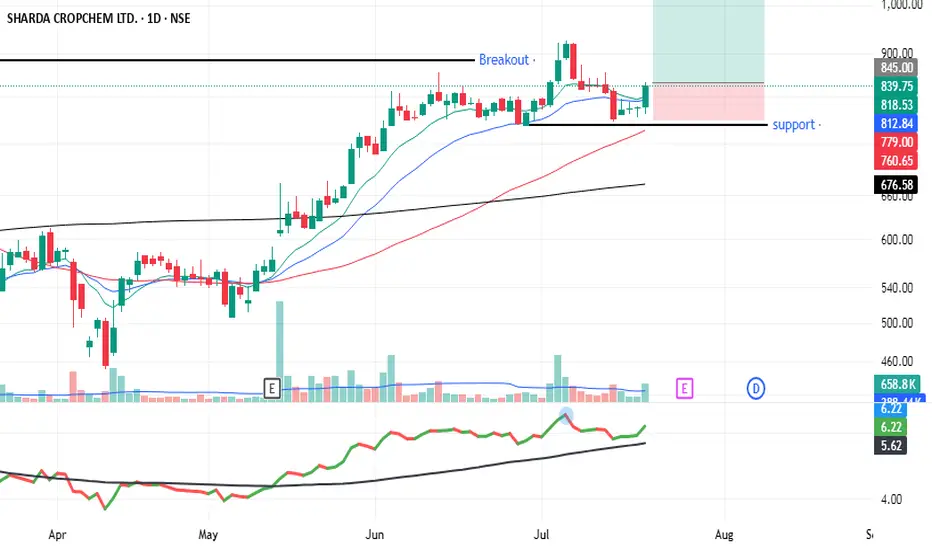
Sharda Cropchem is breaking out of a long-term descending trendline with confirmation from rising volume and a shakeout candle that signals smart money accumulation.
The stock recently showed a false breakdown near ₹880 (R1 zone), but quickly reclaimed it with a
Sharda Cropchem Ltd.
No trades
Next report date
—
Report period
—
EPS estimate
—
Revenue estimate
—
62.70 INR
3.04 B INR
43.17 B INR
22.72 M
About Sharda Cropchem Ltd.
Sector
Industry
CEO
Ramprakash Vilasrai Bubna
Website
Headquarters
Mumbai
Founded
2004
IPO date
Sep 23, 2014
Identifiers
2
ISIN INE221J01015
Sharda Cropchem Ltd. is a holding company, which engages in the marketing and distribution of formulations and generic active ingredients. It operates through the Agrochemicals and Belts segments. The Agrochemicals segment trades agrochemical products including insecticides, herbicides, fungicides, and biocides. The Belts segment is involved in trading of products such as conveyor belts and rubber belts/sheets. The company was founded by Ramprakash Vilasrai Bubna, Sharda Ramprakash Bubna, Ashish Ramamurthy Bubna, and Manish Ramprakash Bubna on March 12, 2004 and is headquartered in Mumbai, India.
Related stocks

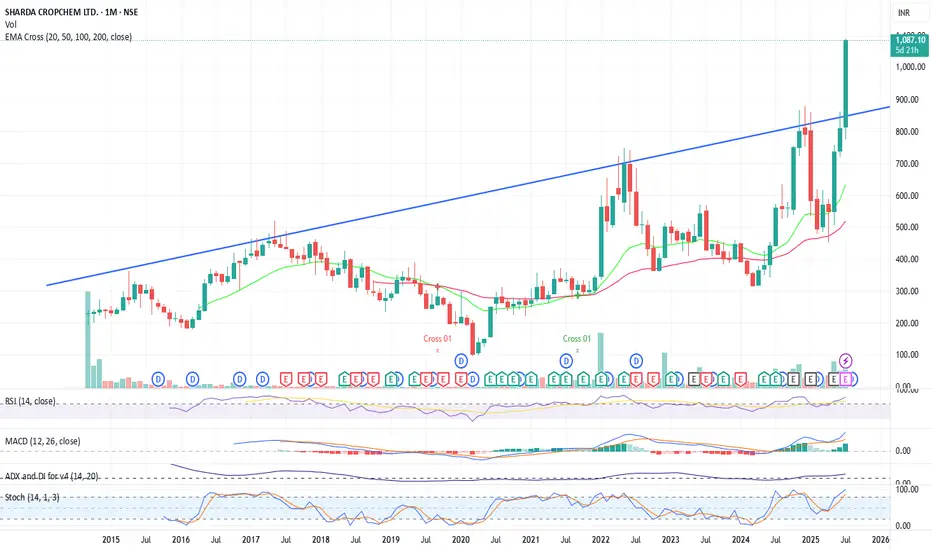
Ye Chart Kuch Kehta Hai - Sharda CorpchemIf you have been going through my post so far, you will understand this chart easily.
This is no brainer chart - one line explains a lot and that too on monthly chart.... Give your thoughts / comments, what do you think and how you interpret.
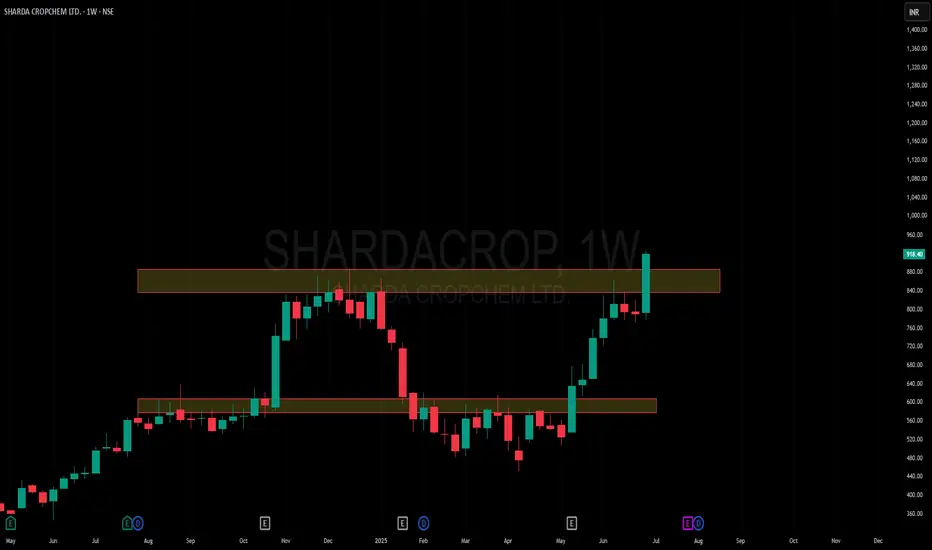
Charts Speak #Sharada Cropchem
Sharada Cropchem
Charts always lead the News! This is yet another example where price was leading & News came later.
Stock was under accumulation since June with higher qty. In fact since May 25, it was getting bought in average 2-3M qty weekly. What a planned buying..
28th May, 4 June, 18th July
Sharda Cropchem - My trade Idea - No AdviceSharda Cropchem seems to be a BUY candidate. The stock's technicals suggest a strong buy signal, while the fundamental analysis indicates a stable financial performance and a decent valuation. The stock has a strong buy rating based on moving averages and RS line, with both short-term and long-term
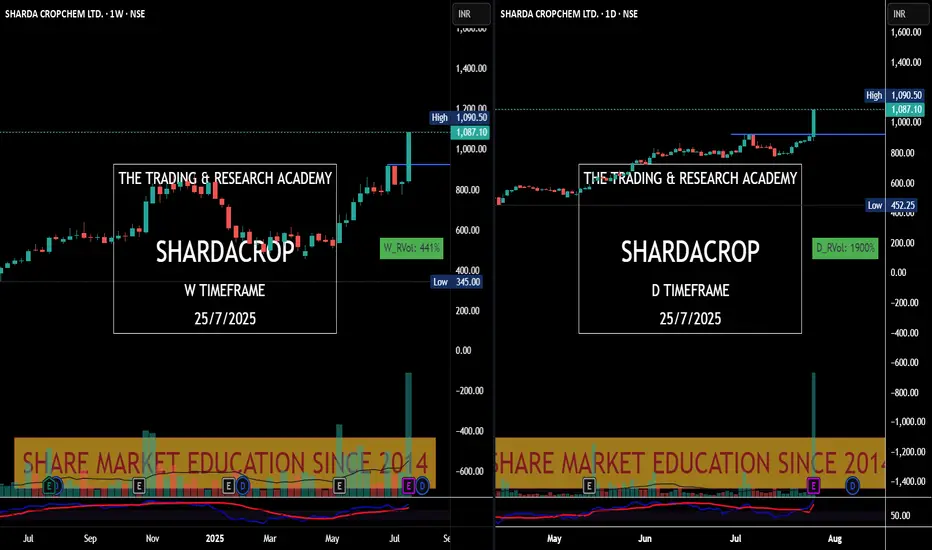
Amazing breakout on WEEKLY Timeframe - SHARDACROPCheckout an amazing breakout happened in the stock in Weekly timeframe, macroscopically seen in Daily timeframe. Having a great favor that the stock might be bullish expecting a staggering returns of minimum 25% TGT. IMPORTANT BREAKOUT LEVELS ARE ALWAYS RESPECTED!
NOTE for learners: Place the break
Sharda Cropchem LtdPrice is holding above key support at , forming higher lows and showing strong buying pressure.
A breakout above could confirm upward continuation.
Not financial advice – just sharing my view. 🚀

50 SMA Rising- Positional TradeDisclaimer: I am not a Sebi registered adviser.
This Idea is publish purely for educational purpose only before investing in any stocks please take advise from your financial adviser.
Its 50 SMA Rising Strategy. Suitable for Positional Trading Initial Stop loss lowest of last 2 candles and keep tra

SHARDACROP - Triangle formation on DailySHARDA CROPCHEM LTD on the Daily basis is forming a triangle.
Looking at the volume past few weeks, it looks like break out is inevitable to me.
Plan:
With a Stop loss of below 780 on Daily closing basis, expecting targets 870, 900 and 950. Will revisit once those targets are hit.

SHARDACROP CMP 650.From a long time Chemical sector is consolidating now many chemical stocks are trying for breakout. Sharda Cropchem also from this sector. This stock trading at its 52 week high levels and near its all time high level.Currently at all SMA. On monthly candles volumes are gaining. Stock sign a potenti

Sharda Corp Chemicals Ltd view for Intraday 17th October #SHARDASharda Corp Chemicals Ltd view for Intraday 17th October #SHARDACROP
Resistance 610. Watching above 611 for upside movement...
Support area 602-600. Below ignoring upside momentum for intraday
Support 600..Watching below 599 for downside movement...
Resistance area 610....
Above ignoring downside

See all ideas
Summarizing what the indicators are suggesting.
Neutral
SellBuy
Strong sellStrong buy
Strong sellSellNeutralBuyStrong buy
Neutral
SellBuy
Strong sellStrong buy
Strong sellSellNeutralBuyStrong buy
Neutral
SellBuy
Strong sellStrong buy
Strong sellSellNeutralBuyStrong buy
An aggregate view of professional's ratings.
Neutral
SellBuy
Strong sellStrong buy
Strong sellSellNeutralBuyStrong buy
Neutral
SellBuy
Strong sellStrong buy
Strong sellSellNeutralBuyStrong buy
Neutral
SellBuy
Strong sellStrong buy
Strong sellSellNeutralBuyStrong buy
Displays a symbol's price movements over previous years to identify recurring trends.
Frequently Asked Questions
The current price of SHARDACROP is 1,252.60 INR — it has increased by 10.27% in the past 24 hours. Watch Sharda Cropchem Ltd. stock price performance more closely on the chart.
Depending on the exchange, the stock ticker may vary. For instance, on NSE exchange Sharda Cropchem Ltd. stocks are traded under the ticker SHARDACROP.
SHARDACROP stock has risen by 10.06% compared to the previous week, the month change is a 55.60% rise, over the last year Sharda Cropchem Ltd. has showed a 119.75% increase.
We've gathered analysts' opinions on Sharda Cropchem Ltd. future price: according to them, SHARDACROP price has a max estimate of 1,405.00 INR and a min estimate of 1,077.00 INR. Watch SHARDACROP chart and read a more detailed Sharda Cropchem Ltd. stock forecast: see what analysts think of Sharda Cropchem Ltd. and suggest that you do with its stocks.
SHARDACROP reached its all-time high on Feb 6, 2026 with the price of 1,208.00 INR, and its all-time low was 99.40 INR and was reached on Mar 23, 2020. View more price dynamics on SHARDACROP chart.
See other stocks reaching their highest and lowest prices.
See other stocks reaching their highest and lowest prices.
SHARDACROP stock is 11.32% volatile and has beta coefficient of 2.37. Track Sharda Cropchem Ltd. stock price on the chart and check out the list of the most volatile stocks — is Sharda Cropchem Ltd. there?
Today Sharda Cropchem Ltd. has the market capitalization of 103.27 B, it has increased by 8.17% over the last week.
Yes, you can track Sharda Cropchem Ltd. financials in yearly and quarterly reports right on TradingView.
Sharda Cropchem Ltd. is going to release the next earnings report on May 8, 2026. Keep track of upcoming events with our Earnings Calendar.
SHARDACROP net income for the last quarter is 1.45 B INR, while the quarter before that showed 743.14 M INR of net income which accounts for 95.28% change. Track more Sharda Cropchem Ltd. financial stats to get the full picture.
Sharda Cropchem Ltd. dividend yield was 1.58% in 2024, and payout ratio reached 26.68%. The year before the numbers were 0.93% and 84.89% correspondingly. See high-dividend stocks and find more opportunities for your portfolio.
As of Feb 13, 2026, the company has 197 employees. See our rating of the largest employees — is Sharda Cropchem Ltd. on this list?
EBITDA measures a company's operating performance, its growth signifies an improvement in the efficiency of a company. Sharda Cropchem Ltd. EBITDA is 8.29 B INR, and current EBITDA margin is 16.36%. See more stats in Sharda Cropchem Ltd. financial statements.
Like other stocks, SHARDACROP shares are traded on stock exchanges, e.g. Nasdaq, Nyse, Euronext, and the easiest way to buy them is through an online stock broker. To do this, you need to open an account and follow a broker's procedures, then start trading. You can trade Sharda Cropchem Ltd. stock right from TradingView charts — choose your broker and connect to your account.
Investing in stocks requires a comprehensive research: you should carefully study all the available data, e.g. company's financials, related news, and its technical analysis. So Sharda Cropchem Ltd. technincal analysis shows the strong buy rating today, and its 1 week rating is strong buy. Since market conditions are prone to changes, it's worth looking a bit further into the future — according to the 1 month rating Sharda Cropchem Ltd. stock shows the strong buy signal. See more of Sharda Cropchem Ltd. technicals for a more comprehensive analysis.
If you're still not sure, try looking for inspiration in our curated watchlists.
If you're still not sure, try looking for inspiration in our curated watchlists.