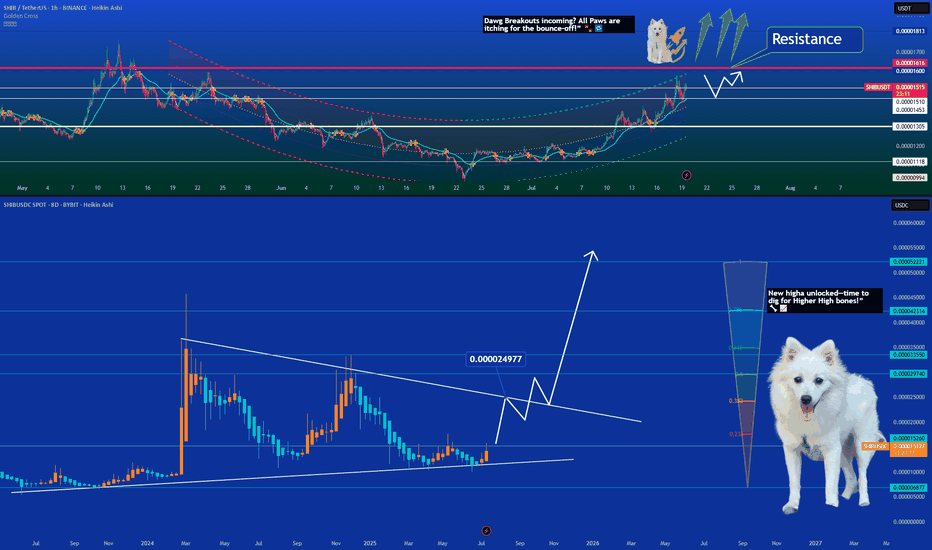
SHIB — Starting a Bullish Climb?📈 SHIB Breaks Downtrend — Starting a Bullish Climb 🔥🐾
Shiba Inu just pierced its descending resistance line on the 8‑day chart—signaling a trend reversal🔥
On the 1‑hour chart:
SHIB has climbed above a key resistance zone (~0.00001510–0.00001550 USDT)
Now forming a potential retest → bounce set
Related pairs
Summarizing what the indicators are suggesting.
Oscillators
Neutral
SellBuy
Strong sellStrong buy
Strong sellSellNeutralBuyStrong buy
Oscillators
Neutral
SellBuy
Strong sellStrong buy
Strong sellSellNeutralBuyStrong buy
Summary
Neutral
SellBuy
Strong sellStrong buy
Strong sellSellNeutralBuyStrong buy
Summary
Neutral
SellBuy
Strong sellStrong buy
Strong sellSellNeutralBuyStrong buy
Summary
Neutral
SellBuy
Strong sellStrong buy
Strong sellSellNeutralBuyStrong buy
Moving Averages
Neutral
SellBuy
Strong sellStrong buy
Strong sellSellNeutralBuyStrong buy
Moving Averages
Neutral
SellBuy
Strong sellStrong buy
Strong sellSellNeutralBuyStrong buy
Displays a symbol's price movements over previous years to identify recurring trends.

