SHIBUSDT trade ideas
Shiba Inu Trades at Bottom Prices, Can't Go Much LowerShiba Inu (SHIBUSDT) is already trading at bottom prices, this is good news because it means that it can't go much lower. We also know from the bottom we grow.
For example, look back to May 2022 - February 2024. SHIBUSDT was sideways and trading at bottom prices, what happened? This bottom consolidation period led to a strong bullish breakout. Expect the same.
Now in Feb. - August 2025 we have the same market conditions but within a higher low. The same. As SHIBUSDT consolidates at bottom prices, what follows is a wave of growth.
Notice how five weeks of bearish action produced only a tiny 22% retrace. This is quite stable for a Cryptocurrency since this is a very volatile market.
The next positive signal comes from marketwide action. Cardano had a similar chart but started to move forward. Chainlink had the exact same chart but is already moving ahead. The same with many others. That is, the action for SHIBUSDT is happening weekly below EMA55/89 but with the mentioned higher low and consolidation phase. Since the market is one and interconnected, we know Shiba Inu will do the same. Dogecoin is also trading at bottom prices, relatively low. We are only weeks away from a massive bullish run.
Patience is key.
Thanks a lot for your continued support.
Namaste.

Time is running out.Tik tak...
Time is running out.
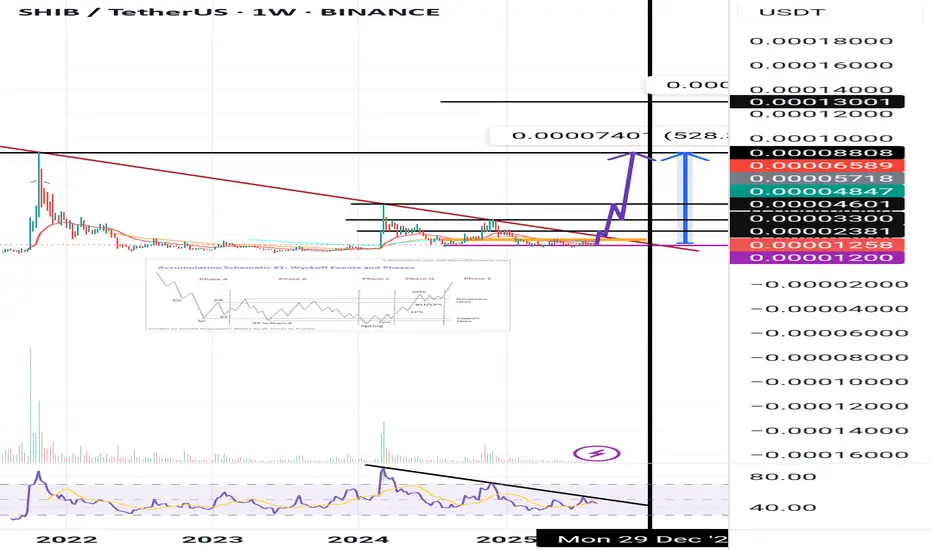
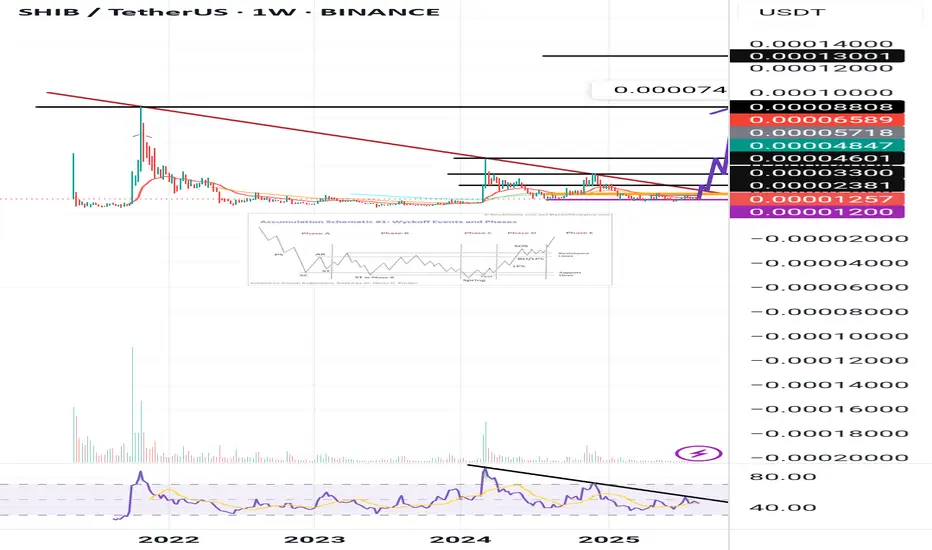
Shiba has formed an annual triangle pattern that is close to breaking out and exploding in price on the higher timeframe (weekly).
Time is running out.Tik tak...
Time is running out.
Shiba has formed an annual triangle pattern that is close to breaking out and exploding in price on the higher timeframe (weekly).
SHIB Buyers Step In as CMF Climbs Despite Price DropThe Chaikin Money Flow (CMF) for SHIB has been climbing steadily, even as price action has declined. This bullish divergence suggests accumulation at lower levels, highlighting a potential shift in momentum.
At press time, the CMF stands at 0.04, indicating that buying pressure is outweighing selling pressure. This reflects renewed inflows of capital into SHIB, despite its recent price weakness.
A rising CMF during a price drop often points to quiet accumulation by traders. This underlying strength signals that SHIB may be preparing for a rebound once market sentiment aligns with the inflows.

SHIBUSDT (Daily)🔎 Chart Context
• Pair: SHIB/USDT
• Exchange: MEXC
• Timeframe: 1D (Daily)
• Date: 21 August 2025
This chart shows SHIB trading within a large consolidation range after a significant bearish move earlier in 2025.
📊 Key Observations
1. Macro Structure
• SHIB has been in a sideways range between 0.00001000 (support) and 0.00001597 (resistance) since March 2025.
• The chart highlights this rectangular range, showing repeated liquidity sweeps on both sides.
• Current price: ~0.00001283, sitting in the lower half of the range.
2. Support Zones
• 0.00001160 – 0.00001080 zone: Main demand block, tested multiple times (April, July).
• 0.00001004 – 0.00001028: Deeper liquidity sweep levels; losing this zone risks breakdown.
• These zones are critical for SHIB’s bullish survival.
3. Resistance Zones
• 0.00001362 – 0.00001597 zone: Upper supply boundary of the consolidation.
• 0.00001765 (FVG): Marked upside liquidity gap; a breakout from range would likely target this.
• Beyond that, 0.00001853 – 0.00002000 is the next strong supply zone.
4. Liquidity Behavior
• Below: resting liquidity around 0.00001160 and 0.00001004.
• Above: liquidity pools at 0.00001597 and 0.00001765, making these the primary bullish targets.
• The chart projects both scenarios:
• Bullish breakout above the range toward 0.00001765.
• Bearish breakdown below 0.00001160 toward 0.00001004 or lower.
📈 Bullish Scenario (Higher Probability if 0.00001160 holds)
• SHIB defends 0.00001160 demand and reclaims 0.00001362 mid-range resistance.
• Momentum carries price to:
• TP1: 0.00001597 (range high)
• TP2: 0.00001765 (FVG fill / liquidity sweep)
• TP3 (extension): 0.00001850 – 0.00002000 major supply zone.
• This requires holding above 0.00001160 and rejecting downside liquidity sweeps.
📉 Bearish Scenario (Lower Probability but Risk)
• Price loses 0.00001160 demand with strong volume.
• Next targets:
• 0.00001080 → 0.00001028 (short-term supports)
• 0.00001004 liquidity sweep (major downside magnet)
• A daily close below 0.00001000 confirms a macro bearish breakdown, exposing 0.00000900 and below.
⚡ Trading Plan
• Long Setup (Preferred if support holds):
• Entry: 0.00001160 – 0.00001230 demand zone.
• TP1: 0.00001362
• TP2: 0.00001597
• TP3: 0.00001765
• Stop: Below 0.00001080 or conservative below 0.00001000.
• Short Setup (Only if breakdown confirmed):
• Entry: Retest of 0.00001160 from below.
• TP: 0.00001004 liquidity sweep.
• Stop: Above 0.00001260.
✅ Conclusion
SHIB/USDT Daily is in a consolidation phase between 0.00001000 – 0.00001597.
The most probable scenario is a range-bound accumulation, with bias turning bullish if 0.00001160 holds and price reclaims 0.00001362, targeting 0.00001597 → 0.00001765.
A breakdown below 0.00001160 shifts focus to 0.00001004 liquidity sweep, which would threaten the bullish structure.

#SHIBUSDT - Aug 2025Date: 17-08-2025
#SHIBUSDT - Current Price: 0.00001314
Pivot Point: 0.00001334
Support: 0.00001244
Resistance: 0.00001426
#SHIBUSDT Upside Targets:
--------------------------------
| Target | Price |
---------------------------------
| 🎯 Target 1 | 0.00001549 |
| 🎯 Target 2 | 0.00001671 |
| 🎯 Target 3 | 0.00001798 |
| 🎯 Target 4 | 0.00001924 |
#SHIBUSDT Downside Targets:
| 🎯 Target 1 | 0.00001121 |
| 🎯 Target 2 | 0.00000997 |
| 🎯 Target 3 | 0.00000871 |
| 🎯 Target 4 | 0.00000745 |
#SOLANA #ETHEREUM #BTCUSD #MATICUSDT #XRPUSDT #SHIBUSDT #PEPEUSDT
#Crypto #Bitcoin #BTC #CryptoTA #TradingView #PivotPoints #SupportResistance

SHIB Faces Selling Pressure Below Super Trend SupportSHIB/USD is currently trading below its Super Trend Indicator on the daily chart, signaling a dominant bearish sentiment. The Super Trend line now forms dynamic support at $0.00001446, acting as a key level to watch for potential price reactions.
The Super Trend Indicator measures both the direction and strength of a trend, switching between green in an uptrend and red in a downtrend.
With SHIB trading beneath this line, the prevailing signal remains bearish, suggesting sellers maintain control in the market.

SHIB: Watch this level!Trading Setup
If you’re considering trading SHIB, here’s a quick setup that may help you.
The idea is: Buy when the price breaks above $0.0000142 and take profits at the levels shown in the chart.
Targets:
1. $0.0000153
2. $0.0000183
3. $0.000021
4. $0.0000235
-------------------------------------------
About our trades:
Our success rate is notably high, with 10 out of 11 posted trade setups achieving at least their first target upon a breakout price breach (The most on TW!). Our TradingView page serves as a testament to this claim, and we invite you to verify it!

SHIB/USDT at a Crucial Crossroad!Shiba Inu is exhibiting a neutral to slightly bullish trend. The price is currently testing the support level around $0.00001350, with resistance near $0.00001400. A breakout above this resistance could signal a continuation of the upward momentum.
*Bullish Scenario: A breakout above $0.00001400 could lead to a rally towards $0.00001500.
*Bearish Scenario: A drop below $0.00001350 may result in a decline towards $0.00001250.

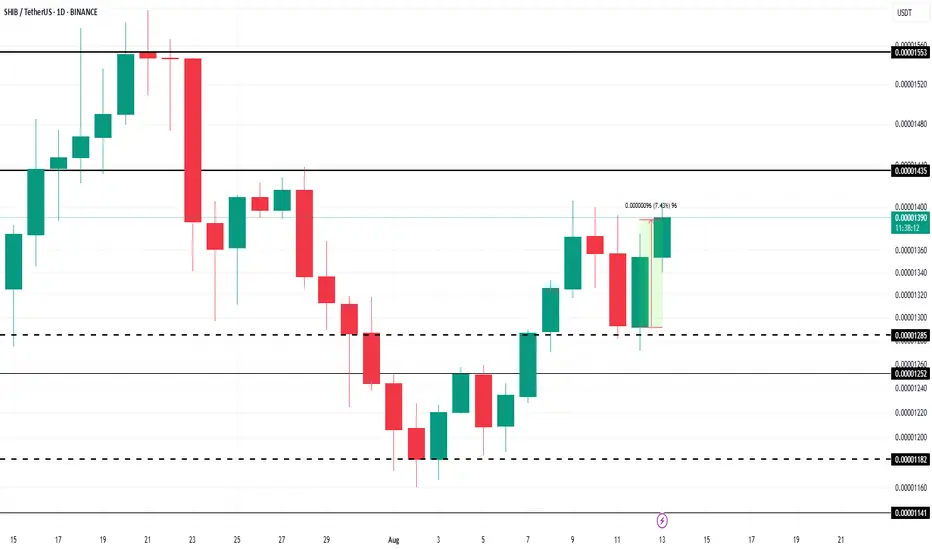
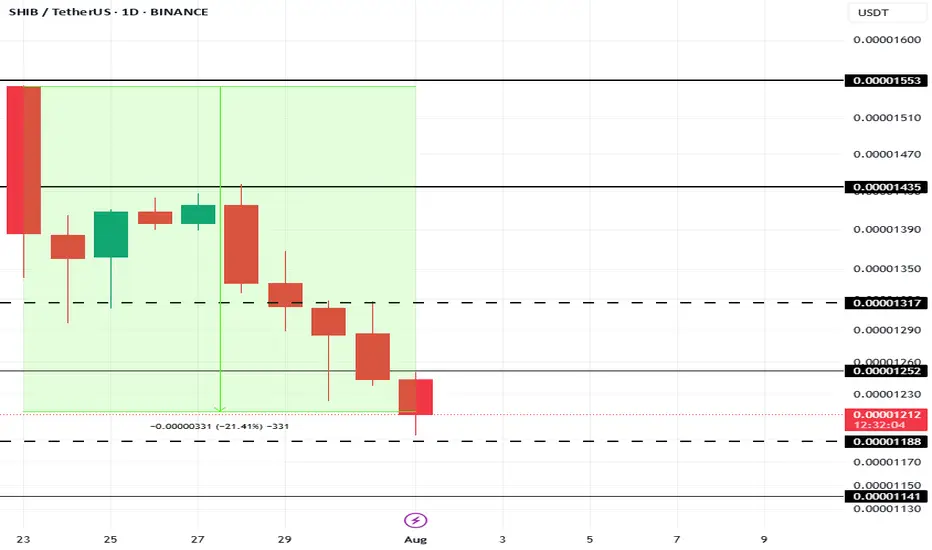
How Are Shiba Inu’s Most Profitable Holders Acting Right Now?At the time of writing, BINANCE:SHIBUSDT is trading at $0.00001366 , holding above the local support of $0.00001285. The altcoin has yet to reach the crucial resistance level of $0.00001435, which marks a significant hurdle for its recovery.
The HODL Cave analysis reveals that BINANCE:SHIBUSDT holders who have held their tokens for 18 to 20 months are currently the most profitable, second only to the all-time low (ATL) buyers. These long-term investors are seeing median profits ranging from 1.54x to 1.57x .
The 2-Year Mean Coin Age indicator, which tracks the movement of tokens over the past two years, is currently showing an uptick. Over the past two months, only one instance of selling has been recorded, highlighting the ongoing resilience of BINANCE:SHIBUSDT long-term holders .
Breaking through $0.00001435 is essential for BINANCE:SHIBUSDT to make its way to $0.00001553. Reaching this level would signal the recovery of July's losses and indicate that SHIB is back on track for further gains. The support from the most profitable holders is likely to play a pivotal role in helping SHIB break through this resistance.
However, if BINANCE:SHIBUSDT faces heavy selling pressure from skeptical holders or retail investors, the price could fall below the support of $0.00001252 . This would likely trigger a decline towards $0.00001182 or lower, invalidating the bullish thesis and signaling further downside for the altcoin.
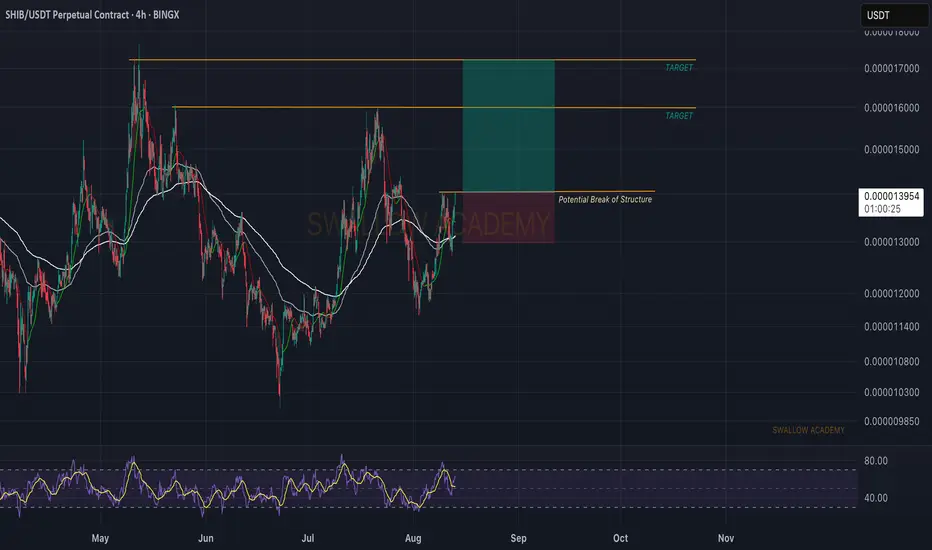
Shiba Inu (SHIB): Looking For Break of Structure | 1:3 RRSHIB looks good; we are about to see a potential Break of Structure (BOS), which would be an ideal buy entry for us as well.
We wait patiently and once we see it, we are going to aim to see at least 20% of the market price movement to upper zones.
Swallow Academy
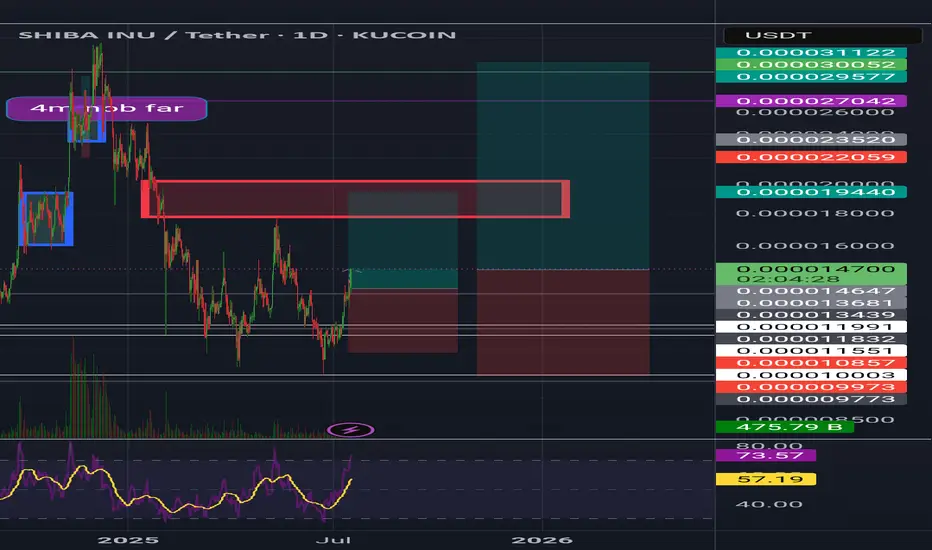
Shiba inuShib usdt Daily analysis
Time frame daily
First target = 0 00001944$
Risk rewards ratio =2 👈👌
Second target = 0.00003
Risk rewards ratio >3.5 👈 👌
The red box that you can see on the screen is very important resistance area.
If Shiba breaks it strongly, second target will be reach
Strong Volume Pushes Shiba Inu Toward 0.000014 Target ZoneHello✌️
Let’s analyze Shiba Inu’s price action both technically and fundamentally 📈.
🔍Fundamental analysis:
Shiba Inu’s first vote to pick an interim president uses one token, one vote giving whales more power. This leader will run a $7B ecosystem, but some worry it lets big holders control too much. ⚖️
📊Technical analysis:
BINANCE:SHIBUSDT has seen solid volume recently and sits near daily support and a key trendline 📉 Holding these levels could lead to a 15%+ rally targeting 0.000014 📈
✨We put love into every post!
Your support inspires us 💛 Drop a comment we’d love to hear from you! Thanks, Mad Whale

Shiba Inu Trades within Opportunity Buy Zone · Last ChanceShiba Inu grew more than 1,600% in October 2021. All this bullish action happened in just one month, under 30 days. These are the strong variations I keep talking about.
» Tezos's previous bull market lasted 714 days.
» Shiba Inu's previous bull market lasted 49 days (coming from the September 2021 low).
Since October 2021 SHIBUSDT has not seen a new bull market. After the all-time high there was a correction leading to the same pre-bull market support zone being activated but no new lows. We can see a long-term double-bottom and this is a signal of strength.
SHIBUSDT consolidated nicely in 2022 and there was a bullish jump in late 2023 leading into Q1 2024. This is the same move that produced big waves across the entire Cryptocurrency market. Here it was a minor event relatively speaking. If we were to compare this jump to bull market action, it is nothing really. The good news is that we are now entering a completely new market phase.
While we have higher lows in 2024 and 2025 compared to 2022 and 2023, the action for SHIBUSDT is still happening within the "opportunity buy zone." The same range used to buy before a major change of trend. This is mostly relevant for whales because they need years in order to create a position.
So Shiba Inu is in a new and strong accumulation zone ready to grow. Long-term higher lows, sideways and marketwide bullish action; the best is yet to come.
We are looking at bottom prices. You are looking at the lowest levels in 2025 before the bull market phase. There is still some time left but SHIBUSDT is ready to move ahead...
Time is running out.
Market conditions are great.
Simple strategy: Buy and hold.
Thank you for reading.
Namaste.

SHIB Breakout Watch – Red Resistance Being Tested!🚨 CRYPTOCAP:SHIB Breakout Watch – Red Resistance Being Tested! 🔴⏳
CRYPTOCAP:SHIB is testing the red resistance zone.
📊 If breakout confirms, next move could target:
🎯 Target → Green line level
A breakout could trigger bullish continuation and upside momentum.

SHIBUSDt long turmA.o.A all
Accroding to VSFA+ Shibusdt after retest completed then last time dump & making new lower low, 0.0000812 if sucsuful test that level after that i update whats coming up next in sha Allah

Let him cook after years of SleepYears of boring range and low profit pump which makes investors and holders sad and upset or even bored but no worries i find out these times are best times for adding some long to my personal wallet on that token lol.
.
so as i mentioned before soon it can start pump and after breaking that red trendline market here would be again exciting once again.
DISCLAIMER: ((trade based on your own decision))
<<press like👍 if you enjoy💚

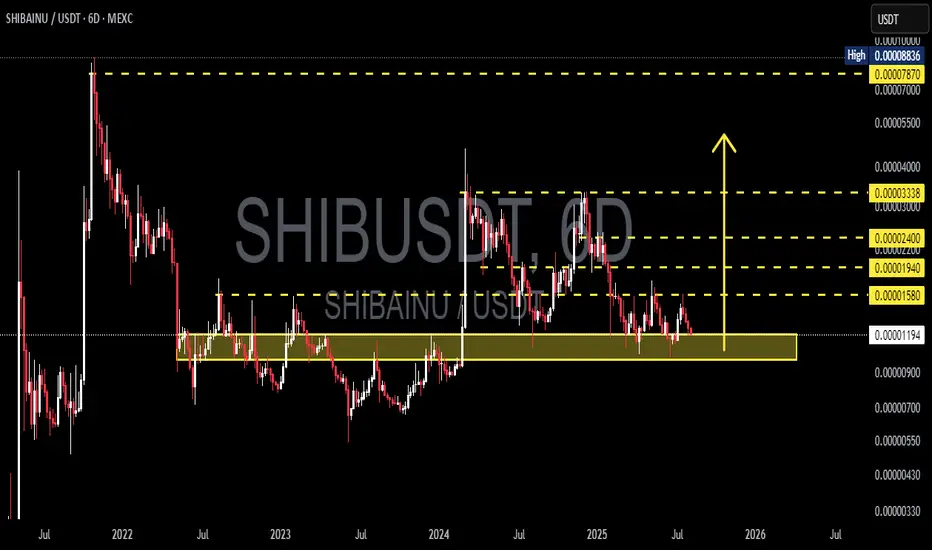
SHIBA/USDT Testing the Make-or-Break Zone — End of Accumulation?🧠 Overview:
SHIBA/USDT is once again testing a critical support zone that has held strong since early 2022. This area isn’t just a technical level — it represents a long-term accumulation zone where buyers have consistently stepped in.
What happens next could define SHIB's mid to long-term trend. Will we see a major bullish reversal, or is a breakdown and deeper correction looming?
---
📊 Technical Breakdown:
Key Demand Zone (Major Support):
🔸 0.00001090 – 0.00001190 USDT
This zone has been tested multiple times over the past two years. It remains the last major stronghold for bulls. A breakdown here could trigger panic selling.
Important Resistance Levels (Bullish Targets):
🔹 0.00001580 → Initial resistance
🔹 0.00001940 → Previous distribution area
🔹 0.00002400 → Strong psychological level
🔹 0.00003338 → Mid-term bullish target
🔹 0.00007870 – 0.00008836 → High timeframe supply zone and potential long-term profit-taking area
Market Structure:
🔸 Price remains inside a long-term horizontal consolidation range
🔸 No clear breakout yet, but early signs of buyer interest are forming
🔸 Possibility of forming a double bottom or accumulation breakout if bullish momentum strengthens
---
📈 Bullish Scenario:
✅ Price holds above 0.00001190 support
✅ Breakout above 0.00001580 = early trend reversal signal
✅ Bullish confirmation with volume increase
✅ Mid-term targets: 0.00001940 → 0.00002400 → 0.00003338
✅ Long-term potential: Retest of 0.00007870 – 0.00008836 (key supply zone)
---
📉 Bearish Scenario:
❌ Breakdown below 0.00001090 = major bearish signal
❌ Potential drop toward lower zones:
▪️ 0.00000900
▪️ 0.00000700
▪️ 0.00000550 (next key support zone)
❌ Price structure shifts to lower lows, indicating trend weakness and potential distribution phase
---
🧩 Pattern Insights:
📌 Market showing signs of Sideways Accumulation for over 1.5 years
📌 Could be a Re-Accumulation Phase before a major breakout
📌 Current movement resembles a Wyckoff-style Spring, which often precedes an upward expansion
---
📌 Conclusion:
SHIB is standing at a major inflection point. If buyers continue to defend this support zone, it could mark the beginning of a new bullish cycle. However, if this level breaks, further downside is highly likely.
This is a moment of calm before potential volatility — stay alert and watch volume + price action closely.
#SHIB #SHIBUSDT #CryptoBreakout #SupportZone #AltcoinAnalysis #SHIBAInu #TechnicalAnalysis #AccumulationPhase #WyckoffMethod #CryptoBullish #CryptoBearish
SHIB Still Faces Pressure Below Parabolic SAR ResistanceSHIB continues to struggle beneath its Parabolic SAR, which has established dynamic resistance above its current price at $0.00001382. This persistent downward positioning below the SAR dots suggests that sellers remain in control, limiting bullish momentum and keeping the asset under pressure in the short term.
The Parabolic SAR indicator tracks potential reversals and trend direction. When the SAR dots appear above the price, it typically signals a bearish trend, while dots below the price suggest bullish momentum.
In SHIB’s case, the indicator’s placement overhead means upward attempts may continue to face resistance unless a strong breakout occurs.
Until SHIB flips this level and closes above the SAR, traders may expect continued consolidation or downward movement.

This Is The Cause Of Shiba Inu Price’s 21% Fall In 10 DaysAt present, BINANCE:SHIBUSDT price is sitting at $0.00001210, down 21% over the last 10 days . The drop in Shiba Inu's price can be traced to a sharp decline in the number of new addresses interacting with the token.
In the last 10 days, the number of new addresses has decreased by nearly 40% . This sudden exit of new investors indicates waning confidence in BINANCE:SHIBUSDT price potential, particularly after an extended rally earlier in the year.
If this trend continues, BINANCE:SHIBUSDT could lose the critical support level of $0.00001188, pushing the price down to $0.00001141 or potentially lower. However, if SHIB manages to hold onto its $0.00001188 support level, there is a possibility of recovery.
A bounce from this level could push BINANCE:SHIBUSDT price up to $0.00001317 . Securing this level as support would create a bullish scenario, invalidating the bearish thesis and offering hope for further price growth in the near future.
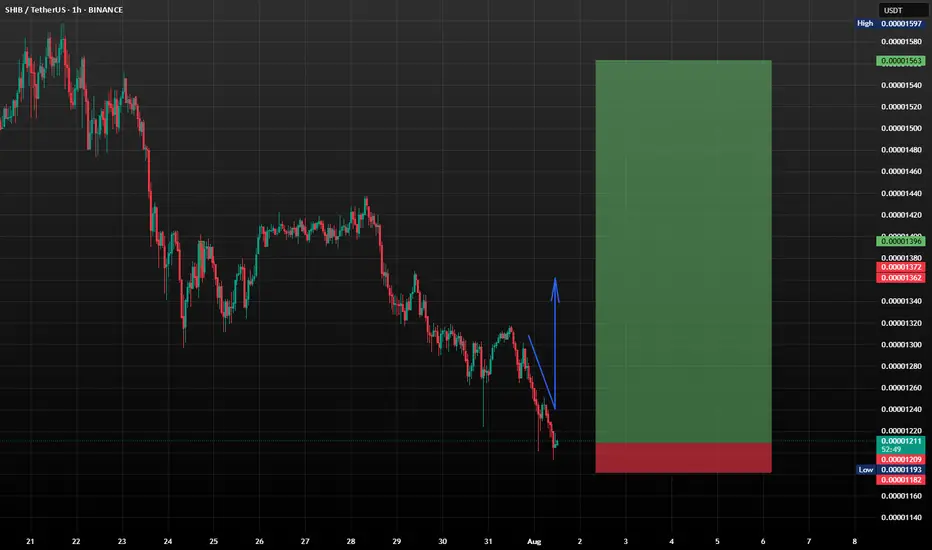
SHIB/USDT: Shiba Inu Setting Up for a Bullish Reversal?Shiba Inu (SHIB) is currently trading around $0.00001208, showing signs of stabilizing near a key support zone after a recent pullback. The market appears to be forming a rounded double bottom pattern, which could evolve into a strong W-shaped bullish reversal if confirmed with volume and breakout above short-term resistance (~$0.0000135).
This level could be pivotal for long-term accumulation.
What to Watch
*Key Support Zone: $0.00001200 - price is holding this level firmly.
*Short-Term Resistance: $0.0000135 - a breakout could confirm bullish continuation.
*Indicators: RSI is cooling off after a high, which could provide momentum for a new leg up.
SHIB may be quietly setting the stage for a powerful recovery. This support level looks like a gift for those with patience and vision. DCA smartly, monitor dips, and don’t panic, because when this pattern breaks out, you’ll wish you had loaded up earlier.
This isn't about hype...it’s about positioning. Stay disciplined. Stick to your plan. SHIB might just surprise everyone again.
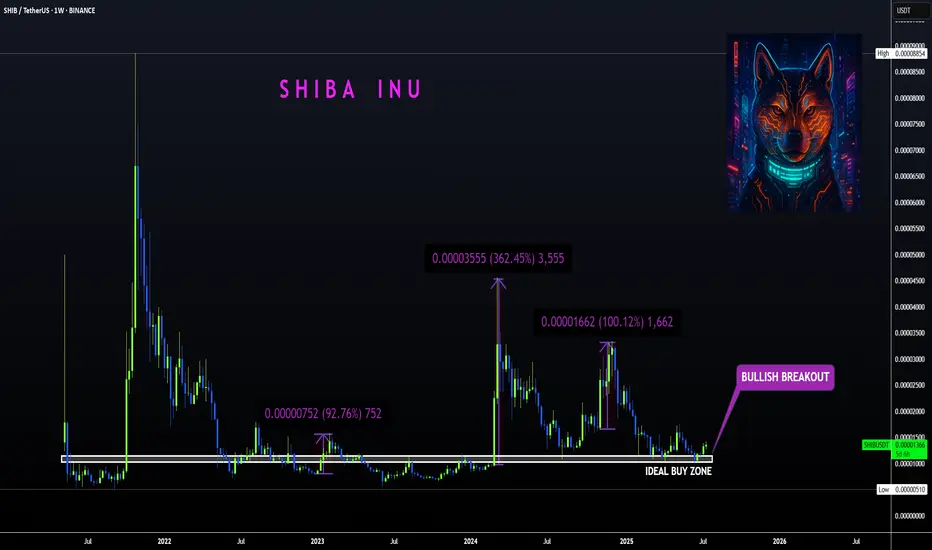
SHIBA | Bullish Breakout ABOVE Ideal Buy ZoneBINANCE:SHIBUSDT
Shiba is know to make big increases in short periods of time... that's why we love it!
The tricky thing about SHIBA is that the pumps can be unpredictable so the best way to ensure a position is to buy as low as possible to the ideal buy zone.
In the weekly timeframe, the technical indicators are not quite bullish yet. The moving averages is still above the price, meaning the bulls have yet to take full control of the price in lower timeframes.
The same can be said for the daily, although we are seeing progress as the 200d moving averages have been reclaimed: