Shib vs Usd Buy level 0.00001030 to 0.00001090 Target 0.00001550Shib vs Usd Buy level
0.00001030 to 0.00001090
Target 0.00001550 to 0.00001590
All Level Clear
SHIBUSDT trade ideas

SHIB/USDT In the crucial area, Could SHIB Breakout or Rejected ?💎 SHIB, a notable player in the market, is currently advancing towards a critical supply area. Recently, SHIB faced a strong rejection at this juncture. For continued upward momentum, SHIB needs to break through this supply area. A confirmed breakout, probability could set the stage for SHIB to progress towards our identified strong resistance area.
💎 However, should SHIB struggle to breach this resistance and instead consolidate at this level over the next few days, it might face another rejection. Such a development could lead SHIB to retreat towards the support level at $0.00092.
💎 The support area at $0.00092 plays a pivotal role in SHIB's trajectory. A robust bounce from this level is necessary for SHIB to attempt another breakout of the supply area. Failure to sustain and rebound from this support could indicate weakening buyer momentum, raising the possibility of losing this support level. If SHIB breaks below this support, it could be directed towards the lower bullish OB area.

Mock Up Price Action for SHIBUSDT | Mid Term (12HR)Mock Up Price Action for BINANCE:SHIBUSDT | Mid Term (12HR)
- Watching and waiting for opportunities
- I've got 'Crazy', 'Crazier', and 'Dafuq' Mapped Out
Personal Approach & Base Chart Setup
- Stacked Parallel Channels for Grid of Confluence Points
- High Time Frame (HTF) Fib Extensions, Retracements, & Time Cycles
- Red Filled Horizontal Rectangles between areas of major Fib level from Extensions and Retracements
- Price Label Callout with Red Circle highlighting points of interest where I'd consider making a trade
- I will consistently monitor and adjust taking into consideration long/mid/near term price action and market conditions/news
- I do this not to predict the price, but rather, to prepare myself and have a plan for all possible scenarios playing out. So that when the time comes, I can make an informed decision with multiple contingencies having monitored the price action over time and in consideration of multiple scenarios (however unlikely they may be) playing out

Bullish Triangle
Bullish Patterns:
Inverse Head and Shoulders: This pattern consists of three lows with the middle low being the deepest. It indicates a reversal from a downtrend to an uptrend.
Double Bottom: Similar to the inverse head and shoulders, it signifies a reversal and is formed by two lows at roughly the same price level.
Inverse Head and Shoulders (Head and Shoulders Bottom):
Formation: This pattern consists of three lows, with the middle low being the deepest (the "head"), and the other two forming higher lows (the "shoulders"). The line connecting the highs of the shoulders is known as the neckline.
Reversal Signal: The Inverse Head and Shoulders pattern is considered a bullish reversal pattern. Once the price breaks above the neckline, it is often interpreted as a signal that the downtrend may be reversing, and an uptrend might be beginning.
Double Bottom:
Formation: The Double Bottom pattern is formed by two lows at approximately the same price level, separated by a peak (the "bottoms"). The line connecting the peaks is the neckline.
Reversal Signal: Similar to the Inverse Head and Shoulders, the Double Bottom is also a bullish reversal pattern. The breakout above the neckline suggests a potential reversal of the preceding downtrend and the start of a new uptrend.
Both patterns are part of technical analysis, which involves studying historical price charts to predict future price movements. Traders often use these patterns, along with other technical indicators, to make informed decisions about buying or selling financial instruments. It's important to note that while these patterns can be useful, they are not foolproof, and traders should consider multiple factors in their analysis.

Shiba flying...Shiba is going to the 0/000022
With the break of its descending channel, it can pump to the 000022 price area Shiba is in the accumulation phase for more than 500 days and it seems that it will explode soon

ShibausdtMarket in FUD
But i think end of 2022 its good for crypeto
14dec last manpuliate fed in market

Shiba pump is comingAfter approximately 800 days of rest, the Shiba pump appears to be underway! It has broken the prevailing downtrend in daytime period, have formed a bullish triangle pattern in 4-hour intervals, indicating readiness for a potential upward movement.

Possible 20+% gains within 7 daysI have been following shib closely. Its has been making higher highs and lows. Shib has been following in this very steep parallel channel. If it continues, we could easily see a 20% or more increase over the next week.

SHIB’s Momentum Begins to Shift , Will It Surge to $0.00001250?A symmetrical triangle has formed on the 4-hour chart for BINANCE:SHIBUSDT . This suggests that the meme coin’s price may break out in the next 24 hours. In the event of a positive breakout, the cryptocurrency may attempt a challenge at the $0.00001055 resistance level. A 4-hour candle close above this significant barrier will then clear a path for SHIB to continue climbing in the following couple of days. Should bulls continue to drive the meme coin’s price, they could elevate it to $0.00001250 in the short term.
On the other, a negative breakout could lead to SHIB falling to the $0.00000925 support level in the following 48 hours. If the sell pressure does not stop at this level, then SHIB could fall to as low as $0.00000847.
Technical indicators suggested that SHIB’s momentum is in the process of shifting in favor of bulls. Both the Moving Average Convergence Divergence (MACD) and the Relative Strength Index (RSI) indicators supported a short–term bullish outlook.
The RSI line on the 4-hour chart was attempting to break above the RSI Simple Moving Average (SMA) line. Should it break above this technical indicator, it may signal that bulls have gained the upper hand against sellers on SHIB’s 4-hour chart. In addition to this, the slope of the MACD line on the 4-hour chart was leveling off. This may be a sign of SHIB’s negative momentum coming to an end.

Probably !!!!!!!!!!!!!!!!!!!!!!!!!!!!1With the failure of the roof of the channel, it can return to the ascending orbit !

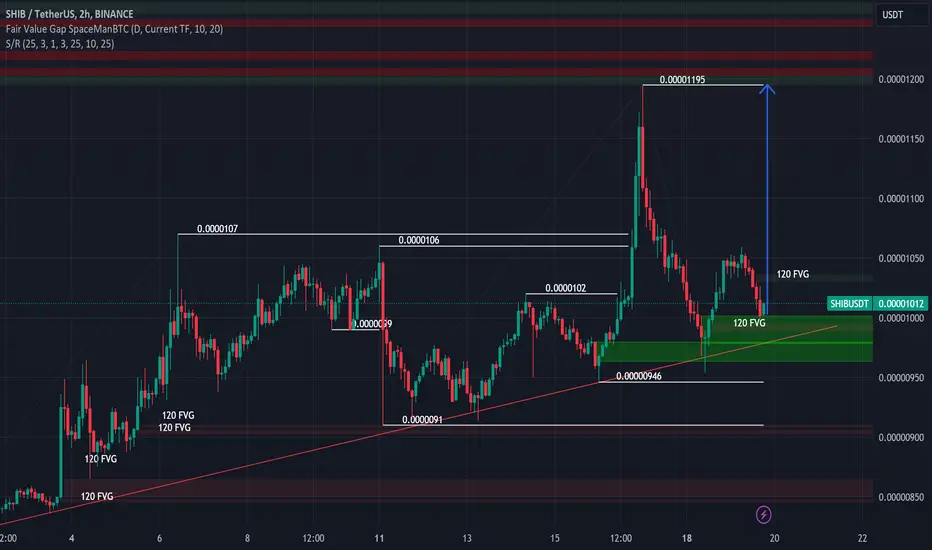
AGAIN BUY SHIBA NOW!!!!!!!!!!SHIBUSDT completed my last analysis predictions now price of shiba just got a bounce from my FVG ZONE am expecting shiba to make its way up to 0.00001195 again above that will remain stable till 0.0000132 is completed
JOIN AND ENJOY
Tell us what you think
Shiba Inu: The Meme Coin That's So Bad It's GoodI'm not going to lie, I'm not sure what Shibusdt is. It sounds like a combination of Shiba Inu and Squid Game, which is already pretty funny. But I'm also not sure if it's a good investment. I mean, it's a meme coin, and those are notoriously volatile. But hey, if you're looking for a laugh and a chance to make some money, then Shibusdt might be the coin for you. Just don't say I didn't warn you.

shibusdtbuy :0.0000087
sl: 0.00000798
tp: 0.0000135
you can buy shib 0.00000872 and this is good area for spot and hold

Shiba Inu... Tecnicall and Market psychologyFortunately, Shiba has not yet broken its upward trend line, although the profits it gave us were took , and some did not sell, but there is no need to worry, please don't be just a seller
.I see Shiba rising until the weekend,, it was a correction of the work of the whales, not a technical analysis. This is where a question arises in the mind that how 22% growth suddenly became a loss in this way, I really don't know, but this is the conspiracy of the whales who can create such a queue with a lot of money. Please don't be a seller, the whales 🐋 note is fixing this situation so that they're can buy at lower prices and sell at higher prices, I hope you will make a great profit by the end of the week.

Shib making higher highs Shib continues to impress me. I know the market looks like a blood bath right now, but I absolutely believe Shib is in a bull cycle. It is making higher highs, and it continues in the ascending wedge. Good time to score some cheapies during this drop IMO!

#SHIB/USDT LONG#SHIB
The price has been moving in a descending triangle pattern since April 2022
In a way that respects the occurrence of the triangle on the frame of 3 D
And empty the downtrend was broken strongly
Moving Average 100 is being broken
Price Now 0.00000893
First Goal 0.00001076
Second Goal 0.0001448
We have oversold on MACD
And a strong upward trend

SHIB ANALYSIS🔮 #SHIB Analysis - Breakout 🚀🚀
💲💲 There is a breakout of falling wedge pattern in #SHIB in weekly time frame. $1150 is a crucial resistance level and if #SHIB holds this level then we will see the price range of $1500 in next target. 🚀🚀
💸Current Price -- $0.00001061
📈Target Price -- $0.00001800
⁉️ What to do?
- We have marked crucial levels in the chart . We can trade according to the chart and make some profits. 🚀💸
🏷Remember, the crypto market is dynamic in nature and changes rapidly, so always use stop loss and take proper knowledge before investments.
#SHIB #Cryptocurrency #Breakout #DYOR

SHIN/USDTI expect shiv to reach this target in the next few weeks to months it’s looking very strong in a reversal pattern.

SHIB breakout SHIB have been in a downward chan el for almost 610 days and once we closed this weekly above the channel it will be very bullish.

Shib W on the 1W time frame! This sure does look good to me! It doesn't get much better than a giant w on the one week time frame....

I expect 15x in Shib.I expect 15x in Shib. Be careful as there may be a hard going up and a hard downhill.
#shib #shiba will come the values

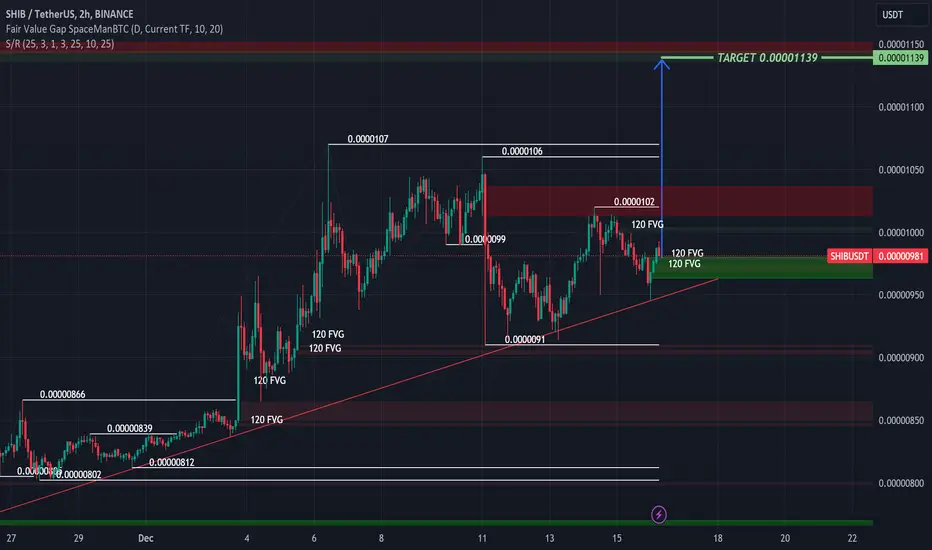
BUY SHIBA NOW!!!!!!!!!Shib just grab the sell-side liquidity tap into my fair value gap am expecting the price of shib to a new high this time to 0.00001139
Above 0.00001139 will maintain stability up to 0.0000142
JOIN AND ENJOY!!!!!!!!
Time for more actionThat is a best and intellegant time for shib to show their trend line for growing up , too cool it stay at this price !!!!
