SHIBA INU: Don't Miss This TradeSHIBA INU: Don't Miss This Trade
Currently, SHIBA INU is in a Long-Term Accumulation Before Next Move
SHIBA INU is approaching a major historical support zone around 0.0000067, a level that has triggered strong bullish reactions in the past.
Price has been consolidating for months, suggesting ac
Related pairs

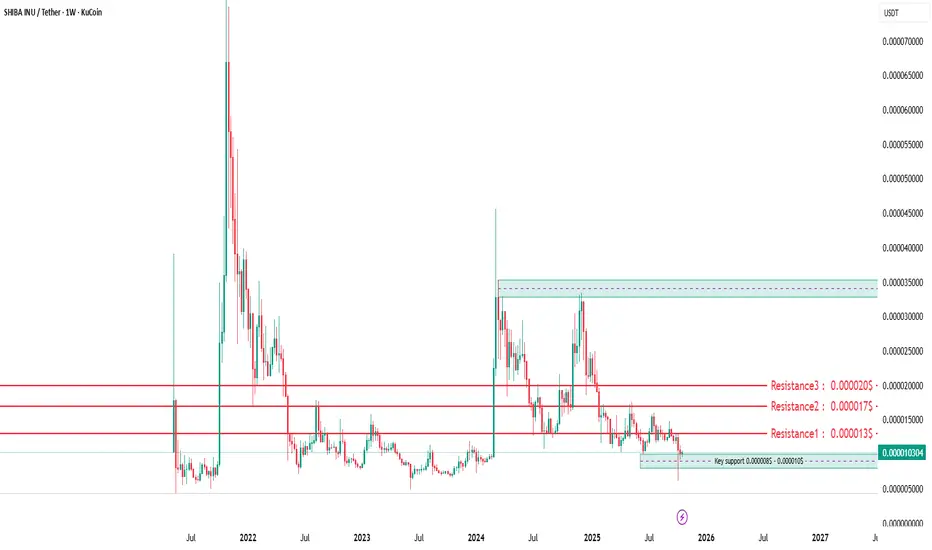
support and resistance levels in shibusdtYou can see the chart of this currency on the weekly time frame. The support and resistance levels are clear

SHIBUSDT strong support zone can pump it hard soonObservation: Correct. While a significant portion of the market, particularly older tokens, has experienced substantial rallies, SHIBUSDT has notably underperformed.
Current State: The asset is currently dead and trading within a tight consolidation range, showing a distinct lack of momentum.

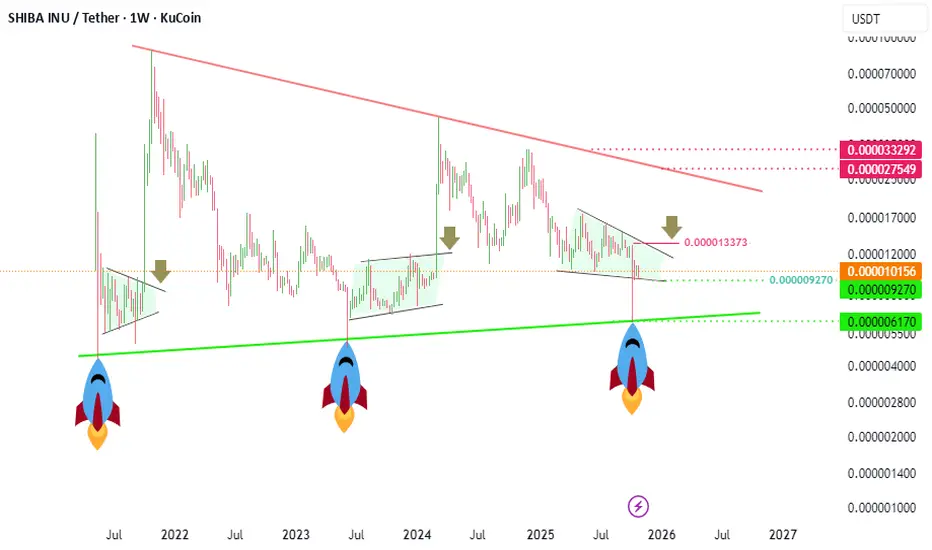
#SHIBUSDT ( pump ? )Whenever it hits the green support line,
it becomes a rocket.
Before it becomes a rocket,
it also formed a green compression pattern and
reached the ceiling by breaking out of the ceiling of the pattern.
SHIB the dead coin soon again will pump hardSHIB has been undergoing a prolonged period of consolidation, characterized by low volatility and a notable absence of significant bullish momentum over recent months. Such phases of compression and quiet price action often occur after a prior trending period and typically precede a new directional

SHIBUSDT
Volume is rising and has reached oversold levels. It’s time for a rebound based on the current data.
"The expected movement in the upcoming period is shown on the chart"
Do you agree with my view ?

Shiba Inu (SHIB/USDT) Technical Overview (Weekly Timeframe)Shiba Inu is still in a long-term accumulation phase, moving sideways after its huge 2021 spike. The price has been consolidating between 0.000006 and 0.000018 for almost two years.
Key Observations:
Major Support Zone: 0.000008–0.000009 — this is the area where long-term buyers usually step in.
Lingrid | SHIBUSDT Sideways Break Lower ExpectedBINANCE:SHIBUSDT is trading below the confluence of the descending trendline and the former support, following a clear rejection and sell-off from the 0.0000148–0.0000136 resistance band. Structurally, price remains in a downward channel with a sequence of lower highs/lows after failing out of a sh

SHIBUSDT this dead and sleep coin always move lateThe asset has been consolidating within a well-defined, prolonged trading range for an extended period, exhibiting low volatility and diminished trading volume. While this can test a trader's patience, such periods of compression are often the precursor to a significant directional move, as energy a

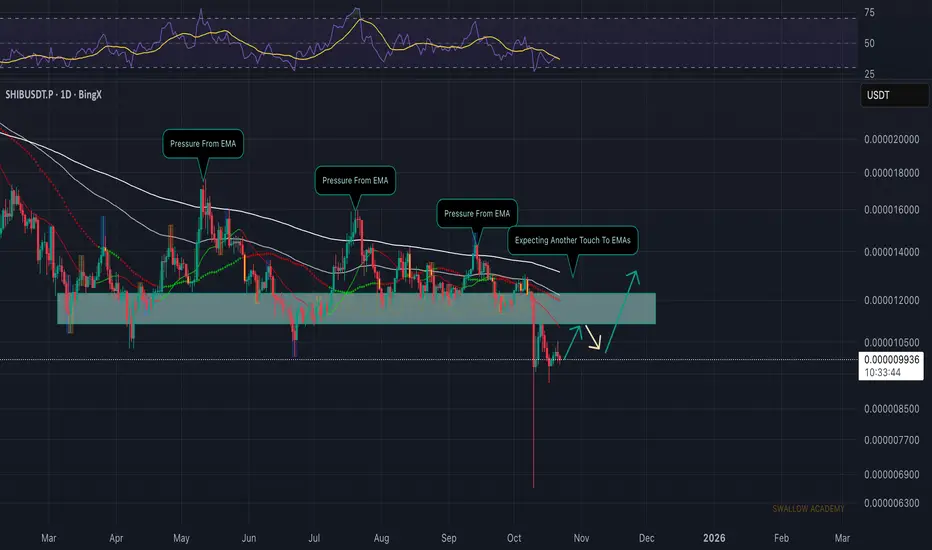
Shiba Inu (SHIB): Expecting Bounce Towards The EMAsAfter that sharp dip, SHIB has now created a visible gap that would be an ideal area to get filled. We’re sitting right at a strong demand zone, so a bounce from here looks likely.
The expectation remains for price to push back up for a re-test of EMAs — that would both fill the unfilled gap and gi
See all ideas
Summarizing what the indicators are suggesting.
Oscillators
Neutral
SellBuy
Strong sellStrong buy
Strong sellSellNeutralBuyStrong buy
Oscillators
Neutral
SellBuy
Strong sellStrong buy
Strong sellSellNeutralBuyStrong buy
Summary
Neutral
SellBuy
Strong sellStrong buy
Strong sellSellNeutralBuyStrong buy
Summary
Neutral
SellBuy
Strong sellStrong buy
Strong sellSellNeutralBuyStrong buy
Summary
Neutral
SellBuy
Strong sellStrong buy
Strong sellSellNeutralBuyStrong buy
Moving Averages
Neutral
SellBuy
Strong sellStrong buy
Strong sellSellNeutralBuyStrong buy
Moving Averages
Neutral
SellBuy
Strong sellStrong buy
Strong sellSellNeutralBuyStrong buy
Displays a symbol's price movements over previous years to identify recurring trends.
Frequently Asked Questions
The current price of SHIB / UST (SHIB) is 0.00001012 USDT — it has fallen −1.53% in the past 24 hours. Try placing this info into the context by checking out what coins are also gaining and losing at the moment and seeing SHIB price chart.
SHIB / UST price has fallen by −11.20% over the last week, its month performance shows a −29.81% decrease, and as for the last year, SHIB / UST has decreased by −46.43%. See more dynamics on SHIB price chart.
Keep track of coins' changes with our Crypto Coins Heatmap.
Keep track of coins' changes with our Crypto Coins Heatmap.
SHIB / UST (SHIB) reached its highest price on Oct 28, 2021 — it amounted to 0.00008246 USDT. Find more insights on the SHIB price chart.
See the list of crypto gainers and choose what best fits your strategy.
See the list of crypto gainers and choose what best fits your strategy.
SHIB / UST (SHIB) reached the lowest price of 0.00000546 USDT on Jun 10, 2023. View more SHIB / UST dynamics on the price chart.
See the list of crypto losers to find unexpected opportunities.
See the list of crypto losers to find unexpected opportunities.
The safest choice when buying SHIB is to go to a well-known crypto exchange. Some of the popular names are Binance, Coinbase, Kraken. But you'll have to find a reliable broker and create an account first. You can trade SHIB right from TradingView charts — just choose a broker and connect to your account.
Crypto markets are famous for their volatility, so one should study all the available stats before adding crypto assets to their portfolio. Very often it's technical analysis that comes in handy. We prepared technical ratings for SHIB / UST (SHIB): today its technical analysis shows the neutral signal, and according to the 1 week rating SHIB shows the sell signal. And you'd better dig deeper and study 1 month rating too — it's sell. Find inspiration in SHIB / UST trading ideas and keep track of what's moving crypto markets with our crypto news feed.
SHIB / UST (SHIB) is just as reliable as any other crypto asset — this corner of the world market is highly volatile. Today, for instance, SHIB / UST is estimated as 11.92% volatile. The only thing it means is that you must prepare and examine all available information before making a decision. And if you're not sure about SHIB / UST, you can find more inspiration in our curated watchlists.
You can discuss SHIB / UST (SHIB) with other users in our public chats, Minds or in the comments to Ideas.