Silver Turns Bearish Again – Watch 47.50 Support CloselyPretty similar to Gold, Silver also failed to break above resistance yesterday and started to roll back down.
A few hours ago, the price touched short-term support and is now seeing a minor rebound.
However, the structure has clearly turned bearish, with lower highs confirming momentum exhaustion.

SilverXAGUSD
- Completed " 12345 " Impulsive Waves and " AB " Corrective Wave
- Break of Structure
- Fibonacci Level - 61.80% / 78.60%
- Ascending Triangle as an corrective pattern in Short Time Frame
- Order Block


Possible target of Silver in near future$76 is possible and projected target as per Elliot wave theory where 161% of wave 1. Am I correct or else. Please submit your view also.
Thank you.

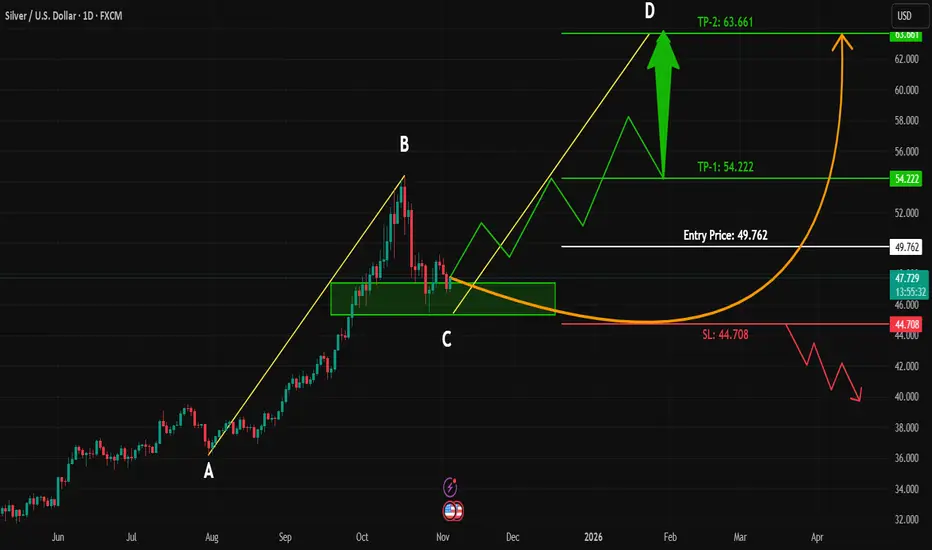
SILVER | Forming AB=CD Pattern | Strong Buy Zone Ahead!#SILVER is currently moving in a correction phase and has reached the Fib retracement zone between 0.382 – 0.5, which historically acts as a strong buying area for long-term investors.
At this zone, no major bearish signs are visible, and the structure suggests a possible formation of a bullish AB=
XAGUSD - Signal#XAGUSD - Signal
H4 - Formation of the 3rd wave + breakout of the trend line. Stop behind the high of the 2nd wave.
Entry: 48.19986
TP: 47.19755 - 46.35812 - 44.82284 - 43.16576
Stop: 49.15511

SILVER Will Go Higher! Long!
Take a look at our analysis for SILVER.
Time Frame: 1D
Current Trend: Bullish
Sentiment: Oversold (based on 7-period RSI)
Forecast: Bullish
The market is approaching a key horizontal level 4,796.6.
Considering the today's price action, probabilities will be high to see a movement to 5,274.4.
P

XAGUSD H1 | Bullish Bounce off SupportXAGUSD is falling towards our buy entry at 47.95, which is a minor pullback support level, that aligns with the H1 Fair Value Gap and 71% Fibonacci retracement level.
The stop loss is at 47.56, which is a swing low support level, while the take profit is at 48.73, which is a swing high resistance

XAGUSDHello Traders! 👋
What are your thoughts on Silver ?
Silver entered a corrective phase following its recent rally and is now trading below the resistance zone and the broken trendline.
This structure suggests weakening bullish momentum and a potential continuation to the downside once the pullback

Silver Builds Momentum: Break Above 49.50 in Sight1. What Happened Recently
After rebounding from the 45.50 recent low, Silver rallied strongly into the 49.30–49.50 resistance zone, where it faced short-term selling pressure. A healthy correction followed, taking price back to the 47.00 support area.
2. Market Reaction
From that zone, bulls ste

See all ideas
Summarizing what the indicators are suggesting.
Oscillators
Neutral
SellBuy
Strong sellStrong buy
Strong sellSellNeutralBuyStrong buy
Oscillators
Neutral
SellBuy
Strong sellStrong buy
Strong sellSellNeutralBuyStrong buy
Summary
Neutral
SellBuy
Strong sellStrong buy
Strong sellSellNeutralBuyStrong buy
Summary
Neutral
SellBuy
Strong sellStrong buy
Strong sellSellNeutralBuyStrong buy
Summary
Neutral
SellBuy
Strong sellStrong buy
Strong sellSellNeutralBuyStrong buy
Moving Averages
Neutral
SellBuy
Strong sellStrong buy
Strong sellSellNeutralBuyStrong buy
Moving Averages
Neutral
SellBuy
Strong sellStrong buy
Strong sellSellNeutralBuyStrong buy
Displays a symbol's price movements over previous years to identify recurring trends.