SILVER - The ATH Retest Opportunity!!!🚀Silver has officially broken above its all-time high - a major milestone for the metal. But nothing moves in a straight line, and healthy trends always correct before continuing higher.
📉Price is now on its way to retest the previous ATH zone in red, which aligns perfectly with the rising trendli

Silver $62 within 1-2 weeksSilver $62 within 1-2 weeks, or even days. Potential once in every 45 yrs epic price spike to $100 before New year 2026.
I'm long since $32 :)

Gold or Silver?Right now: SILVER!
I know, I know! Crazy schitt! Don't look at me!
The chart’s telling the story — Silver hasn’t even really started its move yet. Don’t blame me, I’m just reading the data.
Silver is up 87% year-over-year and outperforming gold by 11%, which is still on the low end historically.

Silver’s Cup & Handle Breakout – Road to $60+ Silver has completed a textbook cup and handle formation and is breaking above the key resistance level at $54. The pattern shows a rounded bottom (cup) formed between $46-$54, followed by a consolidation handle, with price now surging toward new highs at $56.5
Technical Setup:
• Cup depth: Approxi

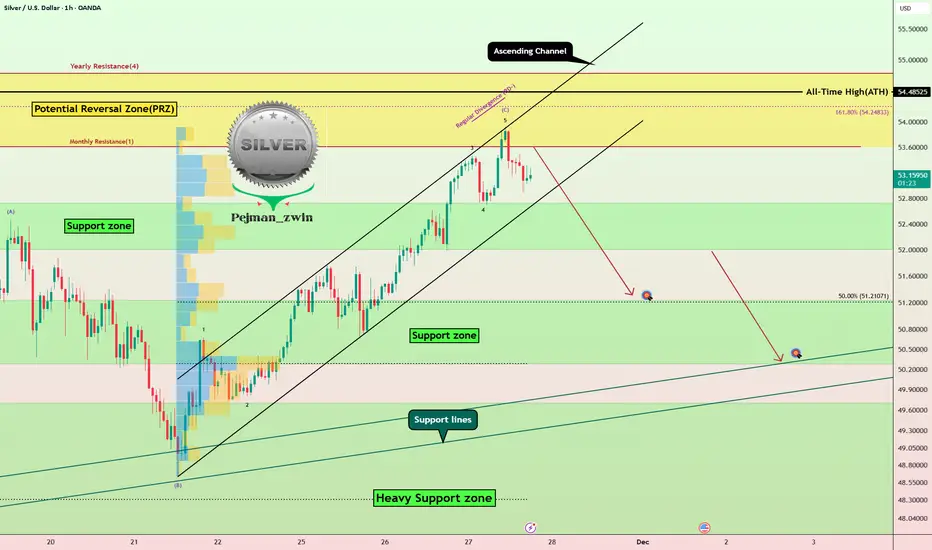
Silver Warning: RD- + PRZ = Short Opportunity?Today, we're diving into Silver ( OANDA:XAGUSD ), and it seems that there’s a potential short opportunity on the horizon.
Currently, silver is approaching a Potential Reversal Zone(PRZ) and an ascending channel.
From an Elliott Wave perspective, it appears that silver has completed wave C of an
SILVER BEST PLACE TO BUY FROM|LONG
SILVER SIGNAL
Trade Direction: long
Entry Level: 5,701.3
Target Level: 5,814.5
Stop Loss: 5,626.2
RISK PROFILE
Risk level: medium
Suggested risk: 1%
Timeframe: 1h
Disclosure: I am part of Trade Nation's Influencer program and receive a monthly fee for using their TradingView charts in my analys

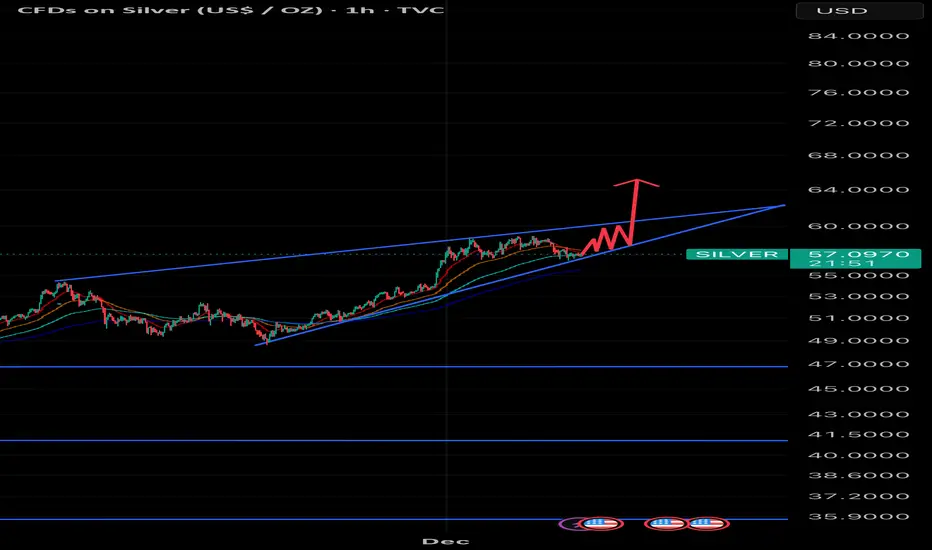
Rising Channel / Ascending TriangleLooks like this could be a good set up for silver right now for ATH. Looking for 65 once fomo starts after break out above 60 levels.
XAG/USD Long Position OpportunityBased on the daily technical analysis of XAG/USD, the overall trend remains bullish. Price is holding above the key support zone of $56–$56.5, which indicates strength for long positions. If this support sustains, the next upside target is expected in the $58–$60 resistance zone.
A temporary pullba

Silver price actionSreeni, you mentioned that if price is rising but volumes are falling, then we should not buy or rather it is a sell signal. In this graph, silver's price rose on Thursday and Friday but volumes are falling. What does this say?
SILVER Will Move Higher! Long!
Please, check our technical outlook for SILVER.
Time Frame: 1D
Current Trend: Bullish
Sentiment: Oversold (based on 7-period RSI)
Forecast: Bullish
The market is trading around a solid horizontal structure 5,642.3.
The above observations make me that the market will inevitably achieve 6,175.7 l

See all ideas
Summarizing what the indicators are suggesting.
Oscillators
Neutral
SellBuy
Strong sellStrong buy
Strong sellSellNeutralBuyStrong buy
Oscillators
Neutral
SellBuy
Strong sellStrong buy
Strong sellSellNeutralBuyStrong buy
Summary
Neutral
SellBuy
Strong sellStrong buy
Strong sellSellNeutralBuyStrong buy
Summary
Neutral
SellBuy
Strong sellStrong buy
Strong sellSellNeutralBuyStrong buy
Summary
Neutral
SellBuy
Strong sellStrong buy
Strong sellSellNeutralBuyStrong buy
Moving Averages
Neutral
SellBuy
Strong sellStrong buy
Strong sellSellNeutralBuyStrong buy
Moving Averages
Neutral
SellBuy
Strong sellStrong buy
Strong sellSellNeutralBuyStrong buy
Displays a symbol's price movements over previous years to identify recurring trends.