XAGUSDHello Traders! 👋
What are your thoughts on Silver ?
Silver entered a corrective phase following its recent rally and is now trading below the resistance zone and the broken trendline.
This structure suggests weakening bullish momentum and a potential continuation to the downside once the pullback

Silver Turns Bearish Again – Watch 47.50 Support CloselyPretty similar to Gold, Silver also failed to break above resistance yesterday and started to roll back down.
A few hours ago, the price touched short-term support and is now seeing a minor rebound.
However, the structure has clearly turned bearish, with lower highs confirming momentum exhaustion.

The Silver Storm: 9k Pips Down, but Bulls Start Breathing AgainWhile Gold has been volatile, Silver’s drop has been even more spectacular — a breathtaking 9,000-pip decline in just 10 days, from the all-time high near 54.50 down to 45.50, a correction of roughly 20%.
But let’s not forget — the prior rally was just as extreme: from 37 to almost 55, a 50% surge.

31.10.25 Morning ForecastPairs on Watch -
FX:EURAUD
OANDA:XAGUSD
A short overview of the instruments I am looking at for today, multi-timeframe analysis down to what I will be looking at for an entry. Enjoy!

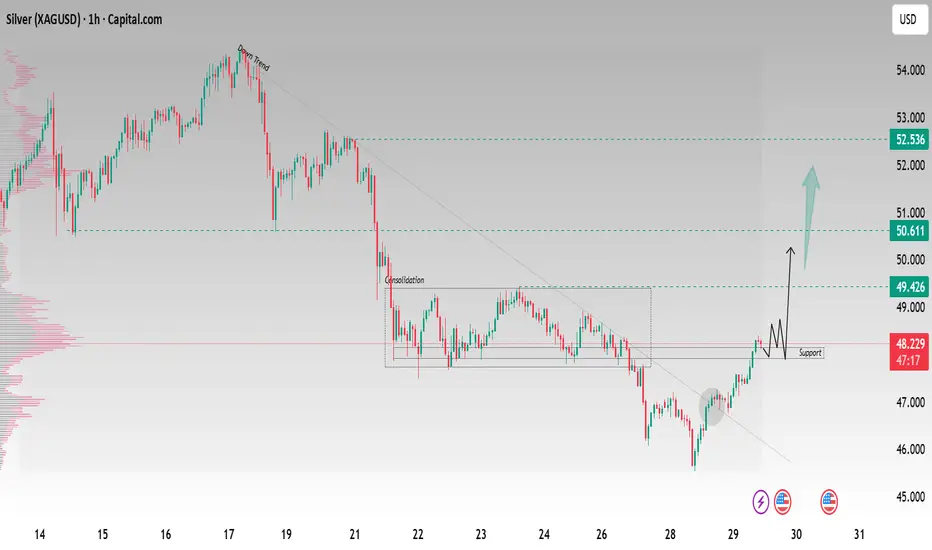
SILVER Down Trend breakout bullish from support zoneSilver Bullish Breakout Alert! 💥
📉 After a strong downtrend, Silver has shown a bullish move from the key support zone at $48.200 🪙
📊 Timeframe: 1H
🎯 Technical Targets:
1️⃣ $49.400
2️⃣ $50.600
3️⃣ $52.500
⚙️ Setup:
✅ Buying from support
✅ Breakout confirmation
✅ Trend reversal signs visible
#XAGUSD(SILVER): Bears In Control Three Targets Swing SellSilver’s price dropped significantly yesterday, continuing a trend from last week’s Thursday when substantial trading commenced.
The data suggests an increase in bearish volume, indicating a potential selling opportunity. To identify a more precise entry zone, we should utilise smaller timeframes.

Silver bull will try to throw you off, but long term healthyA pause that could refresh might be warranted in silver and gold.
I am still optimistic for precious metals long term.
Silver is still undervalued based on historical metrics and money supply.
I worry about the rise in metals and what it implies for the broad stock market indices.

XAGUSD – Liquidity Grab & Supply Rejection ScenarioThis chart illustrates a Smart Money Concept (SMC) outlook on Silver (XAGUSD) with key structural points:
Market Structure Breaks (MSB / BOS / CHOCH) highlighting shifts between bullish and bearish order flow.
Liquidity zones marked where prior highs/lows may attract orders.
Supply Zone (Be_BB) a

XAGUSD - Silver BUY CAPITALCOM:SILVER
Previously, Silver had a huge selloff, but on October 28, price on Daily timeframe tapped into 50 EMA, created a doji candle and failed to make LL to support continuing sell bias
Price on 1H, 4H, and Daily timeframe are all trading above EMA50
4H making HH-HL and recently br

XAGUSD - Signal#XAGUSD - Signal
H4 - Formation of the 3rd wave + breakout of the trend line. Stop behind the high of the 2nd wave.
Entry: 48.19986
TP: 47.19755 - 46.35812 - 44.82284 - 43.16576
Stop: 49.15511

See all ideas
Summarizing what the indicators are suggesting.
Oscillators
Neutral
SellBuy
Strong sellStrong buy
Strong sellSellNeutralBuyStrong buy
Oscillators
Neutral
SellBuy
Strong sellStrong buy
Strong sellSellNeutralBuyStrong buy
Summary
Neutral
SellBuy
Strong sellStrong buy
Strong sellSellNeutralBuyStrong buy
Summary
Neutral
SellBuy
Strong sellStrong buy
Strong sellSellNeutralBuyStrong buy
Summary
Neutral
SellBuy
Strong sellStrong buy
Strong sellSellNeutralBuyStrong buy
Moving Averages
Neutral
SellBuy
Strong sellStrong buy
Strong sellSellNeutralBuyStrong buy
Moving Averages
Neutral
SellBuy
Strong sellStrong buy
Strong sellSellNeutralBuyStrong buy
Displays a symbol's price movements over previous years to identify recurring trends.