Silver psychological 5000 support levelThe Silver remains in a bullish trend, with recent price action showing signs of a corrective pullback within the broader uptrend.
Support Zone: 5000 – a key level from previous consolidation. Price is currently testing or approaching this level.
A bullish rebound from 5000 would confirm ongoing upside momentum, with potential targets at:
5215 – initial resistance
5325 – psychological and structural level
5390 – extended resistance on the longer-term chart
Bearish Scenario:
A confirmed break and daily close below 5000 would weaken the bullish outlook and suggest deeper downside risk toward:
4940 – minor support
4856 – stronger support and potential demand zone
Outlook:
Bullish bias remains intact while silver holds above 5000. A sustained break below this level could shift momentum to the downside in the short term.
This communication is for informational purposes only and should not be viewed as any form of recommendation as to a particular course of action or as investment advice. It is not intended as an offer or solicitation for the purchase or sale of any financial instrument or as an official confirmation of any transaction. Opinions, estimates and assumptions expressed herein are made as of the date of this communication and are subject to change without notice. This communication has been prepared based upon information, including market prices, data and other information, believed to be reliable; however, Trade Nation does not warrant its completeness or accuracy. All market prices and market data contained in or attached to this communication are indicative and subject to change without notice.
Trade ideas

The resulte of XAGUSD AnalysisEverything is on the beat and the setup is in the 3 Reward.
-----------------------------------------------------------------------------------------
🚀 Who am I?
I'm Mahdi, a prop firm trader with 7+ years of experience in technical analysis, mainly focusing on Smart Money Concepts and Elliott Wave theory.
I specialize in delivering high-quality trading signals, market insights, and educational content tailored for serious traders and investors.
📊 My Tools: SMC, Elliott Wave, Fibonacci, Liquidity Grabs, Order Blocks
💼 Prop Challenge Passed: Yes | Funded Account: In Progress
🔗 Follow for consistent updates and trading insights.

SILVER BEARS WILL DOMINATE THE MARKET|SHORT
SILVER SIGNAL
Trade Direction: short
Entry Level: 5,103.6
Target Level: 4,498.0
Stop Loss: 5,504.6
RISK PROFILE
Risk level: medium
Suggested risk: 1%
Timeframe: 1D
Disclosure: I am part of Trade Nation's Influencer program and receive a monthly fee for using their TradingView charts in my analysis.
✅LIKE AND COMMENT MY IDEAS✅

SILVER (XAG/USD): Bullish Reversal ConfirmedIt appears that 📈SILVER may be poised for a bullish correctional movement.
The price has formed a symmetrical triangle and has violated its resistance line.
It seems plausible that the market could readily reach the 51.60 level in the near future.

XAGUSD H1 | Bearish Reaction off Key ResistanceMomentum: Bearish
Price is currently below the ichimoku cloud.
Sell entry: 52.072
- Strong pullback resistance
- 61.8% Fib retracement
- Fair Value Gap
Stop Loss: 53.433
- Overlap resistance
Take Profit: 50.29
- Multi-swing low support
High Risk Investment Warning
Stratos Markets Limited (tradu.com/uk ), Stratos Europe Ltd (tradu.com/eu ):
CFDs are complex instruments and come with a high risk of losing money rapidly due to leverage. 70% of retail investor accounts lose money when trading CFDs with this provider. You should consider whether you understand how CFDs work and whether you can afford to take the high risk of losing your money.
Stratos Global LLC (tradu.com/en ): Losses can exceed deposits.
Please be advised that the information presented on TradingView is provided to Tradu (‘Company’, ‘we’) by a third-party provider (‘TFA Global Pte Ltd’). Please be reminded that you are solely responsible for the trading decisions on your account. Any information and/or content is intended entirely for research, educational and informational purposes only and does not constitute investment or consultation advice or investment strategy. The information is not tailored to the investment needs of any specific person and therefore does not involve a consideration of any of the investment objectives, financial situation or needs of any viewer that may receive it. Past performance is not a reliable indicator of future results. Actual results may differ materially from those anticipated in forward-looking or past performance statements. We assume no liability as to the accuracy or completeness of any of the information and/or content provided herein and the Company cannot be held responsible for any omission, mistake nor for any loss or damage including without limitation to any loss of profit which may arise from reliance on any information supplied by TFA Global Pte Ltd.

SILVER USDHI GUYS,
We are bullish right now . trend-line was accurate , price pattern and days of the week were on point.
Expect sells tuesday, wednsday .

XAGUSD H4 | Bullish Bounce off Key SupportMomentum: Bullish
Price is currently above the bullish ichimoku cloud.
Buy entry: 49.11
- Strong pullback support
- 71% Fib retracement
- 61.8% Fib projection
Stop Loss: 46.89
- Swing low support
Take Profit: 51.98
- Pullback resistance
High Risk Investment Warning
Stratos Markets Limited (tradu.com/uk ), Stratos Europe Ltd (tradu.com/eu ):
CFDs are complex instruments and come with a high risk of losing money rapidly due to leverage. 70% of retail investor accounts lose money when trading CFDs with this provider. You should consider whether you understand how CFDs work and whether you can afford to take the high risk of losing your money.
Stratos Global LLC (tradu.com/en ): Losses can exceed deposits.
Please be advised that the information presented on TradingView is provided to Tradu (‘Company’, ‘we’) by a third-party provider (‘TFA Global Pte Ltd’). Please be reminded that you are solely responsible for the trading decisions on your account. Any information and/or content is intended entirely for research, educational and informational purposes only and does not constitute investment or consultation advice or investment strategy. The information is not tailored to the investment needs of any specific person and therefore does not involve a consideration of any of the investment objectives, financial situation or needs of any viewer that may receive it. Past performance is not a reliable indicator of future results. Actual results may differ materially from those anticipated in forward-looking or past performance statements. We assume no liability as to the accuracy or completeness of any of the information and/or content provided herein and the Company cannot be held responsible for any omission, mistake nor for any loss or damage including without limitation to any loss of profit which may arise from reliance on any information supplied by TFA Global Pte Ltd.

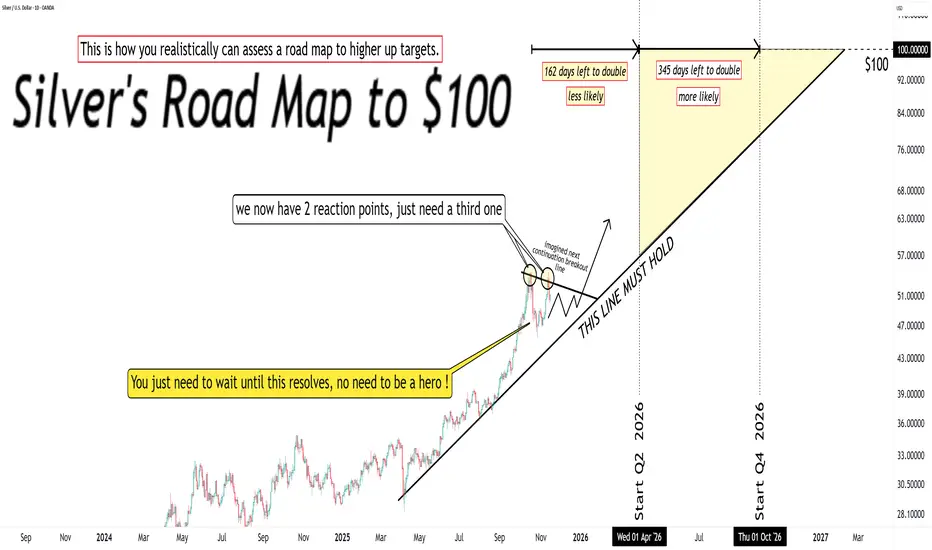
Higher up targets like $100 must wait.Silver.
Higher up targets like $100 must wait, as the correction still in progress.
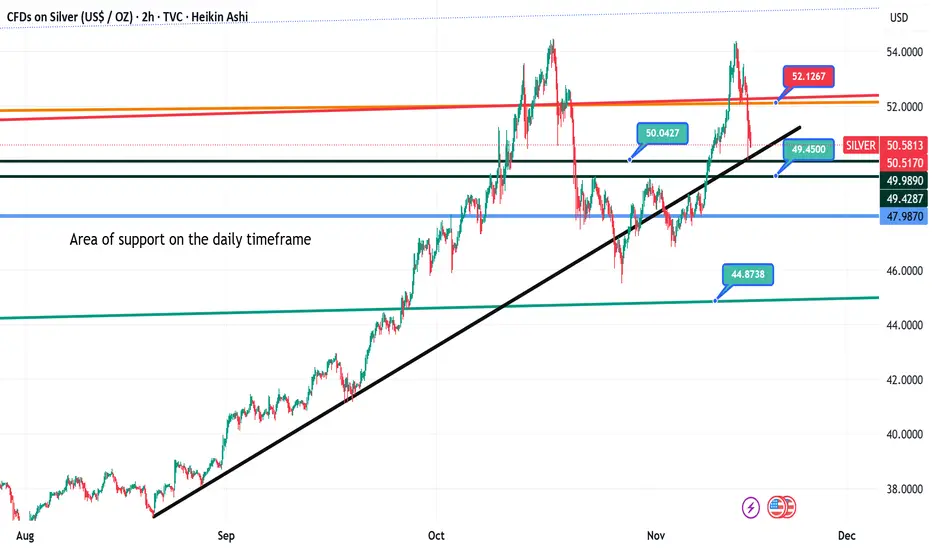
leaning against the Daily timeframe Support.People are watching Silver like a double top.
I see ann Inverse Head and Shoulders (84 bars) pattern on the 2-hour timeframe — leaning against the Daily timeframe Support.
Therefore, it can be a powerful chart pattern to trade.
I have been observing the 1M and 3M Silver chart and if Silver breaks out above 52$ it will literaly fly. Absolutely you have to break out 52$ on the monthly.
I have drawn my support areas from different time frames.
XAUUSD SILVER DAILY PERSPECTIVE SILVER CURRENT = 50.538
the daily price action gave us head and shoulder and came beck to retest the neckline in the form of ascending trendline and the weekly line chart close provided extra layer of resistance at 54.27 and was backed by sell catalyst from structural perspective .
as the market open i will apply 3-1 rule for retest into broken demand floor in the zone of 51.900-51.456 .if this analysis go as planed then i will hold sell into 49.032 while watching the dollar index and united states 10 year treasury bond yield .
the next support zone will 45.700- 45.300
the next support zone will be 41.241 and 50% of the rally using Fibonacci strategy.
Silver fundamental.
Fundamentals of Silver
Silver is a precious metal with a dual role as both an investment asset and an industrial commodity.
Its price is influenced by factors such as inflation, industrial demand, investment flows, and geopolitical risks.
Silver market has faced a structural deficit for several years, with supply consistently falling short of demand, supporting upward price pressure.
Investment demand remains robust, driven by ETFs, bullion purchases, and as a hedge against inflation and currency risk.
Key Uses of Silver
Industrial Applications (Approx. 56% of demand):
Electronics and electrical contacts due to excellent conductivity
Solar photovoltaic (solar panels) industry for clean energy production
Automotive industry, especially in electric vehicles (EVs) for battery and electronics components
Medical uses due to antimicrobial properties
5G infrastructure, advanced computing, and IoT devices
Jewelry and Silverware: Traditional uses driving consistent demand
Investment: Physical silver, ETFs, coins, and bars for hedging and portfolio diversification
Countries with the Highest Silver Deposits (Reserves)
Rank Country Silver Reserves (Metric Tons) Approximate Share of Global Reserves (%)
1 Peru 140,000 17.5%
2 Russia 92,000 14.7%
3 Australia 94,000 15.0%
4 China 72,000 11.5%
5 Poland 63,000 10.0%
6 Mexico 37,000 5.9%
7 Chile 26,000 4.2%
8 United States 23,000 3.7%
9 Bolivia 22,000 3.5%
10 Argentina 23,000 3.7%
Peru is the world leader in silver reserves, followed closely by Australia and Russia.
Mexico leads as the largest silver producer.
These deposits form the backbone of global silver supply and significantly impact price dynamics.
Summary
Silver is a critical industrial metal with growing applications in electronics, clean energy, and medical technology, supported by strong investment demand.
GOODLUCK

SILVER Trading Opportunity! BUY!
My dear subscribers,
My technical analysis for SILVER is below:
The price is coiling around a solid key level - 50.560
Bias - Bullish
Technical Indicators: Pivot Points Low anticipates a potential price reversal.
Super trend shows a clear buy, giving a perfect indicators' convergence.
Goal - 51.903
My Stop Loss - 49.919
About Used Indicators:
By the very nature of the supertrend indicator, it offers firm support and resistance levels for traders to enter and exit trades. Additionally, it also provides signals for setting stop losses
Disclosure: I am part of Trade Nation's Influencer program and receive a monthly fee for using their TradingView charts in my analysis.
———————————
WISH YOU ALL LUCK

Silver is in the Bullish directionHello Traders
In This Chart XAGUSD HOURLY Forex Forecast By FOREX PLANET
today XAGUSD analysis 👆
🟢This Chart includes_ (XAGUSD market update)
🟢What is The Next Opportunity on XAGUSD Market
🟢how to Enter to the Valid Entry With Assurance Profit
This CHART is For Trader's that Want to Improve Their Technical Analysis Skills and Their Trading By Understanding How To Analyze The Market Using Multiple Timeframes and Understanding The Bigger Picture on the Charts
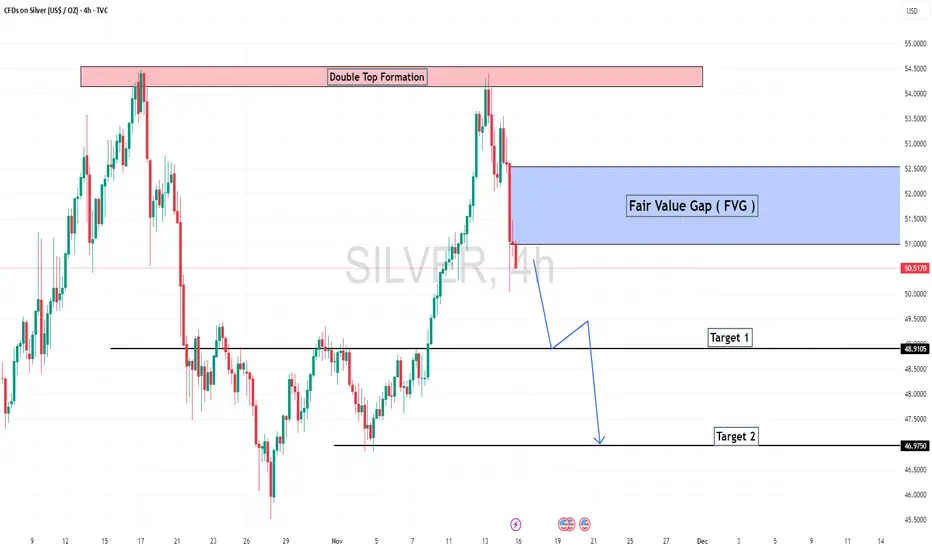
SILVER NOT a Cup & Handle = Bearish Signal
Look like the pattern is invalid due to:
1. Handle Position: The handle should form in the upper half of the cup's structure, ideally retracing no more than one-third of the cup's depth.
2. If the handle of a cup and handle pattern keeps going downwards more than halfway into the cup, the pattern is generally considered invalid or significantly weakened as a bullish signal.
What do you think?

XAGUSD M30 | Bullish Bounce Off Fib LevelsMomentum: Bullish
The price is currently pulling back toward the buy entry level, which aligns with the 38.2% Fibonacci retracement and the 61.8% Fibonacci projection, both reinforcing a strong bullish setup.
Buy Entry: 51.78
Pullback Support:
38.2% Fibonacci retracement
61.8% Fibonacci projection
Stop Loss: 51.14
Support Level:
50% Fibonacci retracement
Take Profit: 53.46
Pullback Resistance
High Risk Investment Warning
Stratos Markets Limited (tradu.com ), Stratos Europe Ltd (tradu.com ):
CFDs are complex instruments and come with a high risk of losing money rapidly due to leverage. 70% of retail investor accounts lose money when trading CFDs with this provider. You should consider whether you understand how CFDs work and whether you can afford to take the high risk of losing your money.
Stratos Global LLC (tradu.com ): Losses can exceed deposits.
Please be advised that the information presented on TradingView is provided to Tradu (‘Company’, ‘we’) by a third-party provider (‘TFA Global Pte Ltd’). Please be reminded that you are solely responsible for the trading decisions on your account. Any information and/or content is intended entirely for research, educational and informational purposes only and does not constitute investment or consultation advice or investment strategy. The information is not tailored to the investment needs of any specific person and therefore does not involve a consideration of any of the investment objectives, financial situation or needs of any viewer that may receive it. Past performance is not a reliable indicator of future results. Actual results may differ materially from those anticipated in forward-looking or past performance statements. We assume no liability as to the accuracy or completeness of any of the information and/or content provided herein and the Company cannot be held responsible for any omission, mistake nor for any loss or damage including without limitation to any loss of profit which may arise from reliance on any information supplied by TFA Global Pte Ltd.

Multi-decade SLV Cup-and-HandleIf silver breaks above its previous highs against the dollar, it could trigger a surge in investor interest, pushing prices even higher.
If the WSB / NYSE:GME / NYSE:AMC deigns realize how much open short interest is on Silver, we could see a massive run to new ATHs for Silver per Oz. Pay attention to Derivatives like AMEX:AGQ , which touched close to $800 last time Silver was up at ~$48/oz in 2011. Be ready for fireworks if these shorts begin to feel a squeeze.

Silver Price Ready for Lift-Off: Bullish Channel Silver (XAG/USD) is consolidating within a rising channel, with strong Ichimoku cloud support hinting at a potential bullish breakout. After a brief pullback to the lower channel boundary, price action shows signs of rebound momentum targeting the $54 resistance zone. A confirmed break above $53 could trigger an upward move equal to the channel height, continuing the bullish trend. Traders are watching for a breakout confirmation above the midline for a potential long setup.
🧭 Chart Overview
Timeframe: 30-minute chart
Indicator: Ichimoku Cloud (9, 26, 52, 26)
Price: $52.67 (as of the chart time)
Trend Channel: Rising (ascending parallel channel)
---
📊 Price Action Analysis
1. Trend Structure:
The chart shows Silver trading inside a well-defined ascending channel, respecting both upper and lower boundaries.
Price recently bounced off the lower channel support, which often acts as a bullish signal within an ongoing trend.
2. Ichimoku Cloud (Kumo):
The price is hovering around the top of the Ichimoku cloud, suggesting neutral-to-bullish sentiment.
The cloud’s future span (Senkou Span A > Span B) points slightly upward — a sign of potential continuation of the uptrend.
Support lies near the $52.50–$52.60 zone, which aligns with both the lower channel line and the top of the cloud — a strong confluence area.
3. Momentum Observation:
The recent correction looks more like a healthy retracement than a reversal.
Buyers are likely waiting for confirmation before pushing higher.
4. Breakout Levels:
Immediate Resistance: $53.40 (mid-channel + previous top).
Major Resistance: $54.00 (upper channel target).
Support Zone: $52.50–$52.00 (Ichimoku + trendline confluence).
---
🚀 Bullish Scenario
If price closes above $53.40, it would confirm a breakout of the short-term consolidation pattern.
The projected move (based on the channel height) suggests a target near $54.50–$54.60.

xagusd 4h🔹 Overall Outlook and Potential Price Movements
In the charts above, we have outlined the overall outlook and possible price movement paths.
As shown, each analysis highlights a key support or resistance zone near the current market price. The market’s reaction to these zones — whether a breakout or rejection — will likely determine the next direction of the price toward the specified levels.
⚠️ Important Note:
The purpose of these trading perspectives is to identify key upcoming price levels and assess potential market reactions. The provided analyses are not trading signals in any way.
✅ Recommendation for Use:
To make effective use of these analyses, it is advised to manually draw the marked zones on your chart. Then, on the 15-minute time frame, monitor the candlestick behavior and look for valid entry triggers before making any trading decisions.

Silver likely moving towards 45.5Everyone is asking what happened to OANDA:XAGUSD and OANDA:XAUUSD and surprised that why it's going down suddenly. But it's just following the Elliott Wave counts and this was very much on cards as I have been sharing on my X account since last couple of weeks.
Silver has started wave C down within wave (4). As per wave A and C equality, it could slide to 45.5 before it continues it's move upwards. Gold is also doing something similar.

SILVER: Bulls Will Push Higher
The recent price action on the SILVER pair was keeping me on the fence, however, my bias is slowly but surely changing into the bullish one and I think we will see the price go up.
Disclosure: I am part of Trade Nation's Influencer program and receive a monthly fee for using their TradingView charts in my analysis.
❤️ Please, support our work with like & comment! ❤️

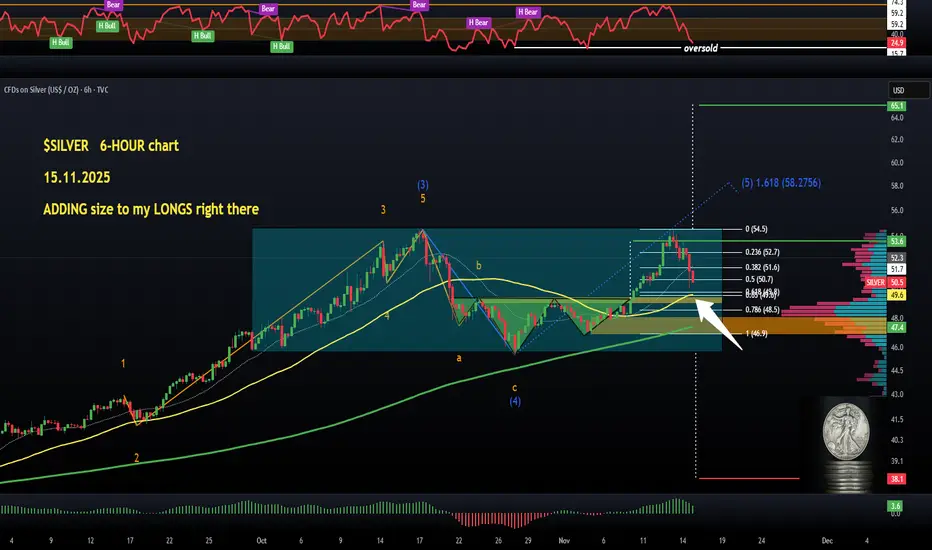
$SILVER (6-HOUR): adding SIZE to my LONG right there:The quoted #Silver 4-hour chart shows a text-book inverted HEAD & SHOULDERS that played out perfectly and reached its $53.6 target.
I usually take profits on text-book breakouts, but this asset is an exception as I have higher targets in mind.
The attached 6-hour chart shows a correction that started after markets closed last Wednesday, followed by a wider market correction. Top stocks were bleeding heavily as well.
So many “traders” are calling this a DOUBLE TOP and they are just wrong.
Way too early imo, as TVC:SILVER is likely in a clear WAVE 5 rally during a re-accumulation phase (hence the rectangle with a breakout point at $54.5 and targeting $65.1). WAVE 5 on the daily, 12-hour and 6-hour charts. I like this confluence in EW.
RSI is oversold now, just like it recently was at the bottom of the inverted H&S. The 50 MA is acting as dynamic support at $49.6, and the 200 MA at $47.4 can be used as an invalidation point for my bullish thesis.
A dip to $47 would be fine as long as it gets bought up quickly. I will add to my long with conviction between $47 and $50.
Take-profit levels from my previous SILVER post remain unchanged.
$50 is dirt-cheap and people will realise it soon.
👽💙
Trading Education: Understanding Liquidity (IRL & ERL)In technical analysis (especially SMC/ICT), most price movements are attempts to reach liquidity. This liquidity is what fuels major moves.
* IRL (Internal Range Liquidity): Liquidity located within a defined trading range. This is often represented by Order Blocks, Fair Value Gaps (FVG), or liquidity pools inside the range.
* ERL (External Range Liquidity): Liquidity located outside the trading range, usually represented by Swing Highs and Swing Lows which act as Stop-Loss Pools.
🔄 The Philosophy of Price Movement
Price generally moves from IRL \to ERL or vice versa:
* IRL \to ERL (External Clearance): 🧹 After hitting/mitigating an imbalance or Order Block (IRL) within the range, the price will accelerate outwards to sweep (clear) the Stop-Losses located at the Swing Highs/Lows (ERL).
* ERL \to IRL (Internal Refill): ⛽ Once the ERL is cleared (liquidity sweep), the price tends to reverse to target and refill unmitigated imbalances or Order Blocks inside the range (IRL).
The takeaway: ERL acts as the primary target for liquidity clearance, while IRL is the area where "Smart Money" looks for entry points or reactions to continue the move.
#Trading #TechnicalAnalysis #SMC #ICT #Liquidity #IRL #ERL

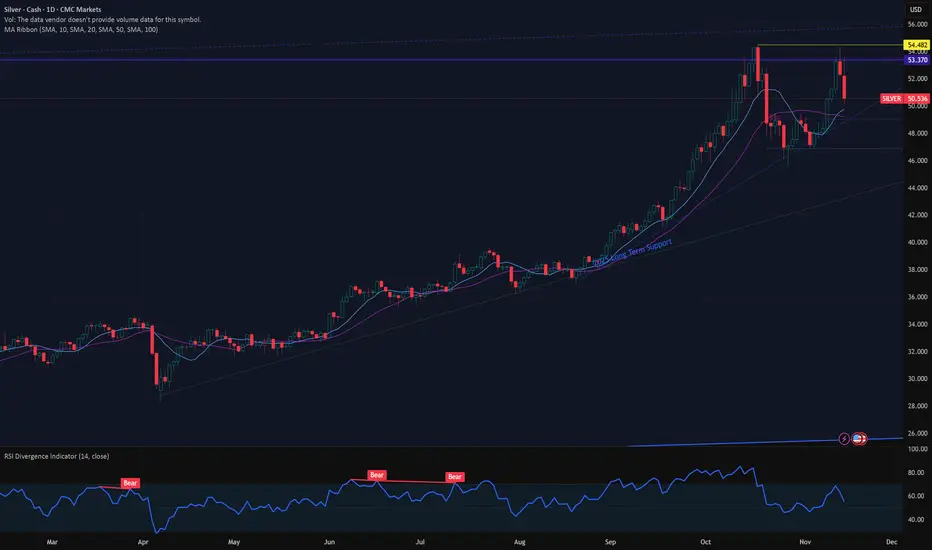
Double Top is inKind of an amazing week for Silver but its hard to not conclude that the double top is in. I was completely wrong with my prior bear flag hypothesis and Mr Market was so kind to throw a few more bullish candles at us to stop out the shorts (Luckily I was neutral) & confirm that top at $54ish along with a really ugly RSI divergence indicator. I am fully out of metals now as this market is wild and unpredictable now but I do think that maybe this precious metals bull market is over and we will get a bit of mean reversion now.
On a longer time frame, the 200 day EMA is down at $40 in Silver and the 48 month is at $30 - In 2009, on the monthly chart, the distance between the 48 month EMA touch (July 2009) and the peak in April 2011 (the then all time high) is 21 months. Its currently 21 months since we made contact with the 48 month EMA in Feb 2024. Just something to note in extended bull runs.