SILVER: Bearish Continuation is Highly Probable! Here is Why:
Looking at the chart of SILVER right now we are seeing some interesting price action on the lower timeframes. Thus a local move down seems to be quite likely.
Disclosure: I am part of Trade Nation's Influencer program and receive a monthly fee for using their TradingView charts in my analysis.
❤️ Please, support our work with like & comment! ❤️
Trade ideas

SILVER USDHI GUYS,
SILVER USD is on a road to success as we expect a head to shoulder h4, h3 price pattern with
a correction of detail in h1, 30min.
lets scalp sell this pair with ease Monday morning

1980 Redux? SILVER set to Outshine the NYSE Composite.Has Silver set the stage to approach its all time high's versus the "Big Index" that was last seen close to 50 years ago.?
Why this chart is spectacular:
Silver has moved sharply higher this year, breaching it's historic $50 threshold, a feat last seen in 1980 and 2011.
Notable the Silver/US Equities ratio (using the TVC:NYA as a broad proxy) is forming a multi year bottom structure. Suggesting we are in the process of a powerful repricing from equities to commodities.
This is not a crash call on Stocks.
Simply put Metals and commodities are just likely be faster horses and receive higher capital allocations.
We've seen the Big short during the GFC.
We've seen Saylor's Big long trade on #BTC
is Silver the Big Reversal?

Silver is in the Bullish directionHello Traders
In This Chart XAGUSD HOURLY Forex Forecast By FOREX PLANET
today XAGUSD analysis 👆
🟢This Chart includes_ (XAGUSD market update)
🟢What is The Next Opportunity on XAGUSD Market
🟢how to Enter to the Valid Entry With Assurance Profit
This CHART is For Trader's that Want to Improve Their Technical Analysis Skills and Their Trading By Understanding How To Analyze The Market Using Multiple Timeframes and Understanding The Bigger Picture on the Charts
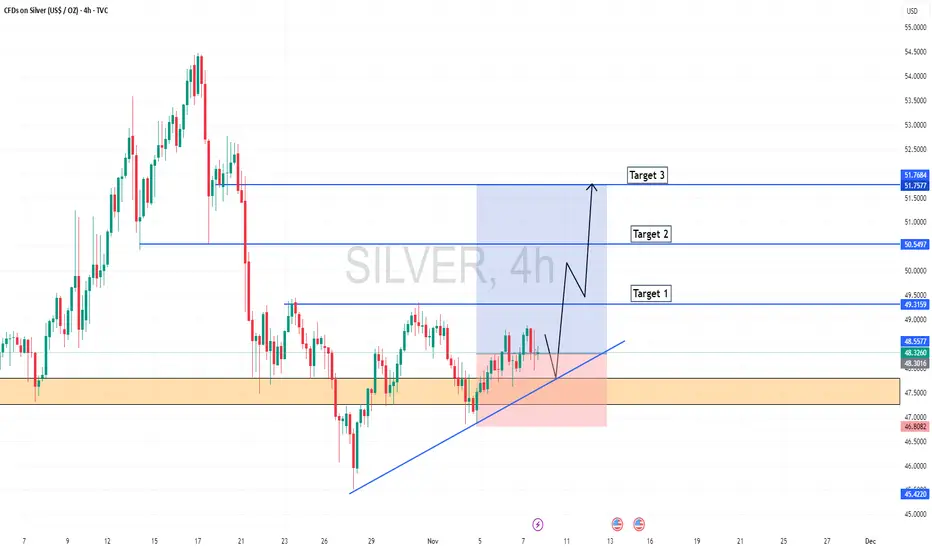
Silver, bullish or bearish?Bullish divergence in RSI, an ascending triangle, and a moving average, combined with hitting the neckline, all these indications make Silver a good candidate for a Bullish rally that can reap a 1:3 RRR.

Bullish momentum to extend?The Silver (XAG/USD) is falling towards the support level which is an overlap support and could bounce from this level to the upside.

Silver shortPlayed with Elliott tools. I think we get another wave down towards 20 week SMA.
AI commentary follows:
“Operation Silver Slide” 🛝
The plan is simple: wait for silver to puff its chest at $48, then gently remind it that gravity still exists. We’ll ride the wave down like surfers on a metallic tsunami — aiming for $42, where value investors wait with open arms and empty wallets. It’s not personal, just physics (and Elliott Wave theory). Remember: in markets, what goes up five waves must come down three. 🪙📉


xagusd 4h🔹 Overall Outlook and Potential Price Movements
In the charts above, we have outlined the overall outlook and possible price movement paths.
As shown, each analysis highlights a key support or resistance zone near the current market price. The market’s reaction to these zones — whether a breakout or rejection — will likely determine the next direction of the price toward the specified levels.
⚠️ Important Note:
The purpose of these trading perspectives is to identify key upcoming price levels and assess potential market reactions. The provided analyses are not trading signals in any way.
✅ Recommendation for Use:
To make effective use of these analyses, it is advised to manually draw the marked zones on your chart. Then, on the 15-minute time frame, monitor the candlestick behavior and look for valid entry triggers before making any trading decisions.

Downtrend in silverAccording to the previous analysis, the price of silver has indeed fallen. Now, since the price has penetrated the previous low, we can expect the price to correct either from here or from the dp range and resume its downward trend.

The big XAG LongPlaying the potential Wave 3 for Silver.
My invalidation will be a weekly close below the highlighted demand zone.

Measured move would fill a gap!If this measured move in silver plays out, it would fill an important monthly/weekly/daily gap and retest the $39 breakout line.
We must first watch to see which direction this goes when it escapes the squeezing triangle.

XAG longlongin xag from W CRT lows after accumulation, inverted H&S and h4 crt lows wich sweeped sell side liquidity, tarhgeting 50% of higher timeframe CRT.

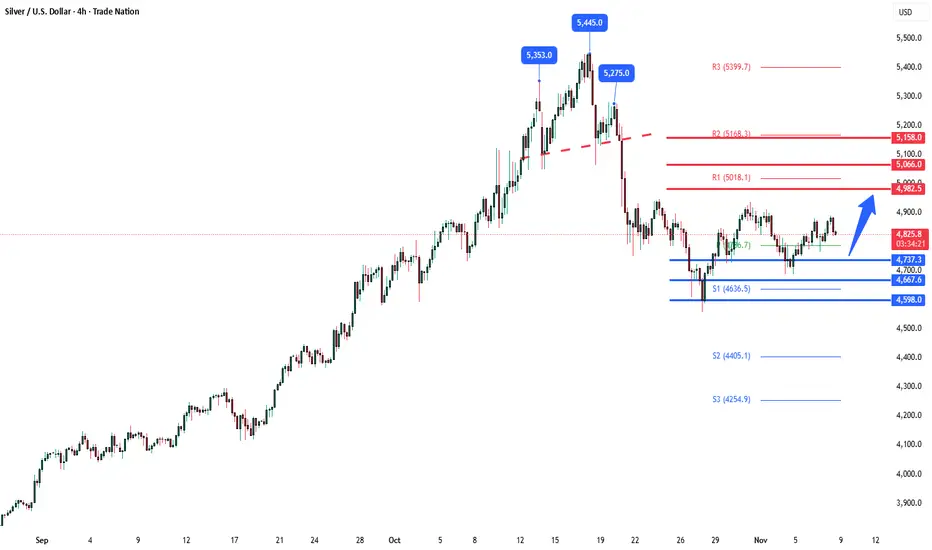
Solver key support at 4737Silver remains in a bullish trend, with recent price action showing signs of a corrective pullback within the broader uptrend.
Support Zone: 4737 – a key level from previous consolidation. Price is currently testing or approaching this level.
A bullish rebound from 4737 would confirm ongoing upside momentum, with potential targets at:
4980 – initial resistance
5066 – psychological and structural level
5166 – extended resistance on the longer-term chart
Bearish Scenario:
A confirmed break and daily close below 4737 would weaken the bullish outlook and suggest deeper downside risk toward:
4667 – minor support
4600 – stronger support and potential demand zone
Outlook:
Bullish bias remains intact while the silver holds above 4737. A sustained break below this level could shift momentum to the downside in the short term.
This communication is for informational purposes only and should not be viewed as any form of recommendation as to a particular course of action or as investment advice. It is not intended as an offer or solicitation for the purchase or sale of any financial instrument or as an official confirmation of any transaction. Opinions, estimates and assumptions expressed herein are made as of the date of this communication and are subject to change without notice. This communication has been prepared based upon information, including market prices, data and other information, believed to be reliable; however, Trade Nation does not warrant its completeness or accuracy. All market prices and market data contained in or attached to this communication are indicative and subject to change without notice.
Gold and Silver Uptrends: Still Intact?Gold and silver had powerful rallies in recent months, and some traders may see further upside.
The first pattern on today’s chart of silver is the ascending triangle since October 28. That’s a potentially bullish continuation pattern.
Second, OANDA:XAGUSD is pushing back above its 8- and 21-day exponential moving averages. That may be consistent with a positive trend in the short term.
Third, Wilder’s Relative Strength Index (RSI) peaked in overbought territory above 85 in mid-October. It pulled back and stabilized above 40, which may suggest upward momentum remains intact.
Gold also bottomed on October 28, finding support at a weekly close from October 3. The yellow metal has proceeded to make higher lows since then.
Next, OANDA:XAUUSD is inching back toward $4,000. Returning above that psychologically important level could also boost sentiment.
TradeStation has, for decades, advanced the trading industry, providing access to stocks, options and futures. If you're born to trade, we could be for you. See our Overview for more.
Past performance, whether actual or indicated by historical tests of strategies, is no guarantee of future performance or success. There is a possibility that you may sustain a loss equal to or greater than your entire investment regardless of which asset class you trade (equities, options or futures); therefore, you should not invest or risk money that you cannot afford to lose. Online trading is not suitable for all investors. View the document titled Characteristics and Risks of Standardized Options at www.TradeStation.com . Before trading any asset class, customers must read the relevant risk disclosure statements on www.TradeStation.com . System access and trade placement and execution may be delayed or fail due to market volatility and volume, quote delays, system and software errors, Internet traffic, outages and other factors.
Securities and futures trading is offered to self-directed customers by TradeStation Securities, Inc., a broker-dealer registered with the Securities and Exchange Commission and a futures commission merchant licensed with the Commodity Futures Trading Commission). TradeStation Securities is a member of the Financial Industry Regulatory Authority, the National Futures Association, and a number of exchanges.
TradeStation Securities, Inc. and TradeStation Technologies, Inc. are each wholly owned subsidiaries of TradeStation Group, Inc., both operating, and providing products and services, under the TradeStation brand and trademark. When applying for, or purchasing, accounts, subscriptions, products and services, it is important that you know which company you will be dealing with. Visit www.TradeStation.com for further important information explaining what this means.

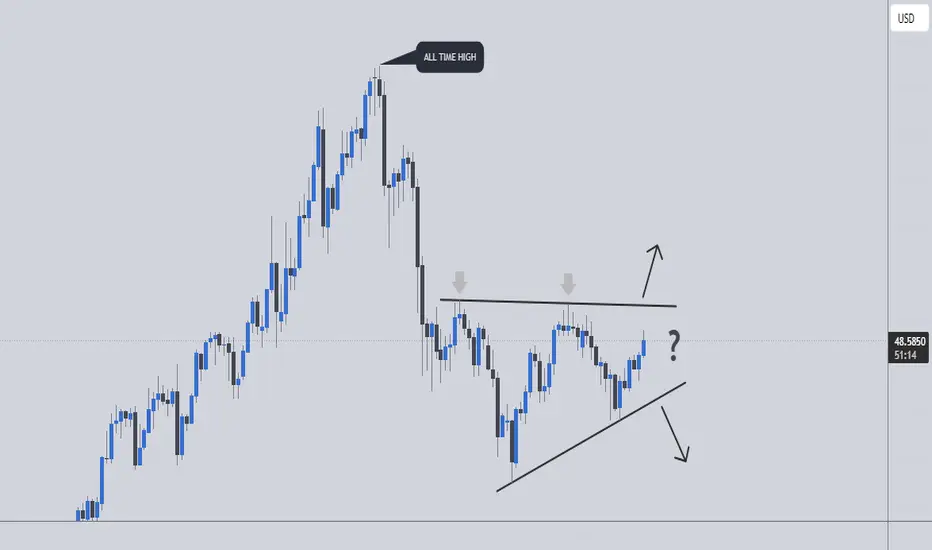
$XAGUSD $XAUUSDTech/AI falling, CRYPTOCAP:BTC sliding below 100k. Are safe haven plays coming back to life? TVC:SILVER completed the bearish head and shoulders pattern and consolidated while making a new bullish head and shoulders. Will it break the neck line soon and make new highs? or will it go down the drain along with other asset classes?

SilverXAGUSD
- Completed " 12345 " Impulsive Waves and " AB " Corrective Wave
- Break of Structure
- Fibonacci Level - 61.80% / 78.60%
- Ascending Triangle as an corrective pattern in Short Time Frame
- Order Block

XAGUSD analysis for todayXAG/USD – Silver Analysis
Silver is currently trading within a wide range between 49.00 and 46.00, showing clear consolidation after recent volatility. For price to break out of this range, it first needs to retest the 49.00 resistance zone, which has acted as a ceiling several times. From there, the market could seek liquidity to the downside, targeting the 47.8 area, a level that has already been tested multiple times and remains a key mid-range support.
My plan for today is to watch for price to approach the 49.00 resistance. If silver fails to break above this level, I’ll be looking for short opportunities, expecting a move back toward the middle of the range around 47.8–47.9.
This aligns with the current technical picture — a market stuck between strong supply and demand zones — waiting for a decisive breakout to define direction.
Summary:
📈 Resistance: 49.00
📉 Target: 47.8–47.9 (mid-range liquidity zone)
⚙️ Bias: Range-bound; bearish below 49.00
💡 Plan: Wait for rejection at resistance to look for shorts toward mid-range support

XAGUSD H4 | Heading Into Key ResistanceSilver (XAG/USD) is rising towards the sell entry, which is a pullback resitance and could drop from this level to the downside.
Sell entry is at 49.35, which is a pullback resitance.
Stop loss is at 50.47, which s a pullback resistance that aligns with the 138.2% Fibonacci extension.
Take profit is at 47.01, which is a pullback support.
Stratos Markets Limited (tradu.com ):
CFDs are complex instruments and come with a high risk of losing money rapidly due to leverage. 68% of retail investor accounts lose money when trading CFDs with this provider. You should consider whether you understand how CFDs work and whether you can afford to take the high risk of losing your money.
Stratos Europe Ltd (tradu.com ):
CFDs are complex instruments and come with a high risk of losing money rapidly due to leverage. 70% of retail investor accounts lose money when trading CFDs with this provider. You should consider whether you understand how CFDs work and whether you can afford to take the high risk of losing your money.

Silver - The catastrophic rejection!🆘Silver ( TVC:SILVER ) is just collapsing:
🔎Analysis summary:
At this exact moment, Silver is retesting the previous all time highs, which were already rejected about 45 years ago. Considering the extremely bearish rejection on the smaller timeframes, Silver simply fails to break out. This will lead to a devastating reversal.
📝Levels to watch:
$50
SwingTraderPhil
SwingTrading.Simplified. | Investing.Simplified. | #LONGTERMVISION

Silver.Silver.
No need to be greedy.
No need to try and catch a bottom.
If you want a $100 price, what you do need is patience.

XAGUSD H1 | Bullish Bounce off Key SupportThere is a temporary bullish confirmation on the H1 chart as we had 2 consecutive break of structures. Hence, our buy entry is at 48.02, which aligns with the H1 Fair Value Gap and 71% Fibonacci retracement.
The stop loss is at 47.61, which is a swing low support level, while the take profit is at 48.68, which is a swing high resistance level.
Stratos Markets Limited (tradu.com/uk ):
CFDs are complex instruments and come with a high risk of losing money rapidly due to leverage. 68% of retail investor accounts lose money when trading CFDs with this provider. You should consider whether you understand how CFDs work and whether you can afford to take the high risk of losing your money.
Stratos Europe Ltd (tradu.com/eu ):
CFDs are complex instruments and come with a high risk of losing money rapidly due to leverage. 70% of retail investor accounts lose money when trading CFDs with this provider. You should consider whether you understand how CFDs work and whether you can afford to take the high risk of losing your money.

A breakout looming for Silver?Will silver surge again? First; price would need to push through the resistance zone between 49.00 and 49.50 which was first created on the 23rd of October and revisited on the 31st before price pushed lower. If the resistance holds, we could see Silver sink lower for a deeper correction or go back into side-ways consolidation. A break above the zone on the other hand could signal a bull market and a possible retest of the All time high created on the 16th of October 2025.