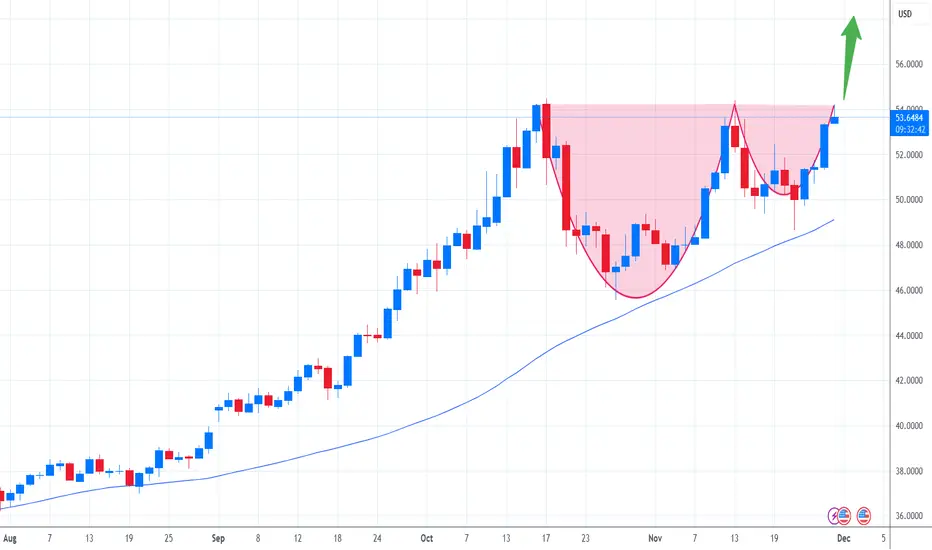
Silver Cup & Handle PatternWe had a very bullish push. Looking for a possible pullback and launch into the target #1 level.
Trade ideas
XAGUSD Short Setup — Rejection at Key Supply ZoneSilver (XAGUSD) has tapped into a higher-timeframe supply zone around the $58.50 – $58.80 area and showed clear signs of exhaustion. After sweeping the highs, price failed to continue upward and shifted into short-term bearish structure on the 15-minute chart.
📌 Entry: around $57.90 – $58.00
📌 Stop-loss: above the liquidity sweep / supply zone (~$58.70)
📌 Take-profit: toward $56.40 – $56.60 (previous demand + imbalance fill)
➕ Confluences
Liquidity grab above the previous high
Multiple rejection candles at supply
Loss of bullish momentum and break of structure (M15)
High risk-reward ratio on continuation to downside
⚠️ What invalidates the setup?
A decisive move above $58.70 with strong bullish volume would invalidate the short bias and open room for continuation toward $59.50+.

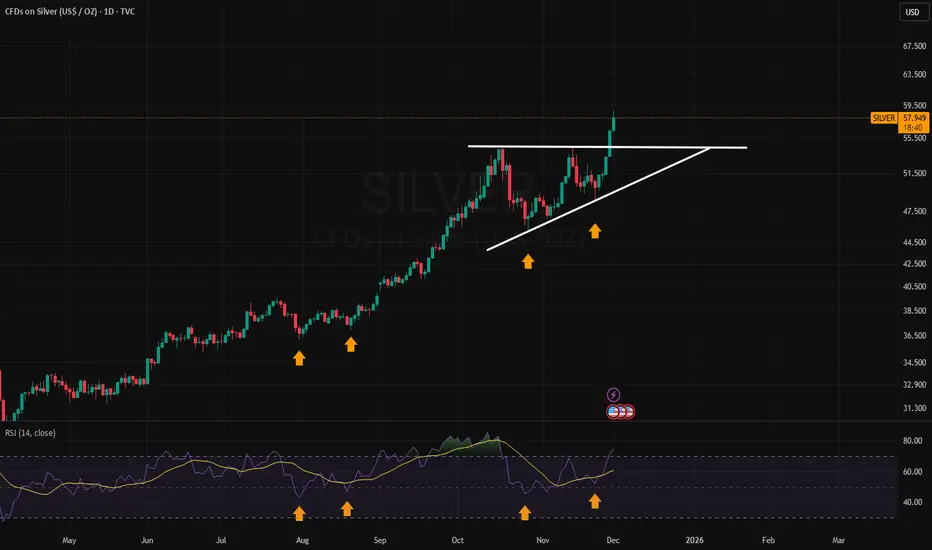
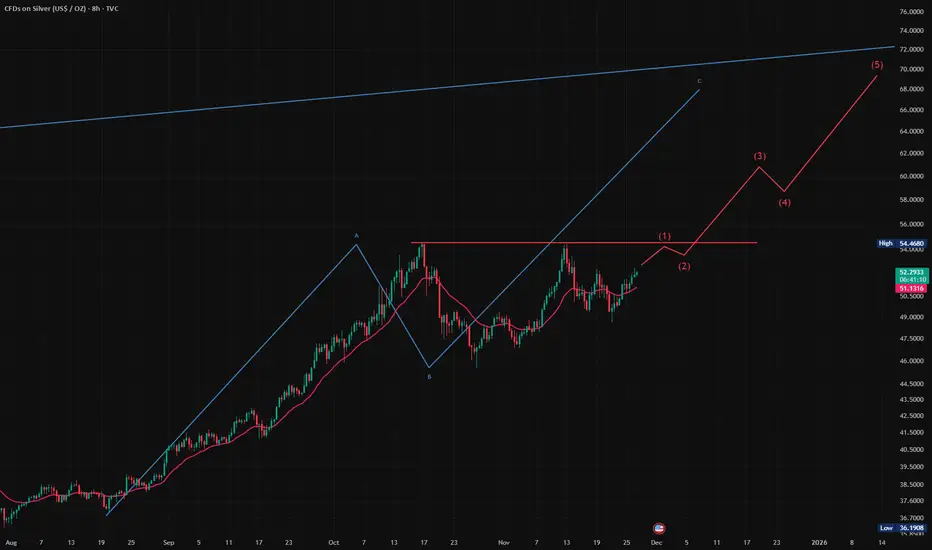
More follow through, bullishSilver has continued with strong follow through after breaking out of ascending triangle. This is bullish behavior. A retest of the $54.50 area is very plausible. Intraday high was $58.84, still under $60 which is a psycological area that likely will act as a magnet.
Silver’s Massive Cup & Handle Breakout After years of sideways frustration, silver is finally showing signs of life again. The metal has broken above the handle of a massive multi-decade Cup & Handle pattern, stretching all the way back to the 1980 peak and the subsequent 2011 high.
On the technical front, this breakout is textbook. The rounded base formed over several decades reflects deep accumulation and a structural bottom. The handle — which lasted more than a decade — represented the final phase of consolidation before a new bullish leg. Now that silver has cleared this resistance zone, momentum is building fast.
From a measured-move perspective, the breakout projects potential targets that could push silver into levels not seen in decades. Historically, patterns of this scale don’t play out overnight — they often unfold over several years — but they can define the next major trend.
Fundamentally, the story fits perfectly with the chart:
Global industrial demand for silver (especially from solar, EV, and tech sectors) is at record highs.
The supply deficit has widened for a third consecutive year.
And with central banks pivoting toward easier monetary policy, the environment for precious metals looks highly supportive.
Technically, the key zones to watch are:
Support: $32–34 — the breakout retest area (handle resistance now turned support).
Upside Targets: $50 (2020 high), followed by $75–80 on a long-term horizon if momentum persists.
Invalidation: A weekly close back below $30 would call the breakout into question.
The combination of bullish structure and macro tailwinds makes this one of the more compelling setups in the commodities space right now.

Silver: Massive Cup & Handle Signals End of CorrectionXAGUSD is presenting a classic Cup and Handle continuation pattern that suggests the recent corrective phase may be over.
My previous outlook anticipated a deeper retracement down to at least the $44 level. However, the emergence of a clear Cup and Handle formation on the higher timeframes has shifted my bias considerably.
On the 4-hour chart, we have now secured a candle close above the "handle". I am currently waiting for the next candle to confirm this breakout before validating the next leg up.
If we successfully brake the neckline around $54, my projected target is $62.50.

$XAG > $BTC? The 1980 "Curse" is Finally Broken.We just witnessed history. Stop scrolling and look at the chart.
For 45 years, the $50 level was the "Graveyard of Bulls."
1980: The Hunt Brothers cornered the market, peaked at $50, and crashed.
2011: The retail mania hit $49 and collapsed.
Today, that ceiling is gone. NASDAQ:XAG hasn't just "broken out"; it has shattered the most significant resistance level in modern financial history. We are trading at $58+, well into price discovery mode.
The "No-BS" Reality: While CRYPTOCAP:BTC is fighting for its life to hold support during this liquidity crunch, Silver has done what "Digital Gold" promised to do but couldn't.
CRYPTOCAP:BTC Status: Flushing leverage, correlating with tech stocks, and failing to act as a hedge.
NASDAQ:XAG Status: Breaking a 45-year suppression cycle to become the #1 performing asset.
The Setup (The Cup & Handle of the Century): This is a 45-year technical structure. The "Cup" started in 1980. The "Handle" ended this month.
The Breakout: $50 is now the floor, not the ceiling.
The Target: The measured move from the 1980 peak targets $85.89 - $89.15.
My Outlook: The "Gold 2.0" narrative is being tested in real-time.
Long NASDAQ:XAG : I am riding this breakout to the $89 target.
The "Re-test" Buy: If we dip back to $50 (the 1980 High), that is a generational buying opportunity. Old resistance must become new support.
Verdict: The "relic" just outperformed the "future." The 1980 curse is dead.
👇 Discussion: Is CRYPTOCAP:BTC failing its "Gold 2.0" audition, or is this just a temporary rotation before Crypto catches up to AMEX:SLV & AMEX:GLD Sectors ? Let me know your targets below.

XAGUSDThis chart and analysis are shared for educational purposes only.
Nothing here should be taken as financial advice.
Please conduct your own analysis before taking any buy or sell trades.

The Silver Era Has Begun – Major Breakout in Silver/SPX RatioThe long-awaited breakout in the Silver vs S&P 500 ratio is now confirmed.
The latest pullback validated the retest of the multi-year downtrend, and today’s move officially establishes a new bullish structural cycle.
Why This Matters
For the last 14 years, capital overwhelmingly favored the S&P 500 — the “fastest horse” in global markets.
The breakout in the Silver/SPX ratio signals the beginning of a capital rotation away from overvalued equities and back into real assets, especially industrial and monetary metals.
Macro Drivers Behind the New Silver Cycle
5 consecutive years of structural deficit – demand consistently outpacing supply.
Silver added to the U.S. critical minerals list.
Central banks quietly accumulating silver for the first time in decades.
LBMA inventories at historic lows, reducing available liquidity.
Mining supply is constrained, with silver mostly produced as a by-product.
Weakening Western currencies push capital into tangible assets.
Exploding industrial demand, especially from next-gen solar technologies (TOPCon/HJT).
A looming supply cliff – few new discoveries and long development timelines.
Growing middle class in India & SE Asia driving record demand for jewelry and investment.
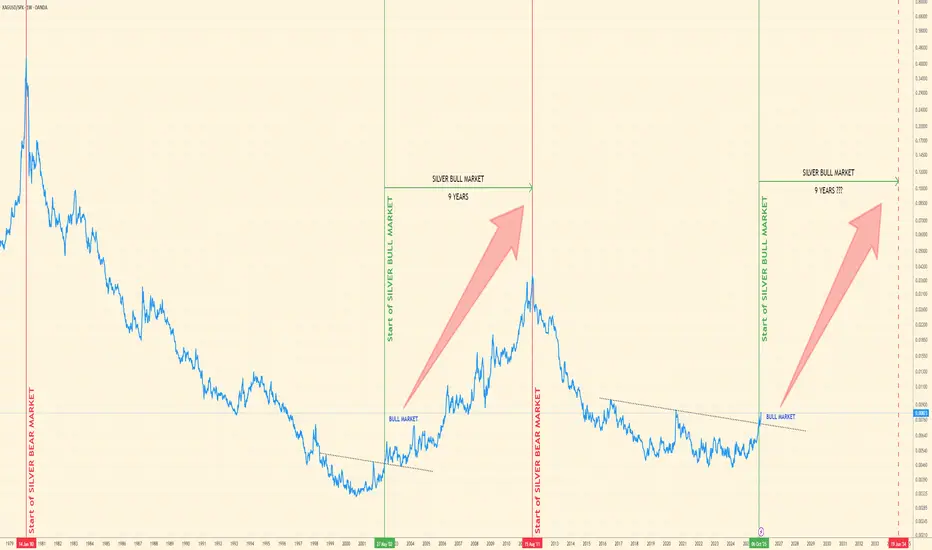
Cyclical Outlook
History suggests clear structural cycles:
Bear market: 1980–2002 (22 years)
Bull market: 2002–2011 (9 years)
In the last cycle, leading silver miners gained roughly 10x. Many miners already doubled from the 2022–2023 lows. If the pattern repeats, the current cycle (2025–2034?) could still deliver significant upside.
This cycle may even be faster and stronger, driven by exponential industrial demand and a fragile equity market dominated by a handful of megacap stocks.
Gold/Silver Ratio Signals Further Upside
Silver remains deeply undervalued relative to gold.
A move toward 62:1, and later 30:1, looks increasingly realistic based on technical structure.
Technical Setup – $62.66 First Target
On the 4H chart, silver has confirmed a Cup & Handle breakout, projecting a short-term target of $62.66 — likely just a waypoint on the path toward $100+ if the macro cycle unfolds as expected.
Conclusion
Silver is entering a new secular bull market supported by macro forces, tightening supply, and strong technical confirmation.
The coming years could be highly volatile, but extremely rewarding for holders of real assets.
This is not investment advice — always do your own research.
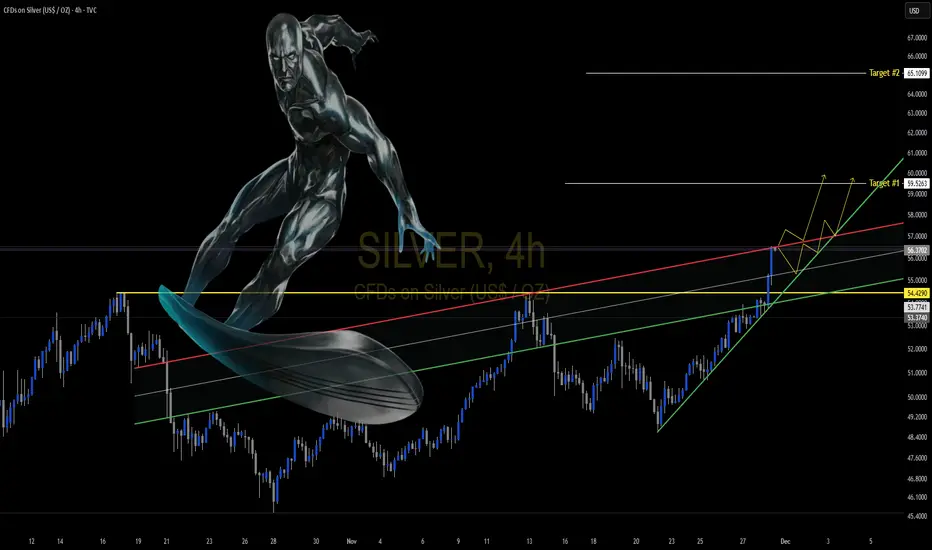
XAGUSD 4h
As the previous analysis, XAG broke the resistance area with a strong full body candle in 4h and hit ATH. we are in a bullish channel.

$65-70 likelyUnless the shenanigals at the CME manage to create a major dump this morning (After they closed the futures market overnight) then I see a major breakout coming! I see $65+ in a measured move ...if...they do not slam it this morning! I thinkg they are likely tring to organize a major short by the big boys...but lets see!

WOULD YOU TAKE THIS SHORT ON SILVER ? after a W shape the silveer will try to break this historical resistence aiming for a new all time highs , as the uncertainty in the crypto in obvious ; commodities will tend to compensate reatailers fears and take part of the market bull run

Silver Turning Positive – Breakout Ahead?Silver is gaining traction again as dollar weakness offers fresh support and buyers step back into the market. On the daily chart, the cup-and-handle formation is becoming more pronounced, and the current upward push raises the question of whether a clean breakout is finally underway. The key level to watch remains the USD 54.50 zone, as a decisive close above it could clear the path for a stronger bullish move.
A softer dollar environment continues to help, as it improves global purchasing power and often attracts fresh flows into precious metals. At the same time, improving inflation expectations keep silver relevant as a hedge, especially with investors preparing for potential policy shifts later in the year. The industrial side of the story also matters: demand from solar, electronics, and EV-related sectors remains strong, and any upbeat economic indicators could reinforce the case for higher prices. When equities trade in a risk-on mood, silver tends to benefit as part of the broader commodities cycle, and that dynamic is currently in play as well.
If the breakout fails, the tone could shift quickly. Weak economic data would raise concerns about industrial demand, while a rebound in the dollar or rising bond yields could cap momentum. These factors, combined with the possibility of profit taking after a solid run, might pull silver lower again. Still, as long as major support levels hold, the market keeps a constructive bias, and a confirmed breakout above 54.50 would likely be the trigger for the next strong leg higher.
XAGUSD_ 4h
Price is ranging near an important resistance area, Watch the market to see how price is going to react.

XAGUSD 4h
XAG started bullish movement, as we see there is a strong resistance area (red rectangle), price can react and drop from there or make a range and then start bullish to make an ATH again.
As we can see the beautiful reactions on Fibonacci levels with stronger buyers.
Price has touched the top resistance two times and made "Higher low" after second touch. (blue highlight dots)

#SILVER will likely reach $70 in the next few weeks/months.Bears have now failed twice to reverse the trend, this has now improved the odds for a bull flag continuation breakout.
Silver hit TP1 and BE closed the position — Entry 2Silver tapped straight into the key reaction zone and re-triggered the sell-stop setup exactly as expected. The precision of the move reinforces the bearish intent we were tracking, giving Entry 2 a clean structure and a justified re-engagement after the first trade closed at BE.
The primary target stays at 2R, but with the downside imbalance and broken demand levels lining up, this leg has room to stretch toward 4R+ if sellers keep driving the flow.
Technically, the rejection from the upper liquidity pocket is clear, followed by a rotation in structure that favors continued downside. Bullish momentum has stalled, and the candle sequence is showing steady, controlled selling pressure. Break-and-retest behavior across intraday timeframes continues to support the bearish continuation.
Managing the position is personal—locking in 2R is reasonable—but the chart is still offering an open lane for extended downside as long as order flow remains aligned.
Overall, Silver is giving a clean second short setup backed by a liquidity sweep, momentum shift, and strong confluence—solid conditions for those keeping the bearish bias alive.


XAGUSDHow to become successful in forex and stock trading: 1.Master fundamentals and technical analysis. 2,Build and follow a solid trading plan. 3.Apply strict risk management (1–2% rule). 4.Stay disciplined—control fear and greed. 5.Record and analyze every trade. 6.Focus on high-quality setups only. 7.Diversify across assets and markets. 8.Keep evolving—study, adapt, and grow daily.

Any guesses on Silver's next move? This is a coin flip at the moment.
This will resolve before the new year.
Get ready and act accordingly.
The yellow line below is a weekly and monthly gap. IF it breaks below, it could reach that $39 level and fill that gap before the next move higher.
However, it may not matter. It could easily blast higher (VERY SOON) to the measured $70-$80 range.
For now, just something to keep an eye on.

silver usdHI GUYS,
UPDATE ON SILVER
We have made an upgrade from H4, H6, H8 PATH to daily path.
in a few hours it will be Wednesday .
we sell as soon as situation presents itself.
we are to hold these entries for at least 2 weeks

XAGUSDMarket Structure
Silver recently broke out from a descending trendline, signaling a shift from short-term bearish momentum to a potential bullish reversal phase.
Price is currently around 51.49, forming a minor pullback after the breakout.

SILVER BEARS ARE STRONG HERE|SHORT
SILVER SIGNAL
Trade Direction: short
Entry Level: 4,992.1
Target Level: 4,536.3
Stop Loss: 5,296.0
RISK PROFILE
Risk level: medium
Suggested risk: 1%
Timeframe: 1D
Disclosure: I am part of Trade Nation's Influencer program and receive a monthly fee for using their TradingView charts in my analysis.
✅LIKE AND COMMENT MY IDEAS✅

Silver is in the Bullish directionHello Traders
In This Chart XAGUSD HOURLY Forex Forecast By FOREX PLANET
today XAGUSD analysis 👆
🟢This Chart includes_ (XAGUSD market update)
🟢What is The Next Opportunity on XAGUSD Market
🟢how to Enter to the Valid Entry With Assurance Profit
This CHART is For Trader's that Want to Improve Their Technical Analysis Skills and Their Trading By Understanding How To Analyze The Market Using Multiple Timeframes and Understanding The Bigger Picture on the Charts
