XAGUSDHow to become successful in forex and stock trading: 1.Master fundamentals and technical analysis. 2,Build and follow a solid trading plan. 3.Apply strict risk management (1–2% rule). 4.Stay disciplined—control fear and greed. 5.Record and analyze every trade. 6.Focus on high-quality setups only. 7.Diversify across assets and markets. 8.Keep evolving—study, adapt, and grow daily.
Trade ideas

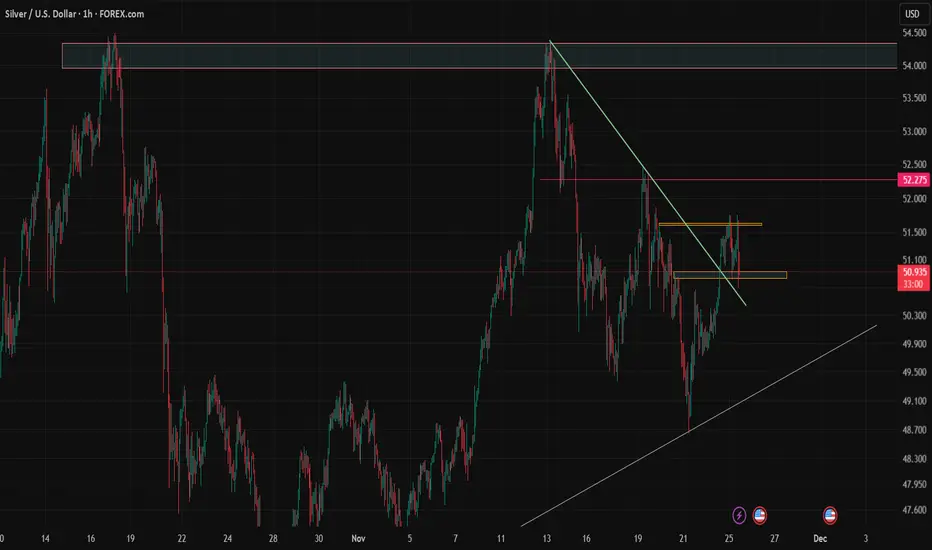
XAGUSD _1h
Price is still struggling to find its path, although it broke the resistance dynamic line, but we cant surly decide its way yet. Its ranging in 15 Min as below screenshot.
SILVERSilver may follow ABCD pattern and continue its downward trend towards its PRZ. Hopefully RSI divergence will be printed at PRZ as it is major support zone at 4H timeframe.
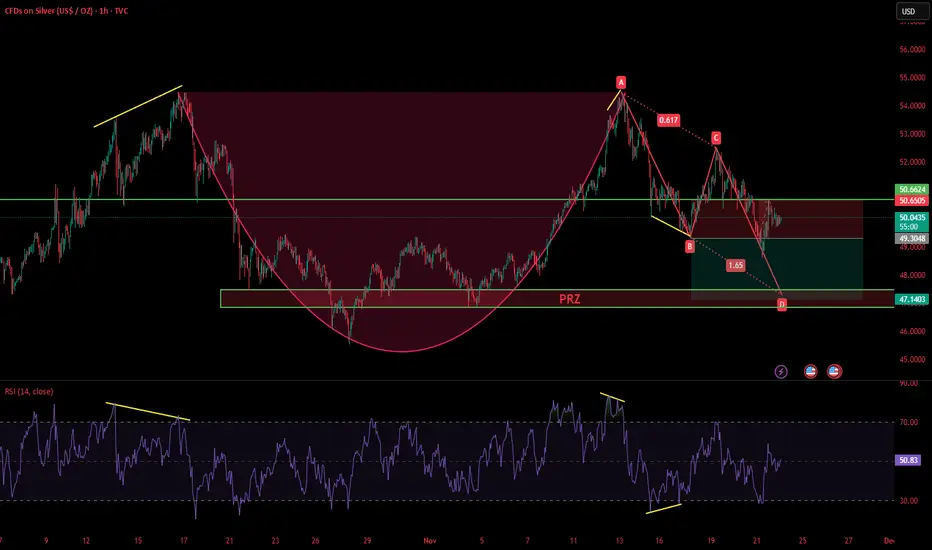
Silver - potential scenario Silver is in correction wave C, completing a flat pattern.
A confirmed close above 50.100 on Monday, November 24, 2025, suggests an upward move to a first target of 51.400, continuing to a final target of 53.300.
Stop-loss if the hourly close falls below 49.700.

XAGUSD Bullish ?The price action of XAG typically mirrors that of XAU. Please note that this trading setup is purely for reference. It is crucial to always perform independent research (DYOR) and apply sound risk management practices.

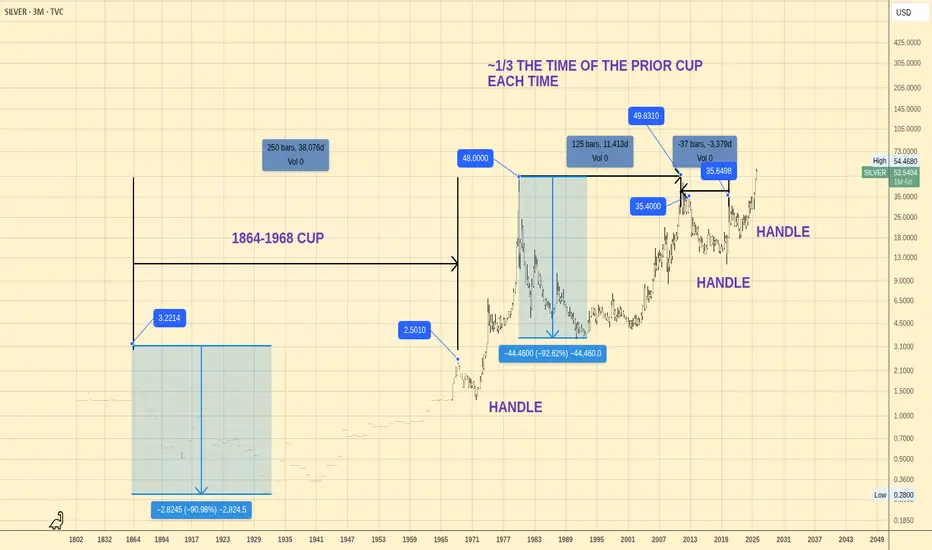
Silver Cup and Handle Formations With Time ApproximationGoing back to the origin of the data in the mid 1800s, Silver shows repeating and somewhat fractal cup and handle formations. If you look at the time to complete of these formations, you can see that each cup and handle takes 1/3 of the time to complete from the previous.
We are continuing to see this on the smaller timeframes. I assume these will cause Silver to go exponential in the short term which is likely happening now
Current pattern in formation
Silver hit TP1 and BE closed the position — Entry 2Silver tapped straight into the key reaction zone and re-triggered the sell-stop setup exactly as expected. The precision of the move reinforces the bearish intent we were tracking, giving Entry 2 a clean structure and a justified re-engagement after the first trade closed at BE.
The primary target stays at 2R, but with the downside imbalance and broken demand levels lining up, this leg has room to stretch toward 4R+ if sellers keep driving the flow.
Technically, the rejection from the upper liquidity pocket is clear, followed by a rotation in structure that favors continued downside. Bullish momentum has stalled, and the candle sequence is showing steady, controlled selling pressure. Break-and-retest behavior across intraday timeframes continues to support the bearish continuation.
Managing the position is personal—locking in 2R is reasonable—but the chart is still offering an open lane for extended downside as long as order flow remains aligned.
Overall, Silver is giving a clean second short setup backed by a liquidity sweep, momentum shift, and strong confluence—solid conditions for those keeping the bearish bias alive.


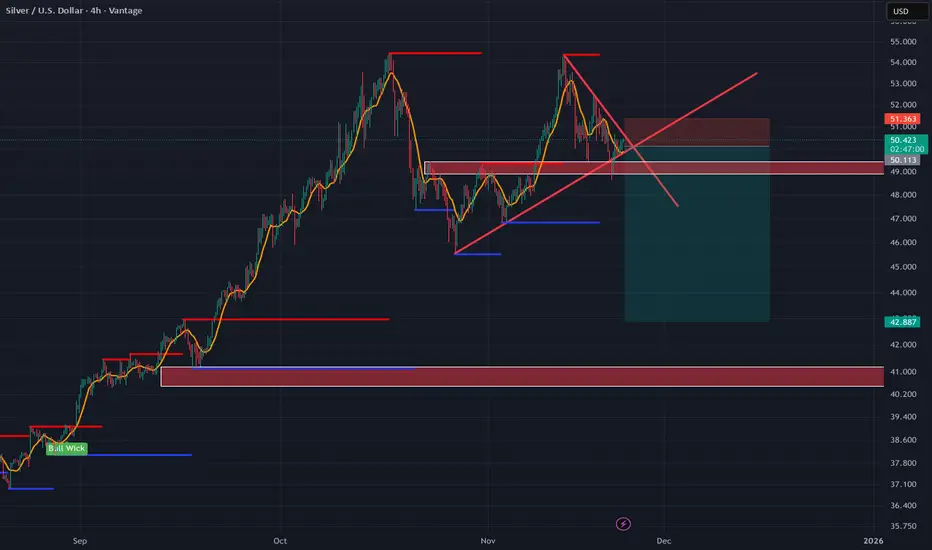
SILVER 4HSilver has entered a corrective channel after a strong bullish impulse.
Our plan is to wait for the price to retrace toward the channel’s lower boundary, where the 0.5 Fibonacci level aligns with the channel support.
If a valid bullish reaction forms in this area, we can look for a long entry.

silver usdHI GUYS,
UPDATE ON SILVER
We have made an upgrade from H4, H6, H8 PATH to daily path.
in a few hours it will be Wednesday .
we sell as soon as situation presents itself.
we are to hold these entries for at least 2 weeks

SILVER USDHI GUYS,
We are to hold our entries till wed.
however for those that didn't make entries last week we have a pull back this Mon
to complete the Head shoulder price pattern.
The yellow trend-line for sells is not active or accurate as we need to make it to (wed) and adjustments will be made

xagusd 20% retraceim very much with a bullish dollar into march if that scenario plays in favour all precious metal like gold which is hanging by a thread waiting to drop so will silver. like hsbc bank predicts 38-41
XAGUSD H1 | Bearish Reaction off Key SupportMomentum: Bearish
Price is currently below the ichimoku cloud.
Sell entry: 50.14
- Pullback resistance
- 38.2% Fib retracement
- Fair Value Gap
Stop Loss: 50.882
- Swing high resistance
Take Profit: 48.795
- Overlap support
High Risk Investment Warning
Stratos Markets Limited (tradu.com/uk ), Stratos Europe Ltd (tradu.com/eu ):
CFDs are complex instruments and come with a high risk of losing money rapidly due to leverage. 70% of retail investor accounts lose money when trading CFDs with this provider. You should consider whether you understand how CFDs work and whether you can afford to take the high risk of losing your money.
Stratos Global LLC (tradu.com/en ): Losses can exceed deposits.
Please be advised that the information presented on TradingView is provided to Tradu (‘Company’, ‘we’) by a third-party provider (‘TFA Global Pte Ltd’). Please be reminded that you are solely responsible for the trading decisions on your account. Any information and/or content is intended entirely for research, educational and informational purposes only and does not constitute investment or consultation advice or investment strategy. The information is not tailored to the investment needs of any specific person and therefore does not involve a consideration of any of the investment objectives, financial situation or needs of any viewer that may receive it. Past performance is not a reliable indicator of future results. Actual results may differ materially from those anticipated in forward-looking or past performance statements. We assume no liability as to the accuracy or completeness of any of the information and/or content provided herein and the Company cannot be held responsible for any omission, mistake nor for any loss or damage including without limitation to any loss of profit which may arise from reliance on any information supplied by TFA Global Pte Ltd.

Xagusd / Silver vs USD - an idea for a short uptrend buyXagusd / Silver vs USD - an idea for a short uptrend buy

XAGUSD Is it on the brink of a Bear Cycle?Silver (XAGUSD) has formed the same kind of 1W RSI peak pattern as the one that marked the August 2020 Top of the previous Bull Cycle.
The confirmation signal for the Top on that Bull Cycle following an impressive 4-month rally (similar to the July - September 2025 one), was the price breaking below the 1D MA50 (red trend-line).
When that took place, the price violently dropped to the 0.382 Fibonacci retracement level. As a result, if we get again a 1D MA50 break-out (which is being tested persistently and holding), we expect Silver to start a new Bear Cycle and quickly decline to 38.000 (Fib 0.382). On the longer term, we may even see a bottom as low as 30.500 (Fib 0.618) based on the July - October 2022 bottom formation of the previous Bear Cycle.
Perhaps the most optimal indicator to call the bottom, hence the most optimal long-term buy, is the 1W RSI getting oversold at 30.00 as it happened perfectly another 3 times in the past 7 years.
---
** Please LIKE 👍, FOLLOW ✅, SHARE 🙌 and COMMENT ✍ if you enjoy this idea! Also share your ideas and charts in the comments section below! This is best way to keep it relevant, support us, keep the content here free and allow the idea to reach as many people as possible. **
---
💸💸💸💸💸💸
👇 👇 👇 👇 👇 👇

XAGUSD Silver Outlook (Count 2)Here is my primary view on FX_IDC:XAGUSD . This is a slightly different count compared to my last outlook; however the ending goal is pretty much the same. I will work on a higher time frame outlook to show what structure exists above the weekly time frame.
In this outlook silver is currently close to working through a series of wave 4's and 5's. As I mention on the chart if the projected levels change but the sequence is accurate then I’ll be happy with that.
Having just looked at my monthly chart, it’s possible that this current impulsive wave sequence could extend the yellow wave (5) completion target up to around $87. If so, then I will have to go through the chart and change the wave degrees accordingly. As my yellow intermediate degree would become the cyan primary degree sitting under the purple cycle degree.
More comments on the chart.

Silver reaching significant support at 4845The Silver remains in a bullish trend, with recent price action showing signs of a corrective pullback within the broader uptrend.
Support Zone: 4845 – a key level from previous consolidation. Price is currently testing or approaching this level.
A bullish rebound from 4845 would confirm ongoing upside momentum, with potential targets at:
5033 – initial resistance
5108 – psychological and structural level
5214 – extended resistance on the longer-term chart
Bearish Scenario:
A confirmed break and daily close below 4845 would weaken the bullish outlook and suggest deeper downside risk toward:
4780 – minor support
4740 – stronger support and potential demand zone
Outlook:
Bullish bias remains intact while the Silver holds above 4845. A sustained break below this level could shift momentum to the downside in the short term.
This communication is for informational purposes only and should not be viewed as any form of recommendation as to a particular course of action or as investment advice. It is not intended as an offer or solicitation for the purchase or sale of any financial instrument or as an official confirmation of any transaction. Opinions, estimates and assumptions expressed herein are made as of the date of this communication and are subject to change without notice. This communication has been prepared based upon information, including market prices, data and other information, believed to be reliable; however, Trade Nation does not warrant its completeness or accuracy. All market prices and market data contained in or attached to this communication are indicative and subject to change without notice.

XAGUSD H1 | Bearish Reaction Off Pullback ResistanceMomentum: Bearish
Price is currently below the ichimoku cloud.
Sell entry: 57.933
- Strong pullback resistance
- 61.8% Fib retracement
- 100% Fib projection
- Fair Value Gap
Stop Loss: 58.903
- Swing high resistance
Take Profit: 56.729
- Swing low support
High Risk Investment Warning
Stratos Markets Limited (tradu.com/uk ), Stratos Europe Ltd (tradu.com/eu ):
CFDs are complex instruments and come with a high risk of losing money rapidly due to leverage. 70% of retail investor accounts lose money when trading CFDs with this provider. You should consider whether you understand how CFDs work and whether you can afford to take the high risk of losing your money.
Stratos Global LLC (tradu.com/en ): Losses can exceed deposits.
Please be advised that the information presented on TradingView is provided to Tradu (‘Company’, ‘we’) by a third-party provider (‘TFA Global Pte Ltd’). Please be reminded that you are solely responsible for the trading decisions on your account. Any information and/or content is intended entirely for research, educational and informational purposes only and does not constitute investment or consultation advice or investment strategy. The information is not tailored to the investment needs of any specific person and therefore does not involve a consideration of any of the investment objectives, financial situation or needs of any viewer that may receive it. Past performance is not a reliable indicator of future results. Actual results may differ materially from those anticipated in forward-looking or past performance statements. We assume no liability as to the accuracy or completeness of any of the information and/or content provided herein and the Company cannot be held responsible for any omission, mistake nor for any loss or damage including without limitation to any loss of profit which may arise from reliance on any information supplied by TFA Global Pte Ltd.

SILVER (XAGUSD): Consolidation & Trading Plan
Silver keep coiling within a narrow range on a daily.
Depending on the side of its breakout, I expect 2
potential scenarios.
If the market breaks and closes above 59.0 - the resistance
of the range, expect a bullish continuation to 60.0 level.
If the market breaks and closes below 56.2 - the support
of the range, expect a down movement to 54.5
Alternatively, keep trading the market within the range,
buying from the support and selling from the resistance.
❤️Please, support my work with like, thank you!❤️
I am part of Trade Nation's Influencer program and receive a monthly fee for using their TradingView charts in my analysis.


A lil bit of UJ analysisHere is a bit of UJ analysis for the purpose of educating on how price moves through the matrix.
I cover aspects of liquidity and efficiency.
I hope you find it useful.
- R2F Trading

Silver Might Be Accumulating Strength for the Next Leg UpAfter the massive 24% run from the late-November dip, silver is now consolidating between 56.40 and 59. The bullish rally's 41-degree-sloped trend has now broken and is currently being retested. This is not necessarily a bearish signal given the very steep slope and the 24% surge, but if silver manages to break out of the retest and clear the 59 resistance together, there is a chance for another leg higher.
The breakout above 50 was massive because that level has acted as resistance since the 1980s, and every time silver approached it in the past, it triggered months-long selloffs. Given that this is a historically key moment combined with favorable fundamentals, silver still has potential for more upside. However, a retreat below 56.40 could alter the short- to medium-term trajectory.
