Silver might continue after a record monthly gainSilver is likely to be 2025’s best performing major CFD after a series of short squeezes, record inflows to London and generally tightening supplies around the world. Monetary policy remains in focus, with the Fed very likely to cut on 10 December and most participants expecting two or three cuts in 2026.
The 261.8% monthly Fibonacci extension which coincides with the dynamic support of the 100 SMA is likely to be an important area in the event of a deep retracement. The main short-term supports are likely to be dynamic, the 20 and 50 SMAs.
Current strong overbought signals from Bollinger Bands and the slow stochastic might make it risky to buy in immediately. $60 as a round number is an obvious candidate for resistance; beyond this the 423.6% monthly Fibo around $63.15 is another. Given volumes for CFDs, spot deliverables and futures, gains are likely to continue overall but finding a good entry so close to the highs might be challenging.
For the latest analysis and opinions, visit the link on my profile to follow me on X too.
This is my personal opinion, not the opinion of Exness. This is not a recommendation to trade.
Trade ideas

Silver sideways consolidation capped at 5875 resistanceThe Silver remains in a bullish trend, with recent price action showing signs of a corrective pullback within the broader uptrend.
Support Zone: 5420 – a key level from previous consolidation. Price is currently testing or approaching this level.
A bullish rebound from 5420 would confirm ongoing upside momentum, with potential targets at:
5875 – initial resistance
6000 – psychological and structural level
6106 – extended resistance on the longer-term chart
Bearish Scenario:
A confirmed break and daily close below 5420 would weaken the bullish outlook and suggest deeper downside risk toward:
5350 – minor support
5275 – stronger support and potential demand zone
Outlook:
Bullish bias remains intact while the Silver holds above 5420. A sustained break below this level could shift momentum to the downside in the short term.
This communication is for informational purposes only and should not be viewed as any form of recommendation as to a particular course of action or as investment advice. It is not intended as an offer or solicitation for the purchase or sale of any financial instrument or as an official confirmation of any transaction. Opinions, estimates and assumptions expressed herein are made as of the date of this communication and are subject to change without notice. This communication has been prepared based upon information, including market prices, data and other information, believed to be reliable; however, Trade Nation does not warrant its completeness or accuracy. All market prices and market data contained in or attached to this communication are indicative and subject to change without notice.

XAGUSD H1 | Bearish Reaction Off Pullback ResistanceMomentum: Bearish
Price is currently below the ichimoku cloud.
Sell entry: 57.933
- Strong pullback resistance
- 61.8% Fib retracement
- 100% Fib projection
- Fair Value Gap
Stop Loss: 58.903
- Swing high resistance
Take Profit: 56.729
- Swing low support
High Risk Investment Warning
Stratos Markets Limited (tradu.com/uk ), Stratos Europe Ltd (tradu.com/eu ):
CFDs are complex instruments and come with a high risk of losing money rapidly due to leverage. 70% of retail investor accounts lose money when trading CFDs with this provider. You should consider whether you understand how CFDs work and whether you can afford to take the high risk of losing your money.
Stratos Global LLC (tradu.com/en ): Losses can exceed deposits.
Please be advised that the information presented on TradingView is provided to Tradu (‘Company’, ‘we’) by a third-party provider (‘TFA Global Pte Ltd’). Please be reminded that you are solely responsible for the trading decisions on your account. Any information and/or content is intended entirely for research, educational and informational purposes only and does not constitute investment or consultation advice or investment strategy. The information is not tailored to the investment needs of any specific person and therefore does not involve a consideration of any of the investment objectives, financial situation or needs of any viewer that may receive it. Past performance is not a reliable indicator of future results. Actual results may differ materially from those anticipated in forward-looking or past performance statements. We assume no liability as to the accuracy or completeness of any of the information and/or content provided herein and the Company cannot be held responsible for any omission, mistake nor for any loss or damage including without limitation to any loss of profit which may arise from reliance on any information supplied by TFA Global Pte Ltd.

Silver’s 220% Rally: Still Worth Buying Now?Many have recommended investing in silver in recent years. I wasn’t a strong believer, but seeing its 220% growth — even outperforming gold — is impressive. For new investors, silver carries high risk at current levels. In my view, $50 would be a much more attractive entry price

XAGUSD H121. Market Structure
Price is in a strong bullish trend, making higher highs and higher lows.
The most recent impulsive leg broke above the 57.00 – 57.40 resistance zone and is now pulling back.
The current correction is normal within an uptrend and looks like a bullish flag / shallow retracement.
2. Key Levels
Support Zones
57.00 – 56.70 → Immediate support (previous resistance turned support)
54.50 – 55.00 → Stronger support zone if deeper pullback happens
51.00 – 52.00 → Major demand zone (unlikely to be retested unless momentum collapses)
Resistance
60.75 – 61.00 → Major target / next resistance
3. Price Action Signals
After a strong impulsive rally, last two candles show short-term profit-taking.
The market is still holding above structure; no sign of trend reversal yet.
If price retests 56.70 – 57.00 and prints bullish rejection wicks or engulfing, it becomes a high-probability long setup.
4. Projection
Your chart already shows the ideal scenario, and it aligns with the structure:
Bullish Scenario (Higher Probability)
Pullback → Stabilization at 56.70 – 57.00
Bullish continuation → Target 60.75
Break above 60.75 opens extension toward 62.00
Bearish Scenario (Lower Probability)
Break below 56.70 → Deeper correction toward 55.00
This level should act as strong support for buyers to step in.

XAGUSD Impulsive Rally Points Toward Higher ExtensionThe rally in Silver from the 28 October low continues to unfold as a five‑wave impulse, though the structure remains incomplete. From that low, wave 1 advanced to 54.39, followed by a corrective pullback in wave 2 that concluded at 48.6. The metal then resumed its upward trajectory in wave 3, which itself subdivides into another five‑wave sequence of lesser degree. From the termination of wave 2, wave ((i)) reached 53.85, while the subsequent pullback in wave ((ii)) settled at 52.86.
Momentum strengthened as wave ((iii)) extended to 58.84, before wave ((iv)) corrected modestly to 56.55. The market should now push higher in wave ((v)), thereby completing the larger wave 3. The potential termination zone for wave 3 aligns with the 100% to 161.8% Fibonacci extension of wave 1, calculated at 57.8 to 63.4. This region has already been tested, suggesting that the cycle is mature and wave 3 may be approaching completion.
Once wave 3 concludes, a corrective phase in wave 4 should emerge, retracing the cycle from the 21 November low before the broader trend resumes upward. In the near term, as long as the pivotal support at 48.64 remains intact, pullbacks should attract buyers. These retracements may unfold in sequences of three, seven, or eleven swings, providing opportunities for renewed upside participation.

silverMy prediction for silver. The final ceiling based on its alignment with the US balance sheet and past periods.

Silver (XAG/USD) - Breakout SetupPrice is approaching a key resistance level. I expect a short consolidation under the zone, followed by a breakout and continuation of the upward movement.
A Buy Stop order above the resistance allows entering only after confirmation of bullish strength.
If the price gives a retest after the breakout - even better for additional entries.
Market structure remains bullish, and the scenario stays valid as long as price holds above the local higher lows.

Silver = to the moon??? September 03, 2025Who’s Loading Up:
A top dog at Pan American Silver Corp., a heavyweight in North American silver digs, just scooped up a hefty chunk of shares.
Deal Size: This exec grabbed 50,000 shares at $22.50 a pop on August 28, 2025, dropping $1.125 million—talk about putting skin in the game!
Company Lowdown
Pan American Silver Corp. runs 10 mines across the Americas, packing 468 million ounces of silver and 6.7 million ounces of gold. Based out of Vancouver, they’ve got cash flowing like a river, fueling big bets like La Colorada Skarn and Escobal.
Sector Vibes:
• The Silver Institute’s calling for a fifth straight supply crunch in 2025, with photovoltaics and AI tech demand hitting all-time highs.
• Tariff threats, green energy boom, and a possible Fed rate cut in September 2025 could send silver soaring.
Big Funds Jumping In
Last quarter (June–August 2025), heavy hitters like Sprott Asset Management (+8% in Pan American), BlackRock Inc. (+5% in iShares Silver Trust), and Invesco Ltd. (+6% in VanEck Silver Miners ETF) piled into silver.
Buzz on X says Saudi Central Bank’s dipping its toes into silver via iShares Silver Trust (SLV), ditching its gold-only playbook.
London Vaults Drying Up
The LBMA’s silver stash is under siege from a supply deficit. With 150 million ounces short in 2024, the Silver Institute hints reserves might shrink 5–10% yearly if demand keeps raging, setting the stage for a price explosion.
1979 Boom & 2025–2026 Wild Cards
1979 Flashback: The Hunt Brothers’ silver grab, plus inflation and oil chaos, rocketed silver from $6 to $50/oz (+700%). Gold jumped from $300 to $850/oz on similar vibes.
2025–2026 Triggers:
Inflation’s sticky above 3%, the USD’s wobbling from tariffs, and a Fed cut looms in September 2025. Watch for U.S.-China trade wars, Middle East flare-ups, or a BRICS metals exchange—any could ignite a 1979-style silver rocket if deficits worsen.
Price Targets:
Short-Term (3 months): $60.00 (+46.9%)
Mid-Term (6–12 months): $120.00 (+193.7%)
Long-Term (18–24 months): $240.00 (+487.5%)
🤔🤔🤔🤔🤔🤔🤔🤔

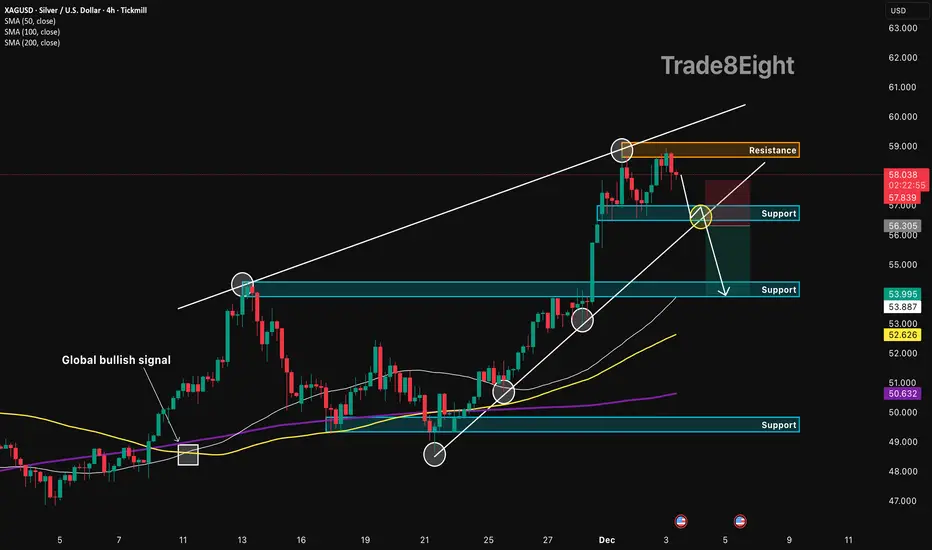
XAGUSD: reversal from resistance🛠 Technical Analysis: On the 4-hour timeframe, silver (XAGUSD) rebounded from the important resistance level of 59.00, signaling a potential bearish reversal. Currently, the price is likely to test the nearest support at 56.30, a confirmed break of which would provide a potential sell entry. The trading setup suggests a correction toward the demand zone at 54.00, which coincides with the support area marked on the chart.
❗️ Trade Parameters (SELL) ❗️
➡️ Entry Point: Sell on breakdown of support (approx. 56.30)
🎯 Take Profit: 53.90 – 54.00 (Support Zone)
🔴 Stop Loss: Above local resistance structure (approx. 57.85)
⚠️ Disclaimer: This is a potential trade idea based on current analysis; market conditions and price direction are subject to change based on news factors and volatility.
Silver : New Safe Heaven : According to me. No Major Sellers are available to sell silver.
It is growing like silver shine..
Ideal entry to buy 55
Sl 52
Target 63.
Logic : Ascending triangle with it's pending movement.
I have extended triangle's length to upward after breakout.
Manage your risk

XAGUSD 4h
Silver has formed a cup pattern, potentially it can move upward approximately equal to dept of the cup.
Blue line and the Purple lines are the resistance lines.
We will be seeing higher prices based on weekly and monthly candle analysis.
Stay Tuned for our next update.

XAGUSD 4h
XAG started a strong movement now we are in the middle of the wave and sellers are in competition with buyers. we are excepting that the price at least touch the top of the Chanelle.
Below is support line in smaller timeframe in case some one missed the opportunity from our last analysis.
Stay tuned for next updates!

XAGUSD - Signal#XAGUSD - Signal
H4 - Formation of the 3rd wave + trendline breakout. Stop loss beyond the high of the 1st wave.
Entry: 56.52040
TP: 54.95818 - 53.76428 - 52.54498 - 49.38243
Stop: 58.85736

XAG/USD 2H: High-Probability Sell Entry at Drop-Base-Rally (BRD)📈 XAG/USD 2H: High-Probability Long Entry at Drop-Base-Rally (DBR) Demand Zone
📝 Market Context: Bullish Trend and Retracement
The overall trend for Silver (XAG/USD) is strongly bullish, driven by fundamental factors like tight physical supply and expectations of future US interest rate cuts. The chart shows price has been moving sharply higher, but has recently experienced a significant and necessary pullback from its high. This pullback is being treated as a correction to gather new demand before continuing the primary upward trend toward potential targets like $60 - $65 per ounce.
The current price action has approached a critical area that served as the launchpad for the prior bullish impulse.
🔑 Technical Focus: Unmitigated Demand and Entry Confirmation
The analysis highlights two key zones: a high-quality Demand Zone and the last area of consolidation before the final breakout.
1. Drop-Base-Rally (DBR) Demand Zone 🟢
Zone Location: The green shaded box, spanning approximately $54.00 to $54.50.
Significance : This area is identified as a fresh Demand Zone. It conforms to the Drop-Base-Rally (DBR) structure, where an initial drop was followed by a period of consolidation (the Base), before buyers aggressively took control, leading to the strong rally (the Rally). This zone is considered a Reversal Zone where institutional buy orders are expected to remain unmitigated.
Action Plan: This is the high-probability area to initiate a long (buy) position, anticipating a strong rebound.
2. Liquidity & Stop-Loss Target (Bottom Green Zone)
Zone Location: The lower green box, around $53.50 to $53.80.
Significance : This zone may represent the ultimate base of the prior move. The price of Silver is known for high volatility. Placing the Stop Loss (S/L) safely below this zone (e.g., below $53.50) is crucial to protect the trade from a potential "liquidity sweep" or deeper structural break, providing a healthy buffer.
📊 Trade Plan: Sell the Dip
Trade Direction: Short (SELL)
Entry Strategy: Wait for price to enter the DBR Demand Zone (around $54.00 - $54.50). Confirmation is highly recommended, such as monitoring for a clear bullish reversal pattern (like an engulfing candle or a double bottom) on a lower timeframe (e.g., 30M or 1H) before entry.
Stop Loss (S/L): Place S/L below the entire demand structure, for example, below $53.50.
Take Profit (T/P) 1: The first target is the level of the most recent high that initiated the current drop (a retest of the supply that caused the current pullback).
Take Profit (T/P) 2: A higher-level target is the prior swing high at $56.00, or pushing towards the psychological $60 per ounce level, which is a common projection based on current market dynamics.
⚠️ Risk and Fundamental Caveats
While the technical setup is strong, Silver is highly volatile. Traders must closely monitor upcoming US economic data, as stronger-than-expected US reports could delay expected Fed rate cuts and put temporary downward pressure on non-yielding assets like Silver.
Invalidation: A decisive close below the Stop Loss area (below $53.50) would invalidate this long trade idea, signaling a deeper correction or a structural shift.


Silver prices surge due to the supply tightnessSilver briefly hit another record high at 78, then stabilized at above 57 due to the concern over the lack of supply in LME and SHFE. Meanwhile, demand from not only Solar PV but also EV and data center continues to surge, putting more pressure on the storage.
Meanwhile, China’s silver exports hit a record 660 tons in Oct, underscoring strong demand amid tightening global supply.
However, the gold/silver ratio fell to 74, near the average 25-year of 69, which could limit the rally.
XAGUSD rebounded from EMA21 and formed higher swings within the ascending channel. Diverging bullish EMAs reinforce its uptrend.
A break above the channel’s upper bound near 60.00 could prompt a rally toward the potential resistance at 63.00.
By Van Ha Trinh - Financial Market Strategis at Exness

Major $XAG Cup & Handle Continues to play outSilver really has been the commodity of choice the last month or so. The move north has gone parabolic. We looked at silver a few weeks back when it (and #XAU) printed Weekly double tops. Well, that clearly failed! Their price failed to fall lower before rocketing back north.
Of course we're hearing all sorts of tales about manipulation and institutions/banks/families being on the wrong side on this strong move north. This was heightened by the conspiracy tales flying around the outage at the CME last Friday.
Whilst that might all make for good tales and gossip ultimately we're only interested if it offers us an opportunity. Certainly on the longer timeframes there's not really anything to reverse the present climb. My only caveat is that whenever price goes vertical it can rarely maintain that. So watch this space!

NOV.30,2025 GOLD & SILVER ANALYSISGold and Silver are both looking bullish on the weekly and monthly charts suggesting further upside is still intact. Although on these same timeframes, the price action is very extended outside their standard Bollinger bands and KC bands. Hence this level is not great for long entries as the risk to reward is not attractive to me.
There are some divergences on the daily charts too but these are still active and not confirmed. So as cautioned in the video, in both scenarios it is best to wait for confirmation for Bullish continuation or Bearish correction from these levels.
This is my perception on the commodities of Gold and Silver.
Thank you for supporting my publications and I wish you the best of trades as we begin the month of December.

Silver ATH scenariosI asked ChatGPT for conspiracy theories regarding silver EW and the CME shutdown.
Here’s a clean optionality framework for the six scenarios — three “up-side” conspiracies and three “down-side” (ABC) ones — expressed in terms of payoff profile, path-dependency, and risk symmetry.
UP-SCENARIOS (continuation)
1. Suppressed breakout — moderate convexity. Price grinds upward toward $58–59; dips are shallow but present. Payoff is positive but not explosive; theta decay matters if positioned via options. Works best with slightly OTM calls or call spreads. Risk: a failed retest pulls you back into the ABC path.
2. Failed suppression / trapped shorts — high convexity. A forced cover ignites a steep, fast rally ($60–61). Delta accelerates quickly; path is momentum-driven. ATM or slightly OTM calls gain sharply; put-side optionality decays fast. Risk: squeeze fizzles if liquidity returns smoother than expected.
3. Liquidity-vacuum slingshot — maximum convexity; fat right tail. True impulsive iii-of-3 behavior toward ~$64. Small spot moves generate outsized option re-pricings (vega + gamma expansion). Deep OTM calls become viable. Risk: extremely binary — if invalidated, collapses straight into ABC territory.
DOWN-SCENARIOS (ABC correction)
4. Engineered blowoff top — clean mean-reversion; moderate convexity. Quick A-leg unwinds toward ~$54.0. Best expressed with ATM/OTM puts or put diagonals. Risk: B-wave fakeouts create short-term drag.
5. Trap-and-flush — largest left-tail convexity. Violent and extended ABC toward $52.7. Gamma positive for puts; skew steepens favorably. This is the highest payoff per unit risk for downside optionality. Risk: a stronger B-wave bounce can briefly stress positions before C unfolds.
6. Algo-misfire → fair-value reversion — measured downside; low-to-moderate convexity. The revert-to-trendline move (~$53.5) is smoother, slower, and less explosive. Vertical put spreads outperform naked options. Risk: continuation invalidates the correction faster than expected.
Combined optionality view
The highest convexity sits in Scenario 3 (slingshot) and Scenario 5 (trap-and-flush). The lowest convexity are Scenarios 1 and 6. Structurally, given the ATH was printed during impaired liquidity, the down-side scenarios offer cleaner, more stable optionality, while the up-side tails require aggressive follow-through to stay alive.

Silver XAGUSD 6month chart
If silver closes above the level of $37.31800 at the end of the current December, it will continue its upward movement. However, it will be a high-risk trade. You will make profits, but make sure to take your profits step by step, as silver is currently trading above the 70 RSI level.
Good luck 4all

Perfect Cup and handle Pretty self explanatory here perfect cup and handle on Silver. Very Bullish
Happy Hunting - ND

XAGUSD Update !Silver just printed a new ath! this is the next movement scenario.Please remember this is just my perspective , please trade according to your own analysis, and use good management!
