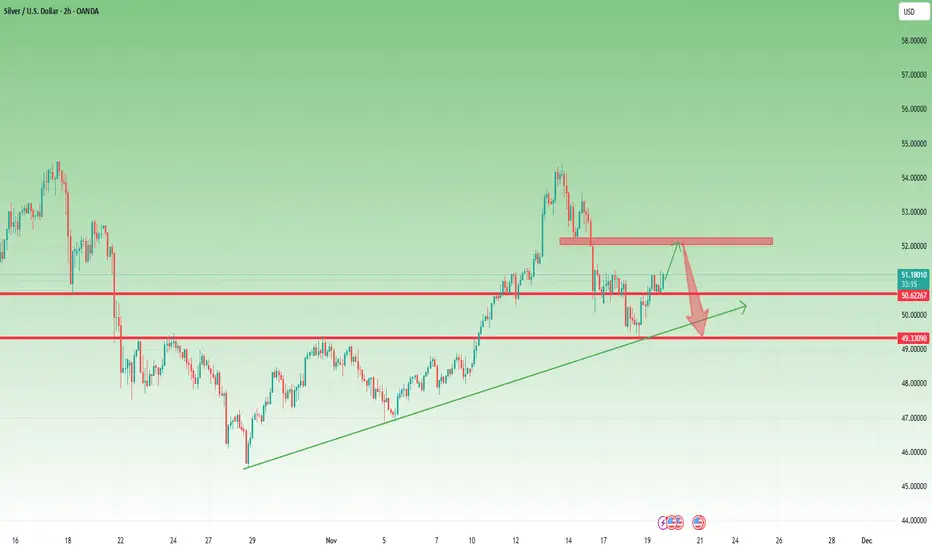
New Leg Up Possible, Yet I Expect Another Decline Toward 491. What Happened Since Yesterday
In yesterday’s analysis, I highlighted the possibility of a rebound from the confluence support and mentioned that Silver could rise toward the 50.50 resistance.
Not only did Silver reach that target — it broke above it, and the price is now trading above 51.00.
The bullish momentum was stronger than expected, confirming buyers stepped in aggressively from support.
2. Current Market Context
With price holding above 51, the short-term chart structure is slightly bullish, and a new leg up is possible in the immediate term.
However, despite this strength, I believe the overall correction is not yet complete. Silver has a habit of producing sharp counter-trend moves before continuing the broader direction.
3. Technical Outlook
Key levels to monitor:
Resistance:
- 52.00 – major short-term barrier; ideal area to search for shorts
- 50.50 – intraday resistance turned support
Support / Downside target:
- 49.00 – the next major support and my preferred downside target
Until Silver breaks and holds above 52, upside continuation remains limited in my view.
4. Trading Plan
My plan is straightforward:
If price reaches the 52 zone, I will look for short entries.
Downside target is 49.
I will reassess the bias only if Silver starts to stabilize well above 52, which would shift the structure back to bullish.
5. Conclusion
Silver exceeded expectations on the rebound, but the larger corrective structure appears intact.
Short-term upside is possible, yet I still expect another leg down, with 49 as the main target.
Trade ideas
SILVER (XAGUSD): Bullish Continuation After Pullback
There is a high chance that Silver will go up from the underlined support.
A bullish breakout if a neckline of an inverted head & shoulders pattern
provides a strong confirmation.
Expect a rise to 53.2 level.
❤️Please, support my work with like, thank you!❤️
I am part of Trade Nation's Influencer program and receive a monthly fee for using their TradingView charts in my analysis.

SILVER USDHI GUYS,
UPDATE
SILVER made it to take profit zone . a delay on today has changed the sell structure .
sells, soon. keep your eyes open

XAGUSD Pyramid set upXAGUSD Pyramid set up
1. Profit booking done at the resistance level (ATH levels)
2. Price showing strength from discounted levels
3. pattern Cup & Handle

XAGUSD H1 | Bearish Reaction off Key ResistanceMomentum: Bearish
Price is currently below the ichimoku cloud.
Sell entry: 51.30
- Strong overlap resistance
- 38.2% Fib retracement
Stop Loss: 52.077
- Pullback resistance
- 50% Fib retracement
Take Profit: 50.097
- Strong overlap support
High Risk Investment Warning
Stratos Markets Limited (tradu.com/uk ), Stratos Europe Ltd (tradu.com/eu ):
CFDs are complex instruments and come with a high risk of losing money rapidly due to leverage. 70% of retail investor accounts lose money when trading CFDs with this provider. You should consider whether you understand how CFDs work and whether you can afford to take the high risk of losing your money.
Stratos Global LLC (tradu.com/en ): Losses can exceed deposits.
Please be advised that the information presented on TradingView is provided to Tradu (‘Company’, ‘we’) by a third-party provider (‘TFA Global Pte Ltd’). Please be reminded that you are solely responsible for the trading decisions on your account. Any information and/or content is intended entirely for research, educational and informational purposes only and does not constitute investment or consultation advice or investment strategy. The information is not tailored to the investment needs of any specific person and therefore does not involve a consideration of any of the investment objectives, financial situation or needs of any viewer that may receive it. Past performance is not a reliable indicator of future results. Actual results may differ materially from those anticipated in forward-looking or past performance statements. We assume no liability as to the accuracy or completeness of any of the information and/or content provided herein and the Company cannot be held responsible for any omission, mistake nor for any loss or damage including without limitation to any loss of profit which may arise from reliance on any information supplied by TFA Global Pte Ltd.

Silver in Wave 2 of 1- bigging of a correction
- possible target $30
Looking at the larger picture, Silver has completed 5 waves for C from 2022

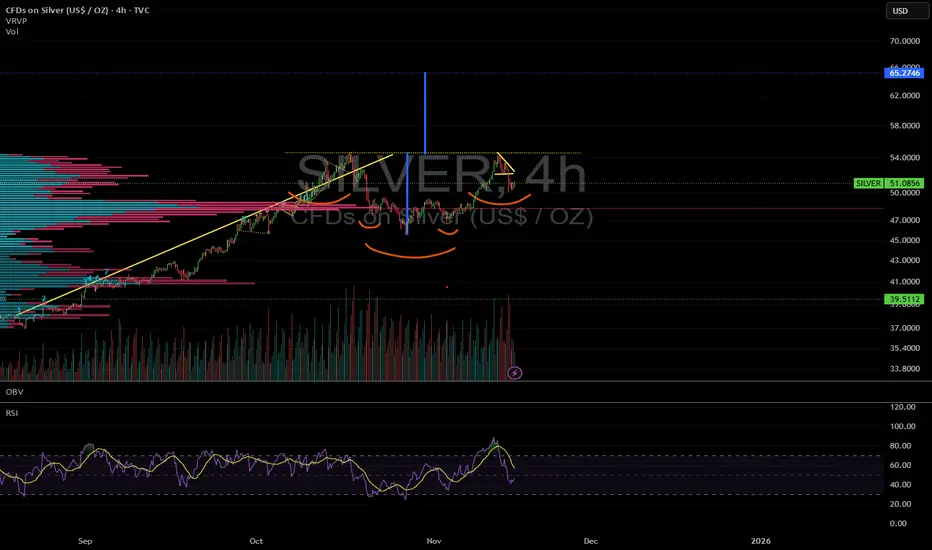
SILVER TO 65 $ ?Silver is undergoing a consolidation in the 47 to 54 $ range recently.
There is an inverse Head and Shoulders pattern forming right now.
The implied price objective of 65 $
At a time where many (even smart) invesors are waiting for a dip down to 40 (and even 30) $ could that be the surprise that hot assets offer in a raging bull market ?
The pattern is there ! Will it play out ?
I am positioned.
Silver - 61.8% retracement of a 5 wave decline - sellSilver had a 5 wave decline from the recent top
That has been followed by a 61.8% retracement
Good risk reward on shorts here. Manage SL

SILVER 4H Cup & Handle — High Probability Long OpportunityHey Traders,
#Silver is shaping up for a high-probability long-term bullish move, and the chart is giving us some very clean signals right now.
Why I’m Bullish on #SILVER
Strong Range Accumulation: Price has been consolidating in a healthy accumulation range — ideal for long-term buyers.
4H Cup & Handle Pattern: A classic bullish continuation pattern is forming beautifully on the 4-hour timeframe.
Trendline Respect: #Silver recently touched and respected the ascending trendline, indicating buyers are still in control.
No Bearish Signs: Momentum, structure, and volume — all showing strength. No major bearish signals visible.
Trade Plan
I’m planning 2 Long Entries:
Entry #1: At the current market price (CMP) — early position before breakout.
Entry #2: On the breakout + retest of the Cup and Handle pattern — confirmation entry.
Targets (Short-Term & Mid-Term)
I’ll share detailed targets and SL levels in the chart.
All trades will be taken with strict risk management to protect capital.
Potential for an Explosive Move
Cup & Handle breakouts on 4H charts historically produce strong follow-through. If we break above the neckline with volume, #SILVER could be ready for a significant rally.
What do you think about the #SILVER setup?
Drop your analysis below — agree or disagree? Let’s discuss!
If you found this helpful, don’t forget to LIKE, COMMENT, and FOLLOW for more high-probability setups!
#SILVER #XAGUSD #Commodities #TradingAnalysis #PriceAction #CupAndHandle #BreakoutTrading #ForexTrader #MetalMarkets #Trendline #LongSetup #4HAnalysis #SwingTrading #SmartMoney #TechnicalAnalysis #TradingView

SILVER Will Go Down From Resistance! Short!
Take a look at our analysis for SILVER.
Time Frame: 1D
Current Trend: Bearish
Sentiment: Overbought (based on 7-period RSI)
Forecast: Bearish
The market is approaching a key horizontal level 5,142.9.
Considering the today's price action, probabilities will be high to see a movement to 4,723.3.
P.S
The term oversold refers to a condition where an asset has traded lower in price and has the potential for a price bounce.
Overbought refers to market scenarios where the instrument is traded considerably higher than its fair value. Overvaluation is caused by market sentiments when there is positive news.
Like and subscribe and comment my ideas if you enjoy them!

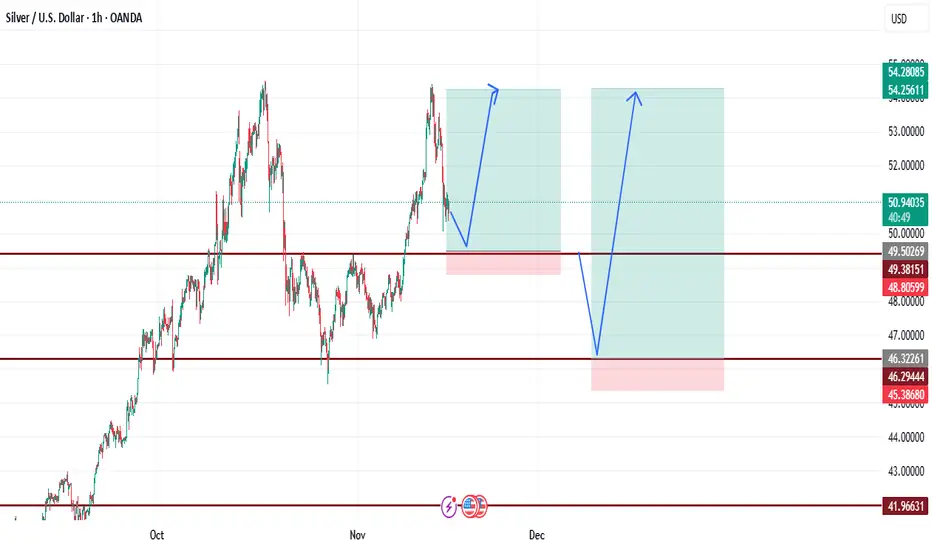
XAGUSD NEXT MOVE 1️⃣ Bullish Bounce Scenario (Most Likely)
If price holds at $49.50 (38.2% support):
✔ Buy Zone
🎯 Target 1: $51.30
🎯 Target 2: $53.75 (previous high)
🎯 Target 3: $55+ (Fibonacci extension)
This scenario aligns with trend continuation.
2️⃣ Bearish Correction Scenario
If price breaks below $49.50:
Price may drop to $47.90 (50% retracement)
Strongest reversal from $46.30 (61.8% Golden Ratio)
This level often creates a powerful upside movement.
🟢 Preferred Trading Zones
Buy Zone 1: $49.50
Stop Loss: $48.80
Targets: $51.30 → $52.80 → $53.70
Buy Zone 2 (Golden Ratio): $46.30
Stop Loss: $45.40
Targets: $49 → $51 → $53
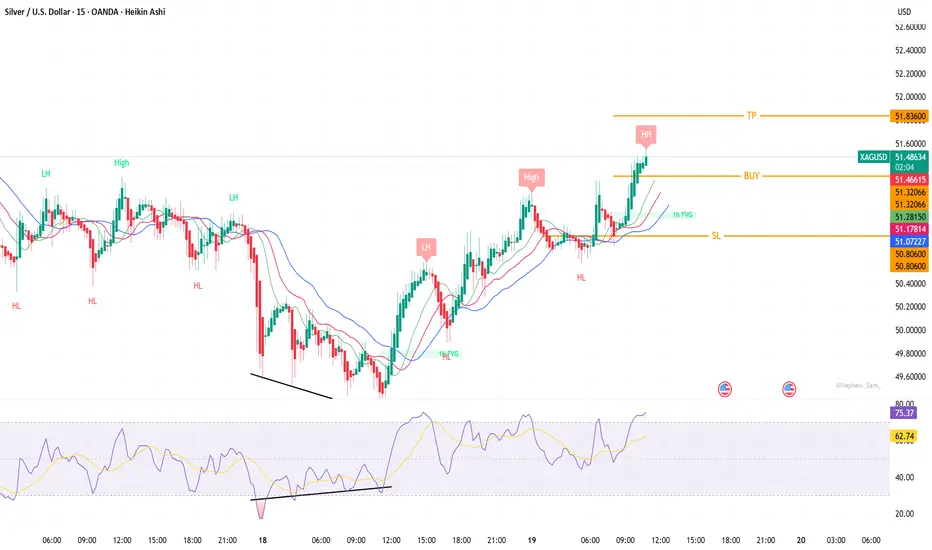
XAGUSD – Clean Break of Structure + RSI Divergence Reversal-15M
Price formed bullish RSI divergence at the lows, signaling early reversal strength.
Market shifted from Lower Highs (LH) to Higher Lows (HL), confirming a trend change.
Price reclaimed key EMAs and has now printed a clean Higher High (HH).
A 1H Fair Value Gap (FVG) was filled, adding confluence for bullish continuation.
Momentum remains strong as candles stay above the short-term moving averages
.
Trade Plan
Buy Zone: 51.28 – 51.32
Take-Profit (TP): 51.836
Stop-Loss (SL): 50.806
Why This Setup Makes Sense
Strong bullish structure shift after divergence.
Fresh HH confirms continuation bias.
Clear path to 51.836 liquidity zone.
EMAs aligned for bullish momentum.
Invalidation
Break below 50.806 invalidates the bullish structure and cancels the setup.
Stop!Loss|Market View: SILVER🙌 Stop!Loss team welcomes you❗️
In this post, we're going to talk about the near-term outlook for SILVER ☝️
Potential trade setup:
🔔Entry level: 50.69205
💰TP: 47.22310
⛔️SL: 52.42652
"Market View" - a brief analysis of trading instruments, covering the most important aspects of the FOREX market.
👇 In the comments 👇 you can type the trading instrument you'd like to analyze, and we'll talk about it in our next posts.
💬 Description: Based on yesterday's metal price close, a slight rally in both silver and gold is expected today. Silver is expected to rally to 52 in order to liquidate sellers. The most reliable entry point will be a false breakout at 51.30625, which is expected soon. The downside target is seen at key support today—46.20000—while the medium-term outlook is near 40.
Thanks for your support 🚀
Profits for all ✅

XAGUSD - Bullish ReversalXAGUSD has formed an inverse head and shoulder pattern. Placing Buystop above neckline.

Silver bullish ascending triangle patternSilver is potentially forming a bullish ascending triangle pattern. The potential target price if it breaks out of the top of the triangle is $64-$65/oz. This is not financial advice, but it is a potential pattern I see playing out.

XAGUSD-2H Setup watching for a break and retest of the 51.048 resistance level. Once confirmed, I plan to add more to the trade, targeting higher levels around 51.317 and 51.835, with the potential for further upside.

Silver may hit $56 in Nov 26Silver may hit $56 in Nov 26.... then on the way to $110 by early next year. It's a once in a lifetime capital rotation event. I hold Silver ETF.... Short term fluctuation won't affect me at all.

silver usdHI GUYS.
UPDATE ON SERIOUS POSSIBLE CURRENT TREND
We were supposed to start bulls on Monday followed by Monday Tuesday double bottom. this would have given us a clean trend.
Currently we started with a Monday, Tuesday which is false, so i expect sells on Thursday, Friday.
lets see what happens in case we fail to rally upwards.


Silver Outlook Turning Stronger — Bullish Setup in Play!🥈 XAG/USD SILVER SURGE | Bullish Swing Trade Setup 📈
🎯 TRADE SUMMARY
Asset: XAG/USD (Silver vs US Dollar) | Metals Market 💰
Strategy: Swing Trade | Bias: BULLISH ⬆️
Risk/Reward: Professional Grade | Timeframe: Multi-Day Setup
📍 ENTRY STRATEGY - LAYERED APPROACH 🔄
Recommended Entry Zones (Multiple Buy Limit Orders)
1st Entry: $49.000 - Initial Position 20% 📌
2nd Entry: $49.500 - Add Position 30% 📌
3rd Entry: $50.000 - Final Entry 50% 📌
Strategy: Use limit orders at each level for better execution. Scale in progressively to optimize average entry price. This approach reduces risk and increases position efficiency.
🛑 STOP LOSS
Recommended SL Level: $48.000
⚠️ RISK DISCLAIMER: This is a suggested level based on technical structure. You must adjust your stop loss according to YOUR personal risk management, account size, and trading strategy. There is NO one-size-fits-all SL - ownership of risk is yours alone.
🎪 PROFIT TARGETS 🚀
Primary Target: $54.000
Confluence Factors:
Strong Resistance Zone Identified ✓
Overbought Condition Setup ✓
Potential Trap/Correction Reversal ✓
Bullish Breakout Extension ✓
⚠️ TP DISCLAIMER: This target is based on technical analysis. You control your profit-taking strategy. Consider taking partial profits at key resistance levels. Lock in gains at YOUR discretion - this is YOUR trading decision.
🔗 CORRELATED PAIRS TO MONITOR 📊
1️⃣ DXY (US Dollar Index) - INVERSE CORRELATION
Why: Silver prices move inversely to dollar strength
Watch For: If DXY weakens 📉, XAG typically strengthens 📈
Key Level: Monitor 103.50-105.00 zone
2️⃣ EURUSD - INDIRECT CORRELATION
Why: Euro strength correlates with silver strength (risk-on sentiment)
Watch For: EURUSD above 1.1000 supports silver bullish bias
Key Level: 1.0950-1.1050 range critical
3️⃣ GOLD/USD (XAU/USD) - POSITIVE CORRELATION
Why: Precious metals move together in risk-off/on scenarios
Watch For: Gold breaks above 2,700 = Silver momentum likely follows
Key Level: XAU/USD 2,650-2,750 zone
4️⃣ SPX500 (S&P 500) - RISK SENTIMENT
Why: Equities strength supports risk-on sentiment, bullish for silver
Watch For: SPX breaks 6,000+ supports precious metals outflow
Key Level: 5,850-6,050 pivot zone
5️⃣ COPPER/USD (HG) - INDUSTRIAL DEMAND
Why: Copper demand correlates with economic growth = Silver bullish signal
Watch For: HG above 4.30 = Risk-on sentiment confirmed
Key Level: 4.20-4.35 critical range
📈 KEY TECHNICAL POINTS
✅ Bullish Structure: Lower highs/lows pattern breaking
✅ Momentum: Building strength in watch zone
✅ Risk/Reward: Favorable 1:2+ setup
✅ Entry Precision: Multiple confirmation levels
✅ Exit Clarity: Clear profit target defined
⚡ QUICK TRADE CHECKLIST
Confirm DXY weakness before entry
Check Gold (XAU/USD) above 2,650
Verify EURUSD above 1.0950
Set all 3 limit orders at entry zones
Place SL at 48.000 (adjusted to YOUR risk)
Divide position into TP tranches
Monitor correlated pairs daily
🎓 TRADER'S NOTES
This analysis reflects current technical structure as of publication. Market conditions evolve. Adjust strategy based on:
Market news/data releases
Central bank decisions
Geopolitical events
Real-time price action
Remember: Past performance ≠ Future results. Trade with discipline. Manage risk first, profits follow.
💡 LIKE if helpful | 📌 SAVE for reference | ✅ FOLLOW for updates
Technical Analysis | Swing Trading | Metals Market | XAG/USD Strategy

SILVER (XAGUSD) BUY TRADE PLANXAGUSD
PLAN OVERVIEW
• Category: Swing
• Trade Type: Pullback to HTF OB/FVG
• Direction: BUY
• Confidence: 78% (≥70% required)
• Min R:R: 1:3 to TP2
• Status: VALID
⸻
MACRO ALIGNMENT NOTE (Mandatory)
• Trend: WITH (D1/H4 bullish structure – HL → HH sequence intact)
• Macro Bias: WITH (risk-on flow + DXY pullback + metals bid tone)
• Implication: Bullish continuation remains the dominant probability unless D1 swing low breaks.
⸻
🟩 LEVELS CARD (Quick Action)
PRIMARY SETUP (Higher Probability) → BUY
Entry 01: 50.20 – 50.40
• H1 FVG retracement
• Fresh inefficiency
• Clean displacement origin
Entry 02 (Secondary Zone): 49.90 – 50.10
• H1/H4 bullish OB
• D1 discount retest
• EQ lows liquidity pocket
Stop Loss (Safe – FINAL): 49.30
• Below D1 swing
• Below H4 invalidation
• Below liquidity cluster
Take Profits (Locked):
• TP1: 51.20
• TP2: 52.00
• TP3: 53.40
Order: Pending – Pre-validated ✅ (cancel if invalidation breaks before entry)
Session: London / NY
⸻
✔ EXECUTION CHECKLIST
1. News Blackout: 15m pre / 60m post red events
2. Price must tap zone during London/NY
3. Confirmation: H1/H4 bullish engulf or BOS
4. Execute order type as defined
5. Partial TP1 → SL to BE → Trail
6. Exit on invalidation break
7. Skip if no trigger appears
8. Skip if EMA stack flat/choppy at zone
⸻
📊 FUNDAMENTALS & NEWS
• CB Bias: Fed leaning neutral/dovish tone → metal supportive
• Key Data 7d: US CPI, NFP (watch volatility), PMIs
• Cross-Asset:
• DXY corrective
• Yields soft
• VIX neutral
• Metals strong flow
• Positioning: Specs add long metals, retail mixed
• Macro Lean: Metals supported unless USD suddenly strengthens via data surprise
⸻
🧭 MARKET MAP
• D1 bullish continuation structure
• H4 OB below price unmitigated
• Liquidity resting below 50.00 clustered
• Displacement leg shows intent
• Play Type: Pullback to HTF OB/FVG (Primary)
⸻
💰 RISK & MONEY MANAGEMENT
• Risk per idea: 1–2%
• Basket cap: 2%
• Min R:R: ≥1:3 to TP2
• Trail using H1 swing structure
⸻
🎯 CONFIDENCE (One Sentence)
78% — D1/H4 trend intact, premium → discount pullback clean, two fresh high-probability liquidity zones beneath price.
⸻
🧠 FINAL EXECUTION STRATEGY / PERSONAL NOTE
• Primary trigger: Buy on tap + H1 BOS/engulf; partial at TP1; trail aggressively
• Alternate trigger: None
• Last-Candle Audit: If no H1 BOS/engulf → hold pending or skip
• Stay flat if: 49.30 breaks before entry
• Zone status: Fresh
• No forced trades — wait for clean reactions only
⸻
📘 POST-TRADE JOURNAL (End of Plan)
(You fill after execution)

Rebound Possible, But Below 50.50 Silver Remains Vulnerable1. What Happened Recently
After touching the old all-time high at 54.50 last week, Silver reversed sharply. Initially, the decline looked like a normal correction, and price held at 50.50 support — the level that had acted as a major bullish reference point.
However, yesterday Silver broke below 50.50, and today it is trading near the next key support zone, which now represents the line in the sand for bulls.
2. Technical Outlook
A short-term rebound from current levels is possible — markets rarely fall in a straight line — but for bulls to regain control, price must stabilize back above 50.50.
If this does not happen, the structure remains vulnerable.
The decisive level is 49.50.
A sustained break below 49.50 would likely trigger a new bearish leg, confirming that last week’s rejection from ATH was not just noise — but a meaningful shift in momentum.
3. Trading Plan
I remain cautious and will look to sell any rally back into 50.50, as long as price fails to reclaim that level.
Below 49.50, I expect continuation lower.
Only a firm close back above 50.50 would negate the bearish outlook.
4. Conclusion
Short-term bounces may occur, but the broader picture now favors downside continuation unless bulls can defend the current support and recover 50.50.
For now, the path of least resistance is lower, and I will position accordingly.

silver usdHI GUYS,
SILVER and GOLD have been on the same network for weeks, selling and buying with similar price patterns and accurate days of the week.
However as soon as this swing trade works out breaking the all time high HISTORICALLY its going to drop the network and Seek for an independent strength.
NOTE. CURRENT SITUATION
GOLD SELLS AND SILVER SELLS .
FUTURE SITUATION
GOLD BUYS AND SILVER SELLS.
