xagusd 4h🔹 Overall Outlook and Potential Price Movements
In the charts above, we have outlined the overall outlook and possible price movement paths.
As shown, each analysis highlights a key support or resistance zone near the current market price. The market’s reaction to these zones — whether a breakout or rejection — will likely determine the next direction of the price toward the specified levels.
⚠️ Important Note:
The purpose of these trading perspectives is to identify key upcoming price levels and assess potential market reactions. The provided analyses are not trading signals in any way.
✅ Recommendation for Use:
To make effective use of these analyses, it is advised to manually draw the marked zones on your chart. Then, on the 15-minute time frame, monitor the candlestick behavior and look for valid entry triggers before making any trading decisions.
Trade ideas

XAGUSD : Harmonic structureIn terms of harmonic structure, I can see that XAG shares EXACTLY the same structure as XAU. Yes, exactly the same when the price goes up to the ATH.
In the coming days or weeks, the price will come crashing down, as it has on previous occasions, just that XAG will go down more compared to XAU.
I think most likely deflation is coming.
Good luck.

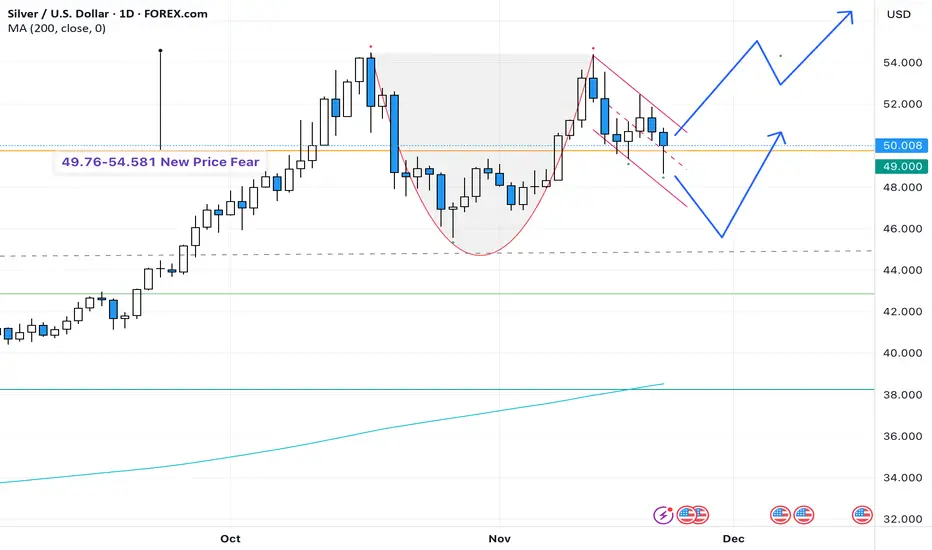
Is Silver Setting Up for a Massive Bull Run? Cup & Handle SignalWith gold leading the rally by printing new all-time highs. Meanwhile, silver — often ignored — has also broken its historical level at 49.76 USD and pushed into a new high.
Last week, global liquidity weakened and silver retraced to 48.644, but buyers quickly stepped in and pushed the daily close back above 49.76, showing strong bullish demand at higher prices.
On the daily chart, silver is forming a clean Cup & Handle pattern. The price is currently consolidating within the handle, and a breakout above the key resistance at 54 USD could trigger a powerful continuation move.
Key points to watch:
✔ Precious metals remain in a strong macro bull cycle
✔ Silver successfully retested its previous high zone
✔ Cup & Handle formation is nearly complete
✔ A breakout above 54 could accelerate the next major rally
Silver is known for its volatility and explosive trends once momentum builds. Do you think a breakout above 54 could mark the beginning of silver’s next big run?
Silver (XAGUSD) — Breakdown Setup After Double TopSilver has printed a clear Double Top at a major resistance zone, showing signs of trend exhaustion after a strong bullish rally. Recent structure and momentum signals now point toward a potential deeper correction.
🔹 Key Bearish Signals
Double Top at major resistance
Shift from Higher High (HH) to Lower High (LH)
Bearish RSI divergence on 1D and 4H
Multiple rejections at the same resistance level
Support zone has been tested several times → increasing breakdown probability
🔻 Trade Plan
Sell Stop below the support zone
SL: Above recent LH
TP: Next major demand area (clean downside structure)
🎯 Why This Setup Matters
Double Top + LH confirms early trend reversal
RSI divergence reinforces weakening momentum
1D and 4H confluence adds confidence
A support break could trigger a sharp move down with strong R:R potential


XAGUSD Is it on the brink of a Bear Cycle?Silver (XAGUSD) has formed the same kind of 1W RSI peak pattern as the one that marked the August 2020 Top of the previous Bull Cycle.
The confirmation signal for the Top on that Bull Cycle following an impressive 4-month rally (similar to the July - September 2025 one), was the price breaking below the 1D MA50 (red trend-line).
When that took place, the price violently dropped to the 0.382 Fibonacci retracement level. As a result, if we get again a 1D MA50 break-out (which is being tested persistently and holding), we expect Silver to start a new Bear Cycle and quickly decline to 38.000 (Fib 0.382). On the longer term, we may even see a bottom as low as 30.500 (Fib 0.618) based on the July - October 2022 bottom formation of the previous Bear Cycle.
Perhaps the most optimal indicator to call the bottom, hence the most optimal long-term buy, is the 1W RSI getting oversold at 30.00 as it happened perfectly another 3 times in the past 7 years.
---
** Please LIKE 👍, FOLLOW ✅, SHARE 🙌 and COMMENT ✍ if you enjoy this idea! Also share your ideas and charts in the comments section below! This is best way to keep it relevant, support us, keep the content here free and allow the idea to reach as many people as possible. **
---
💸💸💸💸💸💸
👇 👇 👇 👇 👇 👇

silverHI GUYS,
WE close our trades today as silver has reached area of interest.
THERE was a delay that led to a failure of Thur to reach intended target, however we are good to go.

XAGUSD Silver Outlook (Count 2)Here is my primary view on FX_IDC:XAGUSD . This is a slightly different count compared to my last outlook; however the ending goal is pretty much the same. I will work on a higher time frame outlook to show what structure exists above the weekly time frame.
In this outlook silver is currently close to working through a series of wave 4's and 5's. As I mention on the chart if the projected levels change but the sequence is accurate then I’ll be happy with that.
Having just looked at my monthly chart, it’s possible that this current impulsive wave sequence could extend the yellow wave (5) completion target up to around $87. If so, then I will have to go through the chart and change the wave degrees accordingly. As my yellow intermediate degree would become the cyan primary degree sitting under the purple cycle degree.
More comments on the chart.

XAGUSD If silver gives proper confirmation at the time level and lower price levels, a buy could be considered

Silver reaching significant support at 4845The Silver remains in a bullish trend, with recent price action showing signs of a corrective pullback within the broader uptrend.
Support Zone: 4845 – a key level from previous consolidation. Price is currently testing or approaching this level.
A bullish rebound from 4845 would confirm ongoing upside momentum, with potential targets at:
5033 – initial resistance
5108 – psychological and structural level
5214 – extended resistance on the longer-term chart
Bearish Scenario:
A confirmed break and daily close below 4845 would weaken the bullish outlook and suggest deeper downside risk toward:
4780 – minor support
4740 – stronger support and potential demand zone
Outlook:
Bullish bias remains intact while the Silver holds above 4845. A sustained break below this level could shift momentum to the downside in the short term.
This communication is for informational purposes only and should not be viewed as any form of recommendation as to a particular course of action or as investment advice. It is not intended as an offer or solicitation for the purchase or sale of any financial instrument or as an official confirmation of any transaction. Opinions, estimates and assumptions expressed herein are made as of the date of this communication and are subject to change without notice. This communication has been prepared based upon information, including market prices, data and other information, believed to be reliable; however, Trade Nation does not warrant its completeness or accuracy. All market prices and market data contained in or attached to this communication are indicative and subject to change without notice.

Double Top SilverSilver is forming a potential double-top pattern, signaling fading bullish strength. If price breaks below the neckline, it would confirm the pattern and open the door for further downside continuation.

XAGUSDNote that these analyzes are only for recording personal accounts and journals that will be reviewed in the future.
Please do not enter into any trade just by viewing the analysis, thank you.

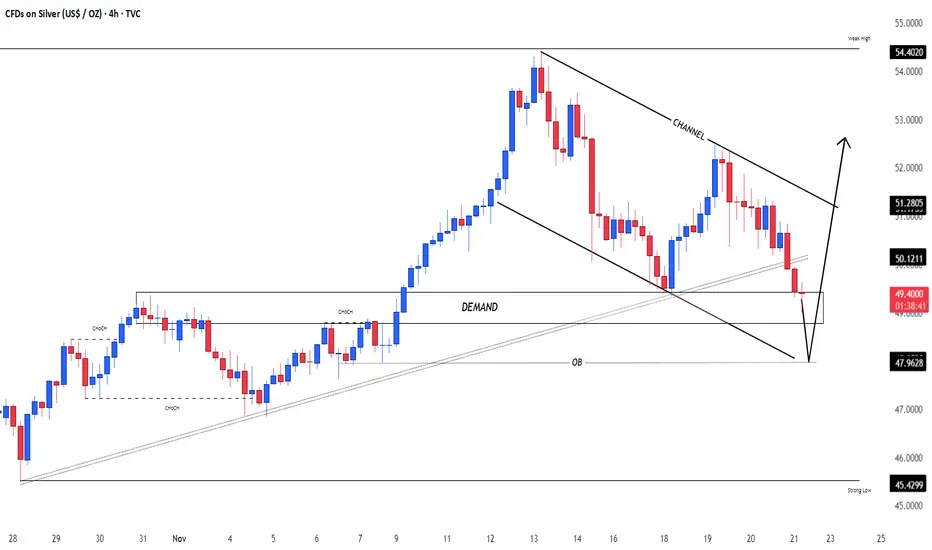
SilverXAGUSD
- Break of Structure
- Ascending Trendline
- Bearish Channel as an corrective pattern in Short Time Frame
- Demand Zone
- Order Block
XAGUSD H4 | Falling Towards 61.8% Fibonacci SupportMomentum: Bullish
Price action is currently retracing toward the buy entry level, which aligns with the 61.8% Fibonacci retracement, an area that often acts as a strong reaction zone.
Buy Entry: 48.75
Strong overlap support
61.8% Fibonacci retracement confluence
Stop Loss: 47.50
Pullback support
78.6% Fibonacci retracement
Take Profit: 51.00
Pullback resistance
High Risk Investment Warning
Stratos Markets Limited (tradu.com ), Stratos Europe Ltd (tradu.com ):
CFDs are complex instruments and come with a high risk of losing money rapidly due to leverage. 70% of retail investor accounts lose money when trading CFDs with this provider. You should consider whether you understand how CFDs work and whether you can afford to take the high risk of losing your money.
Stratos Global LLC (tradu.com ): Losses can exceed deposits.
Please be advised that the information presented on TradingView is provided to Tradu (‘Company’, ‘we’) by a third-party provider (‘TFA Global Pte Ltd’). Please be reminded that you are solely responsible for the trading decisions on your account. Any information and/or content is intended entirely for research, educational and informational purposes only and does not constitute investment or consultation advice or investment strategy. The information is not tailored to the investment needs of any specific person and therefore does not involve a consideration of any of the investment objectives, financial situation or needs of any viewer that may receive it. Past performance is not a reliable indicator of future results. Actual results may differ materially from those anticipated in forward-looking or past performance statements. We assume no liability as to the accuracy or completeness of any of the information and/or content provided herein and the Company cannot be held responsible for any omission, mistake nor for any loss or damage including without limitation to any loss of profit which may arise from reliance on any information supplied by TFA Global Pte Ltd.

SILVER H4 | Bearish Reversal Off 61.8% Fibonacci ResistanceMomentum: Bearish
The price has rejected the sell-entry level, which aligns with the 61.8% Fibonacci retracement, reinforcing the bearish bias.
Sell Entry: 52.170
Pullback resistance
61.8% Fibonacci retracement
Stop Loss: 54.04
Swing-high resistance
Take Profit: 49.47
Strong overlap support
High Risk Investment Warning
Stratos Markets Limited (tradu.com ), Stratos Europe Ltd (tradu.com ):
CFDs are complex instruments and come with a high risk of losing money rapidly due to leverage. 70% of retail investor accounts lose money when trading CFDs with this provider. You should consider whether you understand how CFDs work and whether you can afford to take the high risk of losing your money.
Stratos Global LLC (tradu.com ): Losses can exceed deposits.
Please be advised that the information presented on TradingView is provided to Tradu (‘Company’, ‘we’) by a third-party provider (‘TFA Global Pte Ltd’). Please be reminded that you are solely responsible for the trading decisions on your account. Any information and/or content is intended entirely for research, educational and informational purposes only and does not constitute investment or consultation advice or investment strategy. The information is not tailored to the investment needs of any specific person and therefore does not involve a consideration of any of the investment objectives, financial situation or needs of any viewer that may receive it. Past performance is not a reliable indicator of future results. Actual results may differ materially from those anticipated in forward-looking or past performance statements. We assume no liability as to the accuracy or completeness of any of the information and/or content provided herein and the Company cannot be held responsible for any omission, mistake nor for any loss or damage including without limitation to any loss of profit which may arise from reliance on any information supplied by TFA Global Pte Ltd.

silver analys
for people who says it is double top i need to say u have to learn some basic important things about patterns,as we can see on the daily chart neck line is almost half of the up trend line,so we can consider it as a failure for doublt top also in last down trend line (right trend) price is playing while it has to complete the pattern straight,so for buyers i need to say the is no worries about it but be update on chart and do not listen to every one.

SILVER BUT PRICED IN THE HOUSING CONSUMER PRICE INDEXRight now a thousand pounds of silver might get you a house.
What if you could get that same house for 200 pounds instead.
Timing.
DYOR. I go strictly by the charts.

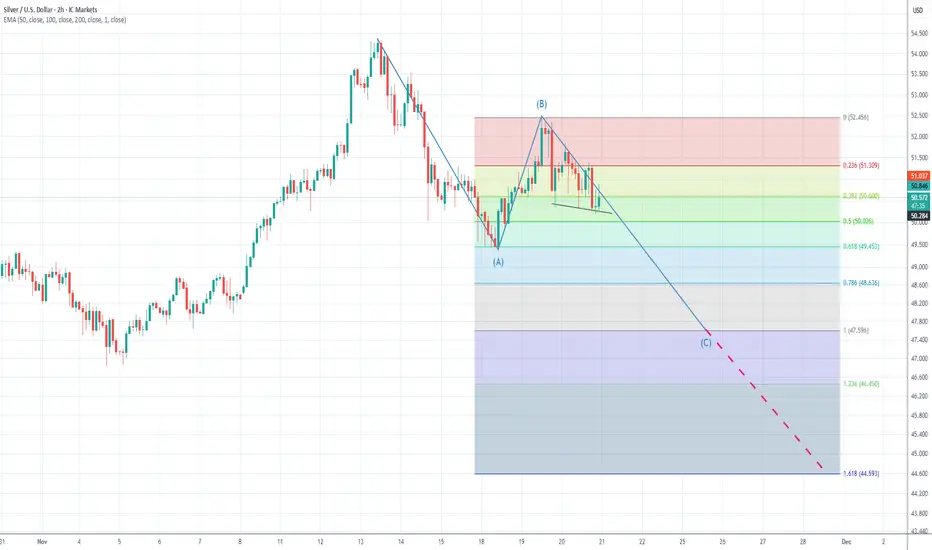
Silver: Completed B-Wave — C-Wave Drop in Progress To 47Silver (XAGUSD) has completed a clear A–B–C corrective structure, with wave B failing below the 52.45 resistance zone. The rejection from the upper boundary aligns with the broader bearish sequence and confirms that sellers remain in control.
Wave (A) established the initial downside leg, followed by a corrective (B) retracement that stalled near the 0.236–0.382 Fibonacci levels. Price action has since broken structure to the downside, suggesting that wave (C) is now unfolding.
Using Fibonacci projections of wave A, wave C typically targets either:
1.0 × A = ~47.60
1.618 × A = ~44.60
Both levels align with the broader bearish sequence and prior liquidity zones. As long as price remains below 52.45, the bias favors continuation lower toward the Fibonacci extension cluster between 46.40–44.60.
Short-term corrective bounces are expected but should remain capped beneath the declining trendline and major moving averages.
This view remains valid unless Silver breaks above 52.45, which would invalidate the structure and shift the bias.
Disclaimer
This analysis is provided for educational and informational purposes only. It is not a recommendation or invitation to buy or sell any financial instrument. Markets carry significant risk, and every trader should perform their own independent analysis, apply appropriate risk management, and consult a licensed financial professional if needed. You are fully responsible for any trading decisions you make.

Silver Buy Alert #3- You Only Have 20 MIns TO Execute ThisSilver buy alert..
Sadly i did not analyse
this one so give me a second
am coming...wait
i found my analysis on silver
Silver is going to explode
this time around
and if you get in now
you will experience a bull market
this is the entry
i was waiting to see
for the first time
am seeing the financial markets
in trading but hurry
you only have 20 mins
before this
buy alert expires
The trading analysis is below
--
read it below
--
Step 1 — Interpret MACD Colors Only (Bullish Table)
Given:
• Daily: Light Green 🟢
• 4H: Dark Green 🟢 + Rising 3 Soldiers
• 1H: Dark Green 🟢
From the Bullish MACD Table:
Daily
4H
1H
Interpretation
Probability
🟢 Light Green
🟢 Dark Green
🟢 Dark Green
Daily regaining strength, intraday momentum accelerating
🟠 75-85%
MACD-only base probability: 75-85% (High)
Step 2 — Add Candlestick Pattern
Given Pattern:
• 4H: Rising 3 Soldiers + Dark Green MACD
From Bullish Candlestick Table:
4H - Rising 3 Soldiers + Dark Green:
Three White Soldiers + 🟢 4H + 🟢 1H → 95% base → 99% final
The Rising 3 Soldiers pattern on the 4H timeframe with perfect Dark Green MACD alignment on both 4H and 1H significantly boosts the probability.
Step 3 — Combine for Final Probability
This is a very strong bullish setup:
Strengths:
• Strong MACD alignment: 4H & 1H Dark Green (maximum momentum), Daily Light Green (bullish momentum building)
• Powerful bullish pattern: Rising 3 Soldiers on 4H (one of the strongest patterns)
• Lower timeframes show maximum momentum (4H & 1H Dark Green)
• Excellent confluence across all timeframes
Final Probability:
🔥 90-95% (Very High)
Trade Insight:
This represents a high-probability bullish continuation setup because:
• 4H shows maximum bullish momentum with the strongest pattern (Rising 3 Soldiers)
• 1H confirms with maximum bullish momentum (Dark Green)
• Daily shows building bullish momentum (Light Green)
• Rising 3 Soldiers on 4H indicates sustained buying pressure
• Perfect setup for upward momentum acceleration
Action:
Excellent long entry - strong setup:
• Enter on break above 4H Rising 3 Soldiers high
• Add positions on any 1H pullback
• Place stops below the 4H Rising 3 Soldiers pattern low
• Expect strong upward continuation as Daily momentum builds toward Dark Green
This is a high-confidence bullish trade with strong pattern and momentum alignment, particularly on the lower timeframes where the Rising 3 Soldiers provides exceptional bullish conviction.
Rocket boost this content to learn more
Warning! Trading is risky please use a simulation trading account
before you trade with real money.

XAGUSD LongA very risky trade in the context of tight stop loss , but worth of taking this trade since is good risk reward ratio. Reasons that I am entering long are simple, following the trend and the price held very solidly on level 49.50$. I look definitely for new highs to ~55$ zone.

"Rising 3 Soldiers on 4H indicates sustained buying pressure"Notice where the horizontal line is appearing?
Its at the top of the price action strength.
This is called the bull trap.
But the good thing
about silver is that
even in a bull trap
It still help up strong against the short selling
pressure..
When i took it upon my self to
take on this analysis - it was a bold move
because honestly am not sure
if my trading analysis skills
are good enough
to trade silver.
right now we are in a state
of correction
But the analysis below
is about the time
it happened before the
correction entry
that you are seeing
right now.
This correction entry showed
"strong upward continuation as Daily momentum"
This continuation appeared as a morning star
candlestick pattern.
Read my analysis for silver
below.
Thanks.
Step 1 — Interpret MACD Colors Only (Bullish Table)
Given:
• Daily: Light Green 🟢
• 4H: Dark Green 🟢 + Rising 3 Soldiers
• 1H: Dark Green 🟢
From the Bullish MACD Table:
Daily
4H
1H
Interpretation
Probability
🟢 Light Green
🟢 Dark Green
🟢 Dark Green
Daily regaining strength, intraday momentum accelerating
🟠 75-85%
MACD-only base probability: 75-85% (High)
Step 2 — Add Candlestick Pattern
Given Pattern:
• 4H: Rising 3 Soldiers + Dark Green MACD
From Bullish Candlestick Table:
4H - Rising 3 Soldiers + Dark Green:
Three White Soldiers + 🟢 4H + 🟢 1H → 95% base → 99% final
The Rising 3 Soldiers pattern on the 4H timeframe with perfect Dark Green MACD alignment on both 4H and 1H significantly boosts the probability.
Step 3 — Combine for Final Probability
This is a very strong bullish setup:
Strengths:
• Strong MACD alignment: 4H & 1H Dark Green (maximum momentum), Daily Light Green (bullish momentum building)
• Powerful bullish pattern: Rising 3 Soldiers on 4H (one of the strongest patterns)
• Lower timeframes show maximum momentum (4H & 1H Dark Green)
• Excellent confluence across all timeframes
Final Probability:
🔥 90-95% (Very High)
Trade Insight:
This represents a high-probability bullish continuation setup because:
• 4H shows maximum bullish momentum with the strongest pattern (Rising 3 Soldiers)
• 1H confirms with maximum bullish momentum (Dark Green)
• Daily shows building bullish momentum (Light Green)
• Rising 3 Soldiers on 4H indicates sustained buying pressure
• Perfect setup for upward momentum acceleration
Action:
Excellent long entry - strong setup:
• Enter on break above 4H Rising 3 Soldiers high
• Add positions on any 1H pullback
• Place stops below the 4H Rising 3 Soldiers pattern low
• Expect strong upward continuation as Daily momentum builds toward Dark Green
This is a high-confidence bullish trade with strong pattern and momentum alignment, particularly on the lower timeframes where the Rising 3 Soldiers provides exceptional bullish conviction.
Rocket boost this content to learn more.
Disclaimer:Trading is risky
please use a simulation trading account before you trade with real money and learn risk management and profit taking strategies.

XAGUSD H1 | Bullish Bounce off Key SupportMomentum: Bullish
Price is currently above the ichimoku cloud.
Buy entry: 51.11
- Strong overlap support
- 38.2% Fib retracement
- 100% Fib projection
Stop Loss: 50.32
- Swing low support
- 61.8% Fib retracement
Take Profit: 52.135
- Overlap resistance
High Risk Investment Warning
Stratos Markets Limited (tradu.com/uk ), Stratos Europe Ltd (tradu.com/eu ):
CFDs are complex instruments and come with a high risk of losing money rapidly due to leverage. 70% of retail investor accounts lose money when trading CFDs with this provider. You should consider whether you understand how CFDs work and whether you can afford to take the high risk of losing your money.
Stratos Global LLC (tradu.com/en ): Losses can exceed deposits.
Please be advised that the information presented on TradingView is provided to Tradu (‘Company’, ‘we’) by a third-party provider (‘TFA Global Pte Ltd’). Please be reminded that you are solely responsible for the trading decisions on your account. Any information and/or content is intended entirely for research, educational and informational purposes only and does not constitute investment or consultation advice or investment strategy. The information is not tailored to the investment needs of any specific person and therefore does not involve a consideration of any of the investment objectives, financial situation or needs of any viewer that may receive it. Past performance is not a reliable indicator of future results. Actual results may differ materially from those anticipated in forward-looking or past performance statements. We assume no liability as to the accuracy or completeness of any of the information and/or content provided herein and the Company cannot be held responsible for any omission, mistake nor for any loss or damage including without limitation to any loss of profit which may arise from reliance on any information supplied by TFA Global Pte Ltd.
