Silver is in the Bullish directionHello Traders
In This Chart XAGUSD HOURLY Forex Forecast By FOREX PLANET
today XAGUSD analysis 👆
🟢This Chart includes_ (XAGUSD market update)
🟢What is The Next Opportunity on XAGUSD Market
🟢how to Enter to the Valid Entry With Assurance Profit
This CHART is For Trader's that Want to Improve Their Technical Analysis Skills and Their Trading By Understanding How To Analyze The Market Using Multiple Timeframes and Understanding The Bigger Picture on the Charts
Trade ideas
SILVER NOT a Cup & Handle = Bearish Signal
Look like the pattern is invalid due to:
1. Handle Position: The handle should form in the upper half of the cup's structure, ideally retracing no more than one-third of the cup's depth.
2. If the handle of a cup and handle pattern keeps going downwards more than halfway into the cup, the pattern is generally considered invalid or significantly weakened as a bullish signal.
What do you think?

XAGUSD M30 | Bullish Bounce Off Fib LevelsMomentum: Bullish
The price is currently pulling back toward the buy entry level, which aligns with the 38.2% Fibonacci retracement and the 61.8% Fibonacci projection, both reinforcing a strong bullish setup.
Buy Entry: 51.78
Pullback Support:
38.2% Fibonacci retracement
61.8% Fibonacci projection
Stop Loss: 51.14
Support Level:
50% Fibonacci retracement
Take Profit: 53.46
Pullback Resistance
High Risk Investment Warning
Stratos Markets Limited (tradu.com ), Stratos Europe Ltd (tradu.com ):
CFDs are complex instruments and come with a high risk of losing money rapidly due to leverage. 70% of retail investor accounts lose money when trading CFDs with this provider. You should consider whether you understand how CFDs work and whether you can afford to take the high risk of losing your money.
Stratos Global LLC (tradu.com ): Losses can exceed deposits.
Please be advised that the information presented on TradingView is provided to Tradu (‘Company’, ‘we’) by a third-party provider (‘TFA Global Pte Ltd’). Please be reminded that you are solely responsible for the trading decisions on your account. Any information and/or content is intended entirely for research, educational and informational purposes only and does not constitute investment or consultation advice or investment strategy. The information is not tailored to the investment needs of any specific person and therefore does not involve a consideration of any of the investment objectives, financial situation or needs of any viewer that may receive it. Past performance is not a reliable indicator of future results. Actual results may differ materially from those anticipated in forward-looking or past performance statements. We assume no liability as to the accuracy or completeness of any of the information and/or content provided herein and the Company cannot be held responsible for any omission, mistake nor for any loss or damage including without limitation to any loss of profit which may arise from reliance on any information supplied by TFA Global Pte Ltd.

Multi-decade SLV Cup-and-HandleIf silver breaks above its previous highs against the dollar, it could trigger a surge in investor interest, pushing prices even higher.
If the WSB / NYSE:GME / NYSE:AMC deigns realize how much open short interest is on Silver, we could see a massive run to new ATHs for Silver per Oz. Pay attention to Derivatives like AMEX:AGQ , which touched close to $800 last time Silver was up at ~$48/oz in 2011. Be ready for fireworks if these shorts begin to feel a squeeze.

Silver Price Ready for Lift-Off: Bullish Channel Silver (XAG/USD) is consolidating within a rising channel, with strong Ichimoku cloud support hinting at a potential bullish breakout. After a brief pullback to the lower channel boundary, price action shows signs of rebound momentum targeting the $54 resistance zone. A confirmed break above $53 could trigger an upward move equal to the channel height, continuing the bullish trend. Traders are watching for a breakout confirmation above the midline for a potential long setup.
🧭 Chart Overview
Timeframe: 30-minute chart
Indicator: Ichimoku Cloud (9, 26, 52, 26)
Price: $52.67 (as of the chart time)
Trend Channel: Rising (ascending parallel channel)
---
📊 Price Action Analysis
1. Trend Structure:
The chart shows Silver trading inside a well-defined ascending channel, respecting both upper and lower boundaries.
Price recently bounced off the lower channel support, which often acts as a bullish signal within an ongoing trend.
2. Ichimoku Cloud (Kumo):
The price is hovering around the top of the Ichimoku cloud, suggesting neutral-to-bullish sentiment.
The cloud’s future span (Senkou Span A > Span B) points slightly upward — a sign of potential continuation of the uptrend.
Support lies near the $52.50–$52.60 zone, which aligns with both the lower channel line and the top of the cloud — a strong confluence area.
3. Momentum Observation:
The recent correction looks more like a healthy retracement than a reversal.
Buyers are likely waiting for confirmation before pushing higher.
4. Breakout Levels:
Immediate Resistance: $53.40 (mid-channel + previous top).
Major Resistance: $54.00 (upper channel target).
Support Zone: $52.50–$52.00 (Ichimoku + trendline confluence).
---
🚀 Bullish Scenario
If price closes above $53.40, it would confirm a breakout of the short-term consolidation pattern.
The projected move (based on the channel height) suggests a target near $54.50–$54.60.

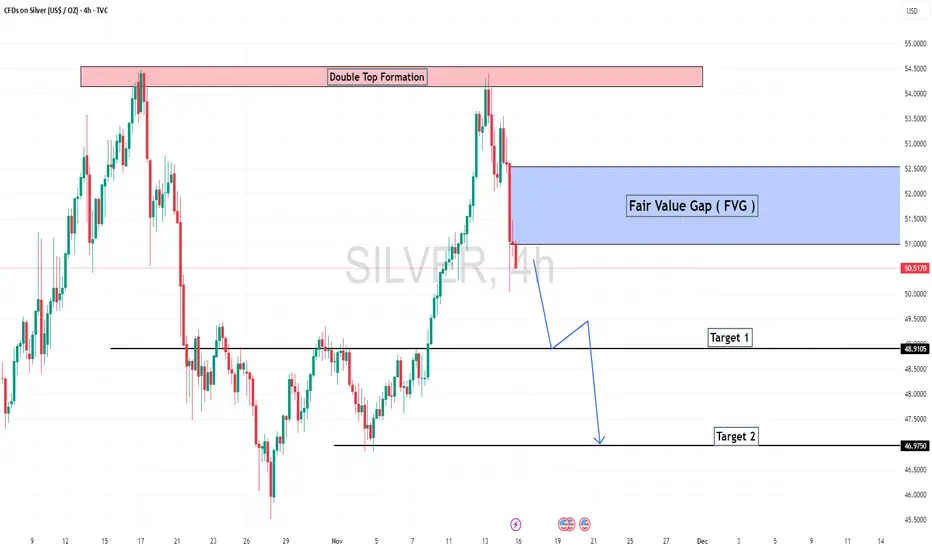
xagusd 4h🔹 Overall Outlook and Potential Price Movements
In the charts above, we have outlined the overall outlook and possible price movement paths.
As shown, each analysis highlights a key support or resistance zone near the current market price. The market’s reaction to these zones — whether a breakout or rejection — will likely determine the next direction of the price toward the specified levels.
⚠️ Important Note:
The purpose of these trading perspectives is to identify key upcoming price levels and assess potential market reactions. The provided analyses are not trading signals in any way.
✅ Recommendation for Use:
To make effective use of these analyses, it is advised to manually draw the marked zones on your chart. Then, on the 15-minute time frame, monitor the candlestick behavior and look for valid entry triggers before making any trading decisions.

Silver likely moving towards 45.5Everyone is asking what happened to OANDA:XAGUSD and OANDA:XAUUSD and surprised that why it's going down suddenly. But it's just following the Elliott Wave counts and this was very much on cards as I have been sharing on my X account since last couple of weeks.
Silver has started wave C down within wave (4). As per wave A and C equality, it could slide to 45.5 before it continues it's move upwards. Gold is also doing something similar.

SILVER: Bulls Will Push Higher
The recent price action on the SILVER pair was keeping me on the fence, however, my bias is slowly but surely changing into the bullish one and I think we will see the price go up.
Disclosure: I am part of Trade Nation's Influencer program and receive a monthly fee for using their TradingView charts in my analysis.
❤️ Please, support our work with like & comment! ❤️

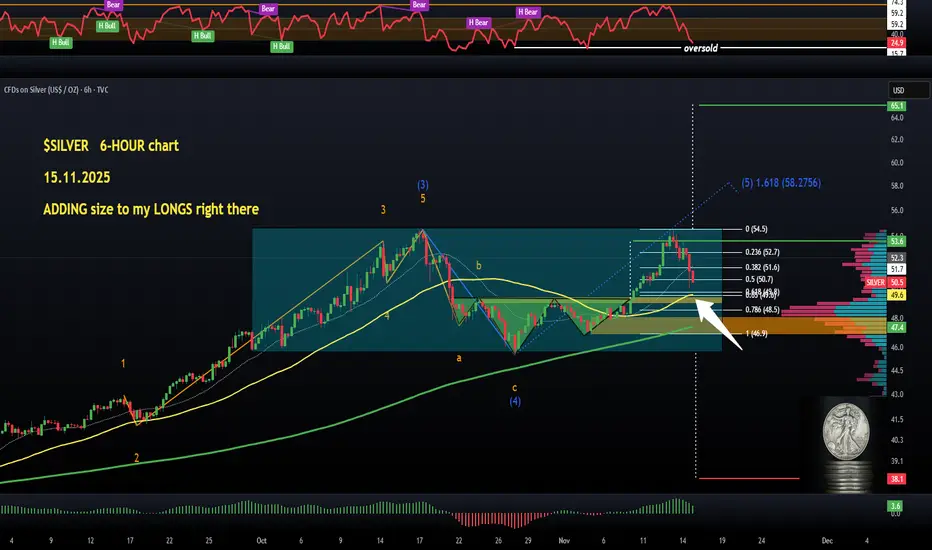
$SILVER (6-HOUR): adding SIZE to my LONG right there:The quoted #Silver 4-hour chart shows a text-book inverted HEAD & SHOULDERS that played out perfectly and reached its $53.6 target.
I usually take profits on text-book breakouts, but this asset is an exception as I have higher targets in mind.
The attached 6-hour chart shows a correction that started after markets closed last Wednesday, followed by a wider market correction. Top stocks were bleeding heavily as well.
So many “traders” are calling this a DOUBLE TOP and they are just wrong.
Way too early imo, as TVC:SILVER is likely in a clear WAVE 5 rally during a re-accumulation phase (hence the rectangle with a breakout point at $54.5 and targeting $65.1). WAVE 5 on the daily, 12-hour and 6-hour charts. I like this confluence in EW.
RSI is oversold now, just like it recently was at the bottom of the inverted H&S. The 50 MA is acting as dynamic support at $49.6, and the 200 MA at $47.4 can be used as an invalidation point for my bullish thesis.
A dip to $47 would be fine as long as it gets bought up quickly. I will add to my long with conviction between $47 and $50.
Take-profit levels from my previous SILVER post remain unchanged.
$50 is dirt-cheap and people will realise it soon.
👽💙
Trading Education: Understanding Liquidity (IRL & ERL)In technical analysis (especially SMC/ICT), most price movements are attempts to reach liquidity. This liquidity is what fuels major moves.
* IRL (Internal Range Liquidity): Liquidity located within a defined trading range. This is often represented by Order Blocks, Fair Value Gaps (FVG), or liquidity pools inside the range.
* ERL (External Range Liquidity): Liquidity located outside the trading range, usually represented by Swing Highs and Swing Lows which act as Stop-Loss Pools.
🔄 The Philosophy of Price Movement
Price generally moves from IRL \to ERL or vice versa:
* IRL \to ERL (External Clearance): 🧹 After hitting/mitigating an imbalance or Order Block (IRL) within the range, the price will accelerate outwards to sweep (clear) the Stop-Losses located at the Swing Highs/Lows (ERL).
* ERL \to IRL (Internal Refill): ⛽ Once the ERL is cleared (liquidity sweep), the price tends to reverse to target and refill unmitigated imbalances or Order Blocks inside the range (IRL).
The takeaway: ERL acts as the primary target for liquidity clearance, while IRL is the area where "Smart Money" looks for entry points or reactions to continue the move.
#Trading #TechnicalAnalysis #SMC #ICT #Liquidity #IRL #ERL

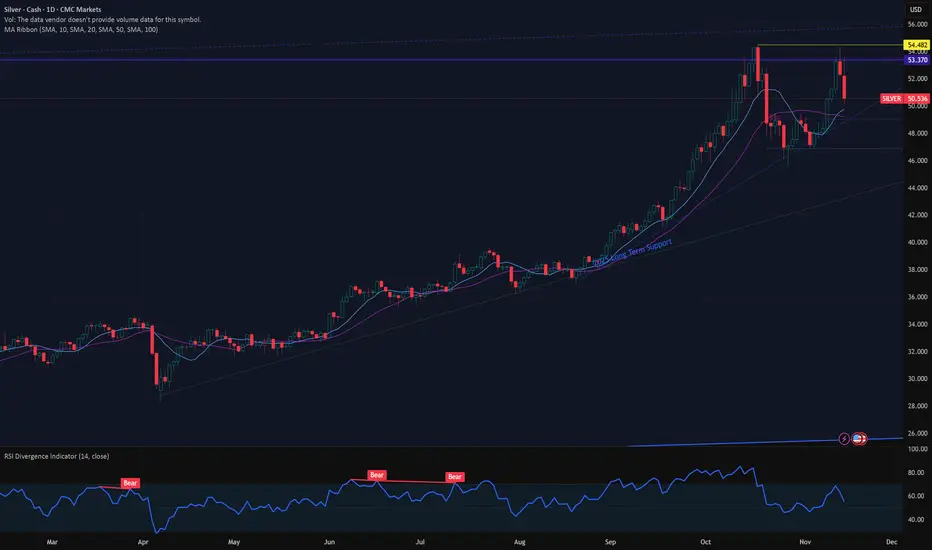
Double Top is inKind of an amazing week for Silver but its hard to not conclude that the double top is in. I was completely wrong with my prior bear flag hypothesis and Mr Market was so kind to throw a few more bullish candles at us to stop out the shorts (Luckily I was neutral) & confirm that top at $54ish along with a really ugly RSI divergence indicator. I am fully out of metals now as this market is wild and unpredictable now but I do think that maybe this precious metals bull market is over and we will get a bit of mean reversion now.
On a longer time frame, the 200 day EMA is down at $40 in Silver and the 48 month is at $30 - In 2009, on the monthly chart, the distance between the 48 month EMA touch (July 2009) and the peak in April 2011 (the then all time high) is 21 months. Its currently 21 months since we made contact with the 48 month EMA in Feb 2024. Just something to note in extended bull runs.

Silver $70 targetSilver $70 target. It need to break out of the yellow ascending triangle pattern, maybe by late Nov/early Dec.

Can Silver Reach New Highs? Strategy Update
Silver's recent pullback has been quite significant. After testing the previous high of 54.5, it experienced a sharp drop, reaching a low near 52. Those who have read our articles should be aware of this. Fortunately, we capitalized on this short position; you can verify this by checking our previous posts. The silver market opened lower at 53 in the previous trading day, then fell to 52.6 before quickly rising to 54.4, before falling back at the close. The daily low reached 52 before consolidating. Overall, the upward trend in silver remains dominant. Today, Friday, we expect a slow and steady rise; avoid chasing the price higher. Support lies at 51.7-52; a drop below this level would suggest low-level consolidation. Resistance is at 53-53.5; a break above this level would target the previous high. Both bulls and bears have opportunities today; stay on track.
I focus solely on short-term trading and clear market analysis. In short-term trading, there is no perpetually rising or falling market, only the correct entry point at any given moment. Find the rhythm and follow the trend. This is the essence of trading. Currently, you must seize every opportunity to buy on pullbacks. If you're struggling to execute trades precisely, try my method: first test the market with a small position, then add to your position during pullbacks. This way, you won't miss any opportunities. If you're truly unsure when, where, and how to operate, let's work together to flexibly and steadily pursue greater profits in this ever-changing market!

SILVER XAGUSD SILVER demand floor at 48-47$ will be challenged at 51.385$-52$ zone, should we break and close above this level we could be seeing more upswing into 54.303-55 zone and a retest supply roof .
key fundamental outlook
Electronics & Electrical: Silver’s unmatched electrical conductivity makes it vital in smartphones, data centers, automotive electronics, and other high-tech devices.
Solar Photovoltaics (PV): Rapid growth in solar panel production has sharply increased silver demand
Electric Vehicles (EVs): EVs use 25-50 grams of silver per vehicle in electrical contacts, battery management, and thermal system
5G Infrastructure: Silver is used extensively in 5G equipment, including connectors and amplifiers.
Medical uses (antimicrobial properties), water purification, advanced computing cooling systems, and IoT continue to expand silver's demand base.
Supply Deficit: The silver market has experienced a supply deficit for several consecutive years, tightening physical availability and supporting prices.
Safe-Haven Demand: Alongside gold, silver benefits from investor demand during geopolitical and economic uncertainties.
silver remains bullish despite pullback ,price will keep rising .

In my opinion, the price will reach 33 dollarsOf course, after losing this trend line and if Makadi changes the phase with these settings when it fails

Silver in times of scarcity: what drives its volatilityThe silver market has been marked by intense swings, with prices on COMEX climbing over 74% since January-outstripping gold’s gains for the year. Over the last 30 days alone, silver has advanced more than 21%, reflecting that way a mix of industrial pressures and short-term trading frictions. Silver is widely used in electronics, solar panels, and batteries, so its price is closely linked to the economic cycle: when demand rises, prices go up, and when demand slows, prices can fall just as quickly.
This cyclicality makes the silver market particularly susceptible to sharp reversals. The current rally has also been driven by a pronounced shortage of physical metal, particularly in the London market: the resulting short squeeze forced sellers who were betting on a decline to buy back the metal at a high price, which drove prices even higher. As a result, an unusual premium of $3 per ounce has formed in favor of London compared to New York futures - a dislocation that is rare for silver and is even forcing some traders to charter ships for transatlantic delivery, despite the high logistics costs.
Exchange stocks on COMEX (around 500 million ounces at the end of summer 2025) remain without sustainable accumulation, and LBMA data show a reduction in stocks in London vaults, confirming a real physical shortage. Additional pressure on supplies is created by demand from India, the world's largest consumer of silver. About 80% of the country's needs are covered by imports, and ahead of Diwali, imports doubled: jewelry, coins, and industrial demand “sucked” significant volumes from Western markets. This has led to a premium of over 10% above the global spot price in India. At the same time, silver ETFs are accumulating additional volumes of physical metal, which further weakens the availability of silver on the market. Silver offers higher growth potential as an “industrial” asset, but at the same time is subject to significantly greater price fluctuations and is vulnerable to supply disruptions and speculative dynamics in derivatives.


AUG long trade ideaThe demand is spiking for this precious metal as it is broadly used for:
- Industry
- Manufacturing
- Electronics
- Automotive
- Medicine
- Jewelry
- Armament
Silver has always been useful to industries and technologies due to its unique properties, from its antibacterial nature to high electrical conductivity. Today, silver is critical for the next generation of smartphones, medical devices, renewable energy technologies and EV batteries for electric cars and drones.

Possible Cup and Handle for SilverSilver likes forming cups then breaking them, I saw them many times. A possible new one is forming but complete yet. I'm thinking about entering the trade early. It might decreases the chances of a winning trade but also increases the risk reward ratio and possible total loss. I did not decide how to proceed yet myself.

SilverXAGUSD
- Completed " 123 " Impulsive Waves
- Fibonacci Level - 50.00% / 61.80%
- Break of Structure
- Double Top in Long Time Frame
- RSI - Divergence

Silver rally pause supported at 5156The Silver remains in a bullish trend, with recent price action indicating a potential sideways consolidation within the broader uptrend.
Support Zone: 5156 – a key level from previous consolidation. Price is currently testing or approaching this level.
A bullish rebound from 5156 would confirm ongoing upside momentum, with potential targets at:
5445 – initial resistance
5500 – psychological and structural level
5600 – extended resistance on the longer-term chart
Bearish Scenario:
A confirmed break and daily close below 5156 would weaken the bullish outlook and suggest deeper downside risk toward:
5090 – minor support
5035 – stronger support and potential demand zone
Outlook:
Bullish bias remains intact while the Silver holds above 5156. A sustained break below this level could shift momentum to the downside in the short term.
This communication is for informational purposes only and should not be viewed as any form of recommendation as to a particular course of action or as investment advice. It is not intended as an offer or solicitation for the purchase or sale of any financial instrument or as an official confirmation of any transaction. Opinions, estimates and assumptions expressed herein are made as of the date of this communication and are subject to change without notice. This communication has been prepared based upon information, including market prices, data and other information, believed to be reliable; however, Trade Nation does not warrant its completeness or accuracy. All market prices and market data contained in or attached to this communication are indicative and subject to change without notice.

XAGUSD-WeeklyWill the cup pattern be confirmed?
If confirmed, the silver could reach the $100 range.
