SILVER LEVELScheck this out , if you missed your chance with the gold bull run , you can still catch up with SILVER no FOMO , these are the traget levels of support and resistence ; wait the indication and take your trade /
Trade ideas

SILVER Will Go Down! Short!
Here is our detailed technical review for SILVER.
Time Frame: 9h
Current Trend: Bearish
Sentiment: Overbought (based on 7-period RSI)
Forecast: Bearish
The market is testing a major horizontal structure 5,097.6.
Taking into consideration the structure & trend analysis, I believe that the market will reach 4,922.1 level soon.
P.S
We determine oversold/overbought condition with RSI indicator.
When it drops below 30 - the market is considered to be oversold.
When it bounces above 70 - the market is considered to be overbought.
Like and subscribe and comment my ideas if you enjoy them!

Silver Buy PlanSilver Buy Plan
I’ll wait for confirmation before taking a buy trade.
Recently, a CISD formed, which may push the price lower. There’s a strong bullish order block sitting much lower, and that zone can act as the base for an upward move.
For now, I’ll just observe the market closely. Once price action aligns with my criteria, I’ll look for a buy setup.
We already have a sweep of the previous low, and my first target will be around the equilibrium or the previous week’s level.

XAGUSD⬇️ Sell Range: 48.7000 - 49.4000
⏹️ Stop Loss: 50.7000
*️⃣ Take Profit: 46.7000 - 45.6000
🔠 The silver calls for a test of regional resistance near 48.9500. This is followed by continued consideration of quotes with faces below 46.0000. A strong rally, breakout, and consolidation above 50.4500 will reverse the downward price movement in silver. This will signal a breakout of the resistance area.

Silver - Short Term Buy IdeaH1 - Strong bullish momentum.
No opposite signs.
Until the two Fibonacci support zones hold I expect the price to move higher further.
If you enjoy this idea, don’t forget to LIKE 👍, FOLLOW ✅, SHARE 🙌, and COMMENT ✍! Drop your thoughts and charts below to keep the discussion going. Your support helps keep this content free and reach more people! 🚀
-------------------------------------------------------------------------------------------------------------------

XAGUSD H | Potential Bearish ReversalMomentum: Bearish
Price is currently reacting off the sell entry, which aligns with the 61.8% Fibonacci retracement and the 161.8% Fibonacci extension.
Sel entry: 50.93
Pullback resistance
61.8% Fibonacci retracement and the 161.8% Fibonacci extension
Stop loss: 52.22
Pullback resistance
Slightly below the 78.6% Fibonacci retracement
Take profit: 49.22
Pullback support
38.2% Fibonacci retracement
Stratos Markets Limited (tradu.com):
CFDs are complex instruments and come with a high risk of losing money rapidly due to leverage. 68% of retail investor accounts lose money when trading CFDs with this provider. You should consider whether you understand how CFDs work and whether you can afford to take the high risk of losing your money.
Stratos Europe Ltd (tradu.com ):
CFDs are complex instruments and come with a high risk of losing money rapidly due to leverage. 70% of retail investor accounts lose money when trading CFDs with this provider. You should consider whether you understand how CFDs work and whether you can afford to take the high risk of losing your money.

Silver Builds Momentum: Break Above 49.50 in Sight1. What Happened Recently
After rebounding from the 45.50 recent low, Silver rallied strongly into the 49.30–49.50 resistance zone, where it faced short-term selling pressure. A healthy correction followed, taking price back to the 47.00 support area.
2. Market Reaction
From that zone, bulls stepped back in. Since Wednesday last week, the market has been climbing in a constructive and steady manner, suggesting that the correction phase might be complete.
3. Technical Outlook
At the time of writing, Silver is attempting to break above the 49.30–49.50 resistance. If successful, this move could trigger a continuation toward the 50.50 zone, which represents the next meaningful resistance on the chart.
The broader structure remains bullish as long as price stays above 48.00, while dips below 49.00 offer good buying opportunities within the trend.
4. Trading Plan
My preferred approach is to buy dips under 49, with a protective invalidation under 48. First profit targets lie near 50.50, with potential extensions if momentum persists.
5. Conclusion
Momentum has shifted firmly back in favor of the bulls. As long as 48 holds, Silver remains in a bullish phase, and buying dips is the rational play. ⚡️


SILVER Strong Supply Area Ahead! Sell!
Hello,Traders!
SILVER tapped into a major supply zone, where liquidity above previous highs got engineered for smart money entries. The structure suggests a bearish continuation toward the next target zone. Time Frame 5H.
Sell!
Comment and subscribe to help us grow!
Check out other forecasts below too!
Disclosure: I am part of Trade Nation's Influencer program and receive a monthly fee for using their TradingView charts in my analysis.

Silver.Silver.
Impressive move for today, up over 4% back above $50.
It will have to go up much more, much faster, if $100 is to be breached in early 2026.

SILVER WILL KEEP GROWING|LONG|
✅SILVER is rallying from a refined demand zone, showing bullish orderflow continuation. With liquidity swept below previous lows, institutions may target the next imbalance near $51.00. Time Frame 3H.
LONG🚀
✅Like and subscribe to never miss a new idea!✅

Silver Tries a Comeback but It Could Depend on the ShutdownSilver is contracting within a triangle-like pattern. After the sharp selloff, it managed to find some balance above the 47.60–47.80 zone and has since regained the 200 SMA on the 60-minute timeframe.
Liquidity constraints tied to QT and the US government shutdown are creating downward pressure on precious metals. These factors are likely to ease once the shutdown and QT end, and the market may start pricing that in early, potentially leading to renewed bullish momentum in the coming days.
The 49.30 level is likely to serve as the trigger for upward movement. Until that resistance breaks, it’s best to remain cautious.

SILVER SENDS CLEAR BEARISH SIGNALS|SHORT
SILVER SIGNAL
Trade Direction: short
Entry Level: 4,984.0
Target Level: 4,875.1
Stop Loss: 5,056.8
RISK PROFILE
Risk level: medium
Suggested risk: 1%
Timeframe: 1h
Disclosure: I am part of Trade Nation's Influencer program and receive a monthly fee for using their TradingView charts in my analysis.
✅LIKE AND COMMENT MY IDEAS✅

XAGUSD H1 | Bullish Bounce off SupportXAGUSD is falling towards our buy entry at 47.95, which is a minor pullback support level, that aligns with the H1 Fair Value Gap and 71% Fibonacci retracement level.
The stop loss is at 47.56, which is a swing low support level, while the take profit is at 48.73, which is a swing high resistance level.
Stratos Markets Limited (tradu.com/uk ):
CFDs are complex instruments and come with a high risk of losing money rapidly due to leverage. 68% of retail investor accounts lose money when trading CFDs with this provider. You should consider whether you understand how CFDs work and whether you can afford to take the high risk of losing your money.
Stratos Europe Ltd (tradu.com/eu ):
CFDs are complex instruments and come with a high risk of losing money rapidly due to leverage. 70% of retail investor accounts lose money when trading CFDs with this provider. You should consider whether you understand how CFDs work and whether you can afford to take the high risk of losing your money.

Silver oversold bounce retesting important resistanceSilver remains in a bullish trend, with recent price action showing signs of a corrective pullback within the broader uptrend.
Support Zone: 4737 – a key level from previous consolidation. Price is currently testing or approaching this level.
A bullish rebound from 4737 would confirm ongoing upside momentum, with potential targets at:
4980 – initial resistance
5066 – psychological and structural level
5166 – extended resistance on the longer-term chart
Bearish Scenario:
A confirmed break and daily close below 4737 would weaken the bullish outlook and suggest deeper downside risk toward:
4667 – minor support
4600 – stronger support and potential demand zone
Outlook:
Bullish bias remains intact while the silver holds above 4737. A sustained break below this level could shift momentum to the downside in the short term.
This communication is for informational purposes only and should not be viewed as any form of recommendation as to a particular course of action or as investment advice. It is not intended as an offer or solicitation for the purchase or sale of any financial instrument or as an official confirmation of any transaction. Opinions, estimates and assumptions expressed herein are made as of the date of this communication and are subject to change without notice. This communication has been prepared based upon information, including market prices, data and other information, believed to be reliable; however, Trade Nation does not warrant its completeness or accuracy. All market prices and market data contained in or attached to this communication are indicative and subject to change without notice.

SILVER (XAGUSD) BUY TRADE PLANPAIR & DATE: XAGUSD — 10 Nov 2025
PLAN ID: XAGUSD-2025-11-10-A
Analysis Timestamp (UTC): 07:20 UTC • Chart Age: ≤30m ✅
⸻
PLAN OVERVIEW
• Category: Swing
• Trade Type: Pullback to HTF OB
• Direction: BUY (only buy meets ≥70%)
• Confidence: 78%
• Min R:R: 1:3 to TP2
• Status: ✅ VALID
⸻
MACRO ALIGNMENT NOTE (Mandatory)
• Trend: WITH (D1/H4 bullish structure, strong impulsive legs)
• Macro Bias: WITH (soft USD + supportive metals environment)
• Implication: Bullish continuation favored; discount pullbacks are opportunity zones.
⸻
LEVELS CARD (Quick Action)
✅ Primary Setup (Higher Probability) → BUY
• Entry 01 (Primary Zone): 48.90 – 48.70
(Full H4 demand block + D1 discount wick sweep + clean liquidity pocket)
• Stop Loss: 48.35
(Below OB base + D1 invalidation structure)
• Entry 02 (Secondary Zone): 47.90 – 48.05
(Deeper D1 demand + unfilled imbalance; optional only if reached)
• TP1: 50.10
• TP2: 50.80
• TP3: 51.60
• Order: Pending – Pre-validated ✅
(Expires end of NY session or on pre-entry invalidation/red USD event)
• Session: London / NY
⸻
EXECUTION CHECKLIST
1. Red news blackout: 15m pre / 60m post
2. Price must tap the zone during London/NY
3. H1/H4 confirmation: Engulf / BOS / Pin
4. Execute only the defined order type
5. Take partial at TP1 → SL BE → trail
6. Exit immediately on structural invalidation
7. Skip if no trigger
8. Skip if EMA stack is flat/choppy with no volatility
⸻
FUNDAMENTALS & NEWS
• CB Bias: Fed softening; real yields easing
• This Week: CPI/PPI → high-volatility risk for metals
• Cross-Asset: Weaker DXY + stable equities = pro-metals
• Positioning: Specs adding longs; retail leaning short
• Macro Lean: Metals bullish; USD soft → dip buys preferred
⸻
MARKET MAP
• HTF Trend: D1/H4 bullish BOS continuation
• Liquidity: Equal lows at 48.90; clean sweep potential
• Zones: H4 OB at 48.90–48.70 (high-quality)
• Setup Type: WITH-trend pullback continuation
⸻
RISK & MONEY MANAGEMENT
• Risk: 1–2%
• Basket cap: 2% total metals exposure
• ATR/Spread: acceptable
• Minimum R:R ≥ 1:3 to TP2 satisfied
• Trail using H1 structure
⸻
CONFIDENCE (ONE SENTENCE)
78% — strong HTF bullish structure + macro metals support + clean H4 OB demand with liquidity sweep confluence.
⸻
FINAL EXECUTION STRATEGY / PERSONAL NOTE
• Primary Trigger: Pending buy in 48.90–48.70; require H1 confirmation wick/engulf.
• Last-Candle Audit: If no bullish reaction → stand aside until retest or cancel.
• Zone Status: Fresh, clean, unmitigated.
⸻
POST-TRADE JOURNAL
Outcome + lesson: __________

Silver Correction Ending: Major Drop AheadSilver (XAG/USD) has completed a 5-wave decline, marking the end of Wave (A)/(1) near the 45.53 level. Since then, price has been retracing upward in a complex W–X–Y corrective structure, which appears to be forming the final leg of Wave (B)/(2). The rise is losing strength near the upper channel, hinting that bulls may soon exhaust. Once Wave (B)/(2) finishes, the next big move is expected to be a strong bearish Wave (C)/(3) decline targeting lower zones near or below 45. In simple terms: last leg of correction nearly done → next big drop ahead.
Stay tuned!
@Money_Dictators
Thank you :)

SILVER USDHI GUYS,
UPDATE ON SILVER.
silver and GOLD seem to be on the same network this week.
we formed an Hs price H8, H4, with detail h1,h2 combination of patterns .strong buys.
Note The H8,H6,H4 signal box path will never change its what gives us direction ,however the price pattern can vary or play between time frames, so keep in mind to always check through the given time frames to ensure a valid entry

Silver analysisSilver has also entered a correction after a drop, and I still believe that we should not take short positions, even if we see a short signal, because it goes completely against the larger cycles.
In this situation, I suggest either placing a buy stop or entering a long position after confirming a resistance breakout.
For now, don’t think about short positions — unless on a lower timeframe you get an RR=1 and exit quickly.

Possible target of Silver in near future$76 is possible and projected target as per Elliot wave theory where 161% of wave 1. Am I correct or else. Please submit your view also.
Thank you.

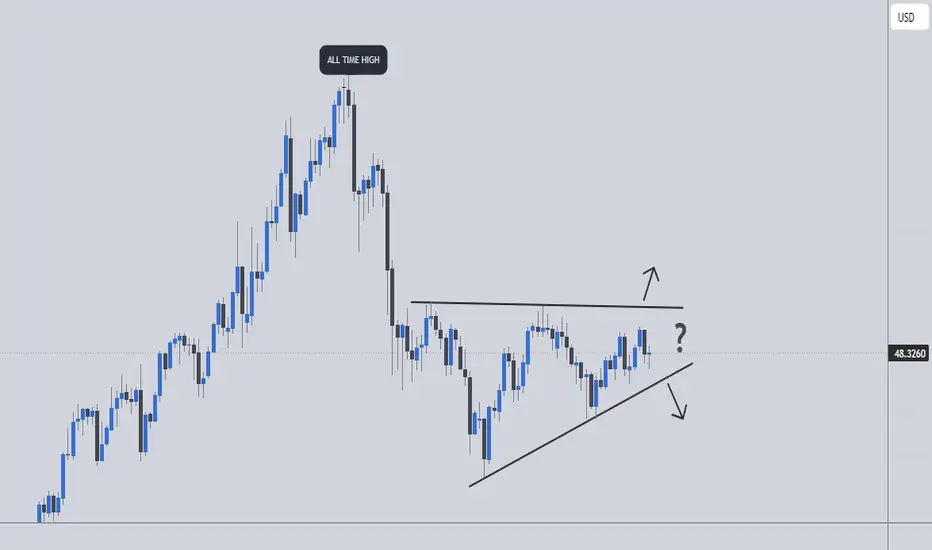
Silver Breakout Imminent?Will Silver surge again ?
First, price must break through the $49.00–$49.50 resistance zone — a key area first formed on October 23rd and retested on October 31st before sellers drove it lower. If this zone holds, Silver may face a deeper correction or slip back into sideways consolidation.
However, a clean breakout above $49.50 would shift the structure decisively bullish, opening the door for a retest of the all-time high set on October 16th, 2025 — and potentially signaling the start of a new bull leg.
A clean break and close below $47.00, on the other hand, could act as a catalyst for a sharper decline, signaling a potential trend reversal and opening the door for a deeper slide in Silver’s price.
SILVER: Bearish Continuation is Highly Probable! Here is Why:
Looking at the chart of SILVER right now we are seeing some interesting price action on the lower timeframes. Thus a local move down seems to be quite likely.
Disclosure: I am part of Trade Nation's Influencer program and receive a monthly fee for using their TradingView charts in my analysis.
❤️ Please, support our work with like & comment! ❤️

SILVER USDHI GUYS,
SILVER USD is on a road to success as we expect a head to shoulder h4, h3 price pattern with
a correction of detail in h1, 30min.
lets scalp sell this pair with ease Monday morning
