Silver Breaks Out of Key Trend Range with Multiple Supporting FaSilver Breaks Out of Key Trend Range with Multiple Supporting Factors
Technical View
Silver has broken out above the triangle’s upper boundary, signaling a potential shift from consolidation to bullish momentum.
A decisive break above the July peak at 39.50 would confirm an uptrend and open the way toward 41.50, aligned with the 161.8% Fibonacci retracement.
Failure to clear the psychological barrier at 39.00, however, could trigger a pullback toward 38.00 or the ascending trendline support.
Notably, a golden cross across multi-period EMAs has just formed, reinforcing the bullish bias.
Fundamental View
The key driver for an uptrend in precious metals, including silver, is political turmoil after President Trump’s attempt to fire Fed Governor Lisa Cook raised concerns over the Fed’s independence. Markets now price in an 85% chance of a September rate cut, up from 78% a week ago.
The dollar weakened on rate-cut expectations, supporting metal prices, though it stabilized slightly mid-week.
Markets are awaiting US Q2 GDP data (3% growth expected) and July PCE inflation, the Fed’s preferred gauge, which is likely to remain above the 2% target.This is likely to create volatility in the market.
Analysis by: Krisada Yoonaisil, Financial Markets Strategist at Exness
SILVER trade ideas
SILVER (XAGUSD): Bullish Continuation AheadFollowing a retest of a previously breached structure, SILVER has demonstrated a resumption of its bullish trend.
The bullish breakout observed above the resistance line of a bullish flag pattern offers robust confirmation of a continued bullish trend.
It is anticipated that the price will rise towards the 39.18 level.

Sell Bitcoin for Silver?Charting a spread can help you decide where to park your money. Silver dominance over Bitcoin just broke a falling wedge. Silver may act as an alternative to altcoins

Silver is in the Bearish trend after testing ResistanceHello Traders
In This Chart XAGUSD HOURLY Forex Forecast By FOREX PLANET
today XAGUSD analysis 👆
🟢This Chart includes_ (XAGUSD market update)
🟢What is The Next Opportunity on XAGUSD Market
🟢how to Enter to the Valid Entry With Assurance Profit
This CHART is For Trader's that Want to Improve Their Technical Analysis Skills and Their Trading By Understanding How To Analyze The Market Using Multiple Timeframes and Understanding The Bigger Picture on the Charts

A 45-Year Trend Breakout Signal in the Silver/S&P 500 Ratio
This analysis presents a long-term case for a secular trend reversal in the Silver-to-S&P 500 ratio. The ratio appears to be breaking out from a multi-year consolidation pattern that is nested within a massive 45-year descending channel. This alignment of short-term and long-term patterns, supported by fundamental drivers, suggests the extended period of equity outperformance over silver may be approaching a major inflection point.
Technical Analysis: A Generational Reversal
The monthly chart displays a rare confluence of technical formations, with each pattern reinforcing the others across different time horizons.
* The 45-Year Descending Channel: The entire modern history of the ratio is framed by a massive descending channel originating from the 1980 peak. This structure has defined the long-term bear market. The key insight is that the ratio bottomed at the lower boundary of this channel in the early 2000s and has spent two decades building a base in the lower half of the channel.
* The Macro Rounding Bottom: The large green arc (highlighted by the white circle) visualizes the generational bottoming process that has been forming since the 2011 peak. This classic reversal pattern suggests a gradual but powerful shift from a bearish regime to a new bullish accumulation phase.
* The Nested Triangle Breakout: Within the larger rounding bottom, the price has been consolidating in a multi-year symmetrical triangle. The ratio is currently attempting to break out from this nested pattern, signaling the potential start of the next major upward impulse.
* Bullish Moving Average Crossover: Confirming this breakout is a rare "golden cross" on the monthly chart, with the 12/24-month SMAs crossing above the 50-month SMA. This signals a significant shift in long-term momentum, mirroring a similar event that preceded the major bull market that peaked in 2011.
Fundamental Drivers
This technical setup is underpinned by powerful fundamental catalysts:
* Strategic Mineral Classification: The U.S. Geological Survey (USGS) has designated silver as a "Critical Mineral," essential for national security and the economy.
* Emerging Sovereign Demand: Reports indicate potential new interest from sovereign entities, like Saudi Arabia and Russia, in adding silver to their national reserves.
* Structural Supply Deficit: This new demand is emerging against a backdrop of a persistent structural deficit in the silver market.
Synthesis and a Two-Stage Thesis
The technicals suggest a two-stage process for a major trend reversal. The breakout from the nested triangle, driven by the rounding bottom, represents the initial move. This is the start of a potential journey from the lower half of the 45-year channel toward its upper boundary.
Should the initial breakout be confirmed, it could represent the beginning of the parabolic, multi-year phase of outperformance that many long-term investors have anticipated for decades.
- Stage 1 Confirmation: A sustained monthly close above the 0.0060 level is the critical threshold for confirming the breakout from the nested triangle.
- Stage 2 Macro Target: A successful breakout would imply an eventual long-term move toward the upper boundary of the 45-year descending channel.
Disclaimer : This analysis is for informational and educational purposes only and does not constitute financial advice. All investment decisions should be made with the consultation of a qualified professional.

Silver | Long Setup | Industrial Demand Breakout | Aug 27, 2025📌 XAGUSD | Long Setup | Historic Undervaluation + Industrial Demand Breakout | Aug 27, 2025
ROI: $160M
Risk: $5.7M
🔹 Thesis Summary
Silver remains one of the most structurally undervalued assets in the commodities space. With accelerating institutional accumulation (COT data), surging industrial demand, and constrained mine supply, this setup offers asymmetric upside into the next commodity supercycle.
🔹 Trade Setup
Bias: Long
Entry Zone: $27.00 – $38.50
Stop Loss: $10.65 (below liquidity shelf and structural invalidation)
Take-Profits:
TP1: $44.50 (previous high retest)
TP2: $64.14 (channel median + prior fib confluence)
TP3: $83.12 (partial TP near long-term resistance)
Max Target: $128.22+ (structural breakout projection)
Risk/Reward: Up to 7.5R
Timeline: Multi-year (targeting 2030–2036 commodity rotation cycle)
🔹 Narrative & Context
Silver’s current technical posture reflects a multi-decade accumulation breakout within a rising channel structure dating back to 2011. Institutional positioning confirms smart money is re-entering (per COT data), aligning with surging industrial demand from solar, electronics, and EV sectors.
From a relative value lens, the silver-to-gold ratio remains elevated, historically signaling upside reversion potential. The undervaluation is amplified by physical shortages, as indicated by U.S. Mint supply constraints and rising dealer premiums.
As a dual-purpose metal, silver benefits from both risk-off macro hedging and real-world industrial pull. It remains accessible to retail yet remains institutionally underweighted.
🔹 Macro Considerations
Tailwinds:
Global inflation persistence or fiat distrust (BRICS dedollarization)
Renewed solar/green energy investment cycles
Physical shortages or COMEX delivery strains
Fed pause or dovish pivot sustaining commodities bid
Risks:
Strong USD resurgence / higher real yields
Industrial demand substitution (e.g., graphene or other conductors)
Regulatory interventions or taxation shifts on precious metals
🔹 Forward Path
Should this thesis gain traction, a follow-up will cover:
Monthly timeframe structural pivots
Silver-to-Gold ratio mean reversion mechanics
SLV ETF flows and miner outperformance signals
Key levels to watch for parabolic breakout validation
Like & Follow for structured ideas, not signals. I post high-conviction setups here before broader narratives play out.
⚠️ Disclaimer: This is not financial advice. Always do your own research. Charts and visuals may include AI enhancements.

SILVER: Will Go Up! Long!
My dear friends,
Today we will analyse SILVER together☺️
The in-trend continuation seems likely as the current long-term trend appears to be strong, and price is holding above a key level of 41.198 So a bullish continuation seems plausible, targeting the next high. We should enter on confirmation, and place a stop-loss beyond the recent swing level.
❤️Sending you lots of Love and Hugs❤️

Silver Holding 41 — Eyes on 42.5Silver defended 41.0 well. Bias remains bullish.
• Long @ 40.99 running
• Target: 42.50
• Invalidation: Below 40.6

XAGUSD Holding Firm Above $41, Bulls Eye Higher LevelsSilver continues to consolidate after its recent strong rally, holding above the $41.00 handle while respecting its rising trendline. Recent bearish interest rate news has pressured the U.S. dollar, further boosting precious metals. With this macro tailwind, silver’s bullish structure remains intact as long as key supports hold.
🔍 Technical Analysis
Current price: $41.17.
Price has maintained momentum above the ascending trendline since August.
Immediate consolidation near recent highs signals market strength rather than exhaustion.
Multiple layered supports sit below, keeping the bullish case intact.
🛡️ Support Zones & Stop-Loss (White Lines):
🟢 $39.87 – 1H Support (High Risk)
First short-term defense.
Stop-loss: $39.52
🟡 $37.22 – 4H Support (Low Risk)
Stronger structural zone.
Stop-loss: $36.95
🟠 $34.76 – Daily Support (Long-Term Entry)
Major macro base. Attractive for longer-term positioning.
Stop-loss: $34.16
🔼 Resistance Levels:
Near-term resistance: $41.50
Break above → opens path toward $42.20 and $43.00.
🧭 Outlook
Bullish Case: Consolidation above $41.00 + breakout past $41.50 → continuation to $42+.
Bearish Case: Failure of $39.87 → correction into $37.22 or $34.76 before renewed demand.
Bias: Bullish while above $39.87 and trendline remains intact.
🌍 Fundamental Insight
Silver benefits from a dual role: a precious metal hedge against monetary easing and a key industrial input.
Bullish tailwind: Bearish U.S. rate news has weakened the dollar, lifting silver alongside gold.
Caution: Stronger-than-expected USD rebounds or risk-on sentiment could trigger pullbacks.
✅ Conclusion
XAGUSD remains in a bullish structure above $41.00, with demand stacked across multiple support zones. A break above $41.50 confirms continuation toward higher levels, while pullbacks into $39.87 or $37.22 offer attractive long setups.
⚠️ Disclaimer
This analysis is for educational purposes only and does not constitute financial, investment, or trading advice.

XAG/USD 1-Day Candle Trading PlanThis plan suggests a strategy of buying at the support level (38.687 USD) , aiming for a profit target at 41.222 USD, with a stop loss at 37.647 USD to manage risk.

SILVER TRADE SETUP CHECK NOW📉 SILVER TRADE IDEA (SILVER )
🔎 Based on technical analysis, I’m watching this Buy zone:
Potential Entry Zone: 41.13 – 41.10
Invalidation Level (Stop Loss): 41.00
Target Zones (TPs):
✔️ TP1 – 41.40
✔️ TP2 – 41.60
✔️ TP3 – 41.70
💡 This is just my personal view based on chart structure & price action. Always manage risk properly.
⚠️ Disclaimer: This is not financial advice. For educational and informational purposes only.


SILVER: Strong Growth Ahead! Long!
My dear friends,
Today we will analyse SILVER together☺️
The market is at an inflection zone and price has now reached an area around 41.252 where previous reversals or breakouts have occurred.And a price reaction that we are seeing on multiple timeframes here could signal the next move up so we can enter on confirmation, and target the next key level of 41.509.Stop-loss is recommended beyond the inflection zone.
❤️Sending you lots of Love and Hugs❤️

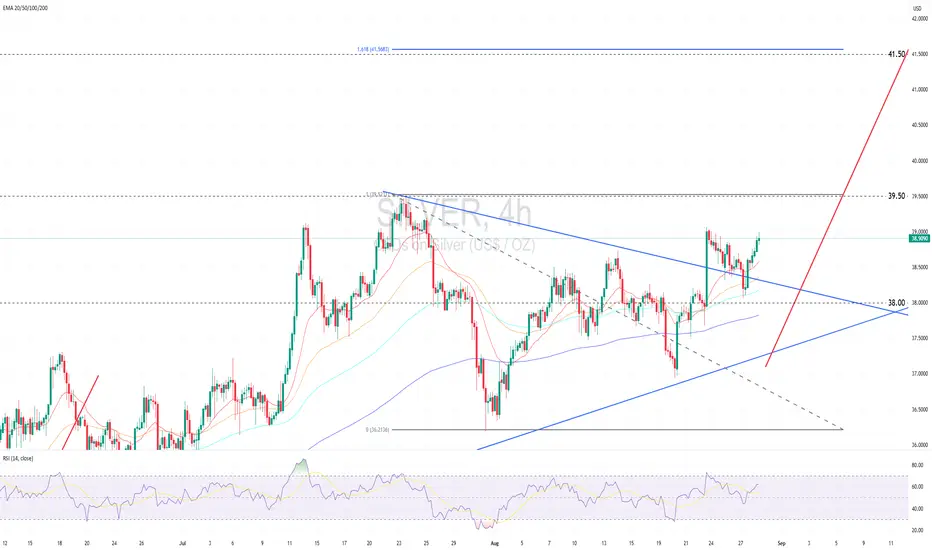
Silver shines on a mix of financial momentum and industrial streSilver shines on a mix of financial momentum and industrial strength
Technical Perspective
XAGUSD is consolidating within an ascending triangle, a continuation pattern that implies a bullish breakout post accumulation phase.
Bullish alignment of EMA cross also reinforces the positive outlook within consolidation.
Currently, XAGUSD is testing the upper boundary of the sideways range. A close above the 41.50 upper bound resistance would confirm a bullish continuation, with the next upside target at 44.80 based on the 261.8% Fibonacci retracement level.
However, failure to break above 41.50 may trigger a pullback toward the ascending trendline. A breakdown below this line would expose the key psychological support at 40.00.
Fundamental Perspective
Silver maintains a high correlation with gold, often rallying alongside it when gold prices rise.
Expectations of Fed rate cuts reduce the opportunity cost of holding silver, boosting demand.
Industrial demand remains robust, especially in solar panels, electric vehicles, and electronics, with China driving consumption. Meanwhile, years of persistent supply deficits have tightened the market, providing strong fundamental support.
Geopolitical risks and safe-haven flows attract capital into broadly precious metals including silver.
In summary, silver’s latest rally is supported by monetary easing expectations, strong industrial demand, and heightened geopolitical tensions that reinforce safe-haven demand.
Analysis by: Krisada Yoonaisil, Financial Markets Strategist at Exness

#SILVER - $3 Swing? 42 or 34.87?Date: 28-07-2205
#silver
Current Price: 38.15
Pivot Point: 38.440 Support: 37.740 Resistance: 39.145
Upside Targets:
Target 1: 39.812
Target 2: 40.480
Target 3: 41.245
Target 4: 42.010
Downside Targets:
Target 1: 37.070
Target 2: 36.400
Target 3: 35.635
Target 4: 34.870
#TradingView #Stocks #Equities #StockMarket #Investing #Trading #silver
#TechnicalAnalysis #StockCharts #Finance
#Gold #Bitcoin #Silver #TradingView #PivotPoints #SupportResistance

Spot Silver analysis
With RSI and CVD showing divergence to price, probability for a decent pullback increases. Buyers may start to become exhausted within the 41 - 40.5 range, despite strong fundamentals.
Price acceptance above VAH on the Yearly VP with a clean test of the same in confluence with the first deviation of the Yearly VWAP, indicating to a strong uptrend and suggesting a shift of value area to higher territory, with ~38.15 as the potential POC.
Price is currently sitting at the second deviation of the Yearly VWAP, suggesting an over-streched condition.
A pullback on the VAH of the Quarterly VP in confluence with the first deviation of the Quarterly VWAP and the broken resistance of 39.5, in my opinion, makes a solid long entry point as the uptrend persists, supported by strong fundamentals. If buyers, on the other hand, fail to defend 39.5, the next potential entry would be around the Quarterly VWAP and POC; however, we do have volumes accumulated just above 39.5 (~39.8), meaning that it is likely buyers will jump in to defend that zone.
In the short-term/intraday view, price continues to accept 41 as resistance despite positive news on Friday. The VAL of the Weekly VP showed consistent buyers with 40.5 and the area 40.7/75 as accepted support.
If sellers continue to defend 41 and show intention of shifting volumes lower, a break of the 40.7/75 area would indicate buyers exhaustion and a break of 40.5 would indicate sellers control. Weekly CVD shows sellers stepping in on Friday; however, one danger for a short position in the current price level is potential sellers absorption just a tick or two below 41, making it a key level for both buyers and sellers.
Overall, a pullback can be expected in Silver but it's not wise to jump in a short just yet.

Waiting to decide on silverSilver is currently in a very important supply range mpl and we should be very cautious in trading this commodity. And the most important ceilings and floors are the two red trend lines that have been drawn and I can expect an upward or downward trend with the failure of either of these.

XAGUSD - Up is the way, but how?This is the slow route
Who knows how it will go - It could blast off to 70 USD then 50 USD is the new support
Not financial advice

Divergence confirmation and a deeper correction?Silver, like gold, is also in an uptrend, but it seems to be moving more logically and with less volatility. In a trend, the less hype there is, the more reliable it becomes.
Currently, we’re seeing significant divergence and weakness in silver’s trend. We’ll have to wait and see whether this divergence gets confirmed or if the trend wants to continue on its own.
Silver (XAGUSD)– 15m | Descending Trendline & Demand BaseFOREXCOM:XAGUSD
Structure | Trend | Key Reaction Zones
Silver is trading under a descending trendline, with price rejecting from the 41.44 high. Multiple demand bases at 40.40–40.52 continue to act as support. Sellers are showing control after liquidity grabs at highs.
Market Overview
Price has been consolidating within a falling channel, with sellers pressing at each rally. Demand zones are still respected, but a decisive break below 40.40 could open further downside. Breakout above the descending trendline would flip sentiment bullish again.
Key Scenarios
✅ Bullish Case 🚀 → Bounce from 40.40–40.52 demand base could push Silver toward 🎯 40.87 and 🎯 41.06.
❌ Bearish Case 📉 → Break below 40.40 exposes 🎯 40.12 as the downside target.
Current Levels to Watch
Resistance 🔴: 40.87 / 41.06 / 41.23
Support 🟢: 40.52 / 40.40 / 40.12
⚠️ Disclaimer: For educational purposes only. Not financial advice.

SILVER: Next Move Is Down! Short!
My dear friends,
Today we will analyse SILVER together☺️
The price is near a wide key level
and the pair is approaching a significant decision level of 40.794 Therefore, a strong bearish reaction here could determine the next move down.We will watch for a confirmation candle, and then target the next key level of 40.602.Recommend Stop-loss is beyond the current level.
❤️Sending you lots of Love and Hugs❤️

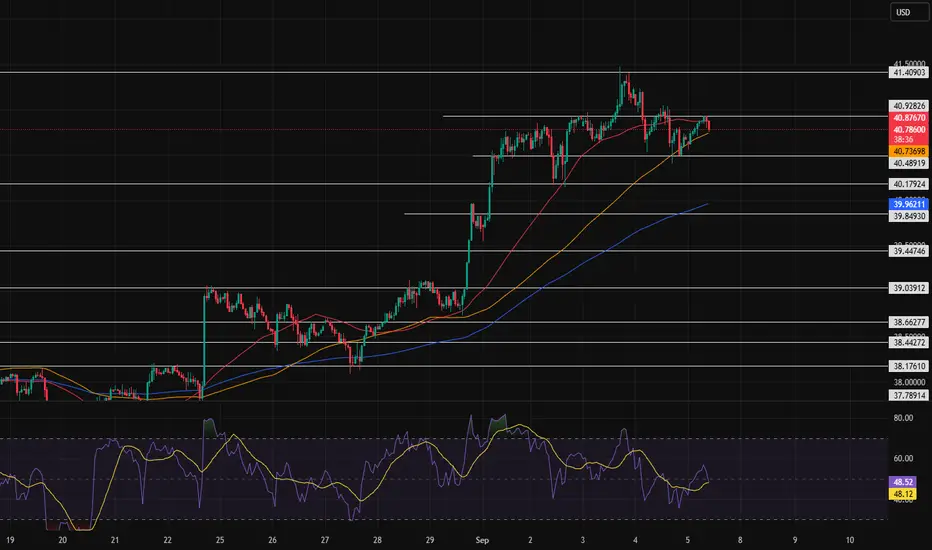
Silver Daily Analysis- Silver continues to ride its bullish momentum within an ascending channel formation.
- It is supported by dovish expectations from the Fed.
- The market has already started pricing in the September rate cuts, which weakens the dollar and provides a tailwind for precious metals.
- The Fib Extension 1.272 (41.32) is acting as a crucial immediate hurdle for bulls.
- Prices have also entered the overbought zone
- testing upper Bollinger band &
- above 70 level of RSI
- Both signaling minor corrections
- However, a clean break and sustained close above Fib Extension 1.272 level will likely fuel further upside momentum.
- On the upside, the next milestone sits near $44.0, aligning with historical resistance and the extended Fib projections.
Risk Factors:
* Failure to sustain above the 1.272 extension (41.32) could trigger profit-taking.
* A retest of the lower trend line of the channel near 39.5 or the middle Bollinger band near 38.5 could be witnessed
Short-term pullbacks are possible, but the broader bias remains bullish as long as the Fed maintains its rate-cut trajectory.

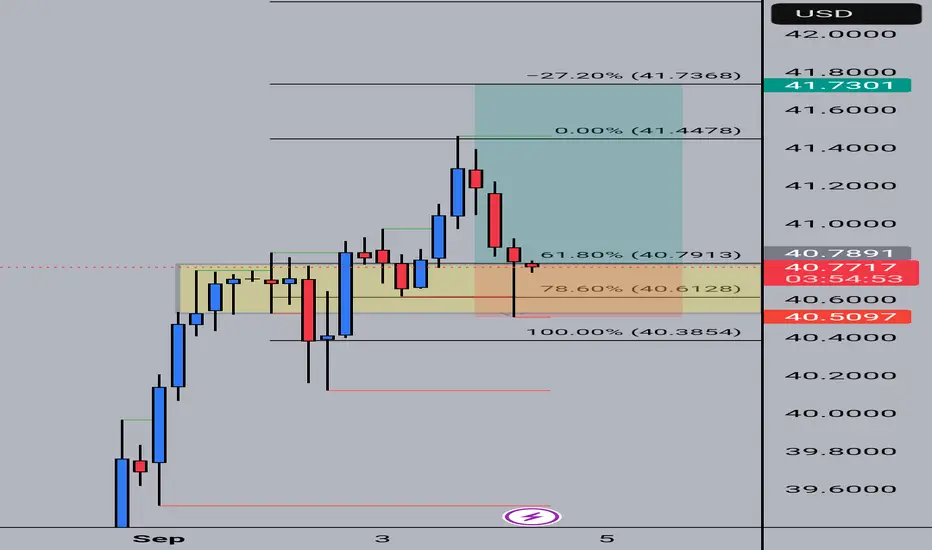
SILVER (XAG/USD) Analysis: Bullish Continuation from Retracement📜 Summary
Despite some recent volatile price action, Silver is positioning for a potential bullish continuation. The current setup suggests that the price is undergoing a healthy retracement within a larger uptrend, presenting an attractive entry point for a long position, aiming for new highs.
📊 4-Hour Chart (H4) Analysis
The 4-hour chart provides a clear view of the recent price action and the proposed bullish setup.
📈 The Bullish Impulse: The chart clearly shows a strong upward impulse wave that began at the start of September, pushing the price from below $39.00 to a high near $41.50. This indicates strong buying interest in the market.
Fibonacci Retracement: A Fibonacci tool is expertly drawn on this most recent upward leg, identifying key support zones. The price has retraced into the 61.8% (40.7913) and 78.6% (40.6128) retracement levels. These are classic areas where smart money looks for entries to join the existing trend.
Potential Reversal Point: The price action around these Fibonacci levels suggests that this could be a temporary pullback, forming a solid base for the next leg higher. We are anticipating a bounce from this zone.
💡 Trading Scenario: Long Position
The chart illustrates a potential long (buy) trade based on the expectation of a bounce and continuation of the bullish trend.
🔮 Scenario: Bullish - The retracement to key Fibonacci levels is seen as an opportunity for the uptrend to resume.
▶️ Entry: Around $40.78. This entry point is strategically placed within the strong Fibonacci retracement zone, aiming to capture the bounce.
🛡️ Stop-Loss: Placed at $40.50. This stop-loss is positioned below the 78.6% Fibonacci level and a recent swing low, providing protection if the price dips further than expected.
💰 Take Profit: The target is set significantly higher at $41.70. This target aims for a break above the previous high ($41.50) and seeks to capture a substantial continuation of the bullish move. This level aligns with a -27.20% Fibonacci extension, which is a common target for the next impulse wave.
✅ Key Considerations for this Bullish Setup
Trend Following: This setup is based on the principle of trend following, looking for pullbacks in an established uptrend.
Fibonacci Confluence: The entry point is supported by the confluence of major Fibonacci retracement levels.
Risk/Reward: The setup aims for a favorable risk/reward ratio, targeting a move significantly higher than the stop-loss distance.
Disclaimer: This analysis is for educational purposes only and should not be considered financial advice. Trading involves risks. Always conduct your own research and manage your risk effectively before placing a trade.