Silver potential drop incoming?Silver came to within whiskers of reaching $59, before easing lower in the last couple of days, and it is now disapplying a potential H&S pattern on the hourly. If the pattern's neckline at 56.45-56.50 area breaks, then we could potentially see a quick drop to the next support which comes in between $53.90 to $54.48. Within this zone, $54.22 is an interesting H1 level to watch for a potential bounce should we get to it.
By Fawad Razaqzada, market analyst with FOREX.com
Trade ideas

(XAG)Huge and definite pump of silver to $250 A huge cup and handle pattern that has now broken its established neckline after 46 years and is ready for a big growth and explosion. This pattern and price growth are consistent and directly related to all sources and fundamentals. Even the Economist report can confirm this pattern. This growth is completely consistent with the explosion of artificial intelligence, data centers, electric cars, batteries, and consumer technology. This means that the era of widespread and industrial use of silver will reach a crazy peak. A 100% pattern has given a buy signal right now, and all oscillators, indicators, and trend patterns are also giving a buy signal and an imminent explosion. This is considered a once-in-a-lifetime opportunity with very little risk.
The first definitive target will be around $250 per ounce and the long-term target will be $449 per ounce, and the risk is also minimal, which means that gold will no longer grow significantly, and the industry, stocks, funds, and ordinary people will enter a period of large-scale silver purchases, resulting in a sharp increase in silver.

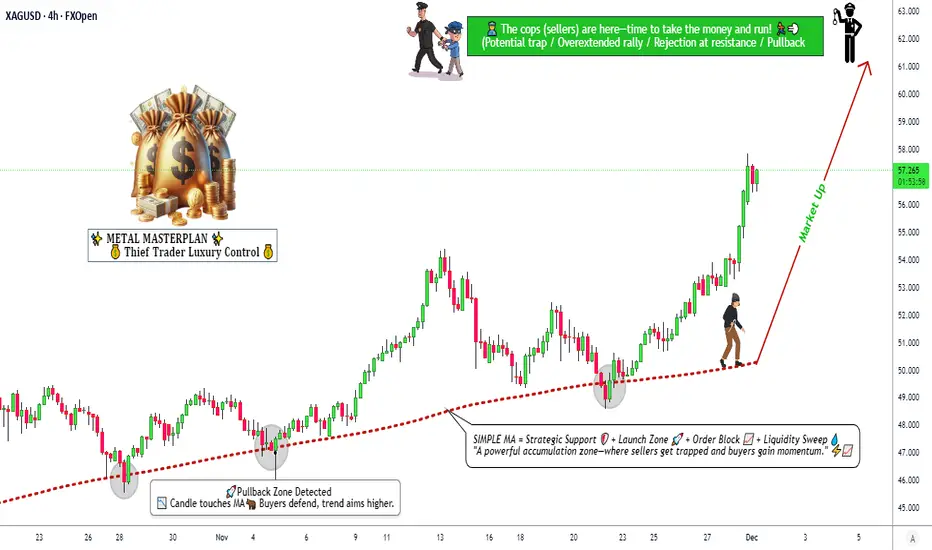
Strong Bullish Structure Developing in Silver🚀 XAG/USD (SILVER) Swing Blueprint | Bullish Structure Intact | Key Levels Mapped! ⚔️
🎯 Metals Market Opportunity: Silver (XAG/USD) Swing Trade Setup
📈 Direction: Bullish | Swing Trade
🏷 Asset: XAG/USD - Silver vs. U.S. Dollar
⚖️ Core Thesis: Silver is building a potential swing bullish structure, aiming for a significant resistance zone. This plan outlines the key framework.
📊 Trade Plan (Blueprint)
✅ Entry Zone: Consider entries on pullbacks or strength confirmation. (Any price level entry - discipline is key).
🛑 Stop Loss (Risk Management):
"This is thief SL @ 54" 💎
Dear Traders (The OG Crew), 👊
This is my protective level. YOU MUST adjust your SL based on YOUR OWN risk tolerance & strategy. I do not recommend using only my level. Manage your capital wisely.
🎯 Target Zone: @ 62 Area.
This aligns with a strong historical resistance + potential overbought/trap zone. 🪤 The strategy is to "escape with profits" as price approaches.
Note: This is my target. Take profits based on your own analysis and risk-reward goals.
🔍 Related Pairs & Market Correlations (Must-Watch) 🔗
Monitoring these pairs provides context for Silver's move:
🦅 TVC:DXY (U.S. Dollar Index):
Key Point: INVERSE correlation. A weaker TVC:DXY typically boosts commodities priced in USD, like Silver. Watch for DXY breakdowns for added Silver bullish confirmation.
🟡 XAU/USD (Gold):
Key Point: STRONG positive correlation. Gold is the leader. A strong, bullish Gold market often drags Silver higher (and vice-versa). Silver's moves can be more volatile ("Gold on steroids").
📈 US 10-Year Treasury Yields / TVC:TNX :
Key Point: General inverse relationship. Rising real yields can pressure non-yielding metals. Watch for yield pullbacks that may relieve pressure on Silver.
⛽️ Crude Oil ( BLACKBULL:WTI / ICMARKETS:XBRUSD ):
Key Point: Inflation/Commodity Sentiment Gauge. Rising oil can signal broader commodity strength and inflation fears, which can benefit Silver as a real asset.
📊 Copper ( CAPITALCOM:COPPER ) & AMEX:GDX (Gold Miners ETF):
Key Point: Industrial / Risk Sentiment. Copper confirms industrial demand outlook. AMEX:GDX strength confirms bullish precious metals sector momentum.
💎 Final Notes
This is a blueprint, not financial advice.
You are the captain of your own capital. 🧭
Always use proper position sizing.
Markets are dynamic—always monitor for structure breaks.
Let's get this bread... responsibly! 🥖
✅ Like & Follow if you find this detailed blueprint valuable! It helps the idea reach more traders. 💡
#SILVER #XAGUSD #TradingSetup #SwingTrading #Commodities #PreciousMetals #Forex #TradingView #DXY #GOLD #XAUUSD #Analysis
While Gold Stalls, Silver Eyes The 60-Record Silver has broken above a 45-year resistance, turning the 54-barrier into a potential support level moving forward. If silver continues to hold above this multi-decade structure, a new era for the metal could unfold in alignment with triple-digit long-term forecasts supported by the expansion of technology and green-energy industries — including solar panels, electric batteries, and industrial tech use cases.
From a weekly perspective, silver’s price action is aligned with the upper bound of a duplicated up-trending channel respected between August 2022 and September 2025. The 60 zone remains a key psychological resistance level — and a potential retracement trigger. Beyond that, Fibonacci extension measurements from the July 2025 low and the October 2025 high-and-low sequence outline the next upside zones near 64 and 69.
On the downside, if a reversal emerges below the daily low of 56.20 and the previous 2025 record at 54.30, retracement risks may extend toward the mid-zone of the new channel between 51.80 and 50.80. A confirmed hold below this area could pave the way for deeper declines toward 45 and 43.90 — aligning with a historical resistance zone connecting consecutive higher highs between January 2023 and October 2024, before silver possibly resumes its bullish course.
Written by Razan Hilal, CMT

Silver/USD-bullish continuation. Next target at 66$Silver is moving up with the wave 5 red which aims at the immediate target of 66$ and higher.

Don’t Ignore This Signal on SilverSilver is starting to show a clear bearish signal, and the biggest reason is the RSI divergence building on the chart. While the price kept making higher highs, the RSI failed to follow, showing lower highs and weakening momentum. This tells us that buyers are losing strength even though the price looked strong on the surface. When momentum drops before price does, it often leads to a corrective move, and silver is now sitting in that exact setup. If this divergence plays out, we could see a meaningful pullback in the coming sessions, so traders should stay cautious and watch how price reacts around key support levels.

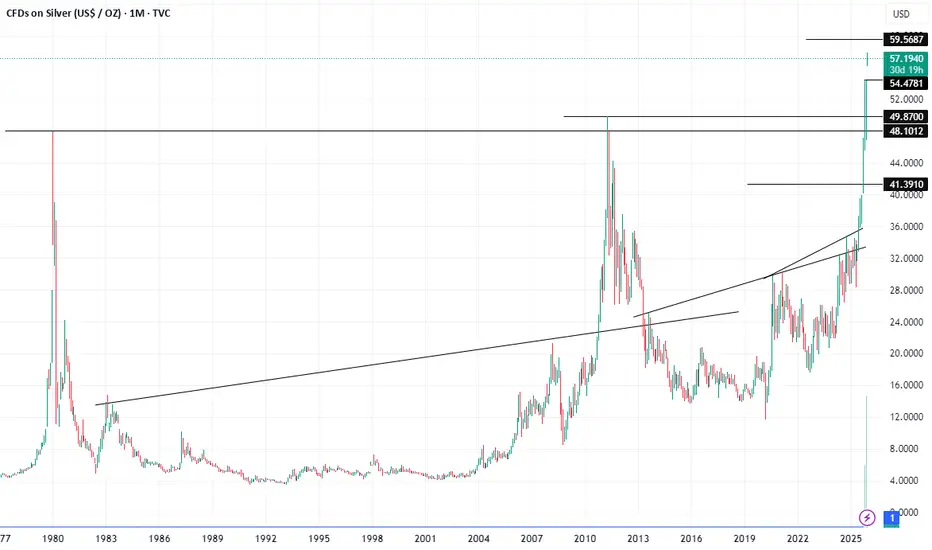
SILVER: The Mother of All Cup and Handles? 45-Year BreakoutThis analysis highlights what could be the most significant long-term technical pattern currently forming in the financial markets: a massive, multi-decade Cup and Handle formation on the silver/USD monthly chart.
The Cup (1980 – 2011)
The Cup began with the historic spike in 1980 and was completed with the rally to the same resistance level around $50 per ounce in 2011. This vast, 31-year, rounded consolidation zone represents a massive accumulation and basing phase.
The Handle (2011 – Present)
Following the 2011 peak, silver entered the "Handle" phase. This is the final consolidation period, characterized by price compression and sideways action below the key $50 resistance zone. This phase serves to shake out weak hands and build the energy required for a major long-term structural breakout.

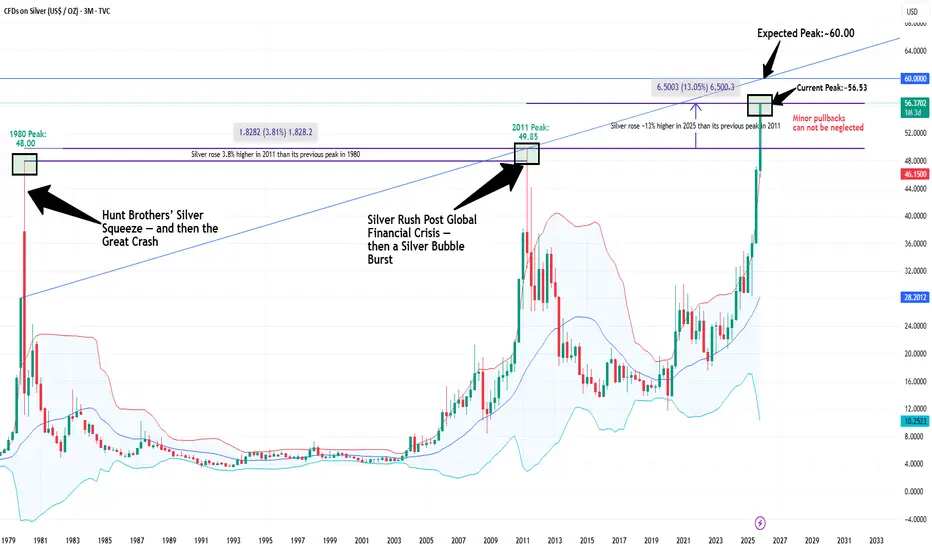
Silver is showing a historic picture: What's Next??Right now, Silver is showing a historic picture:
It has reached above the 1980 (Hunt Brother Silver Squeeze) and 2011 (GFC Silver Bubble) highs and above 55.0 for the first time in history.
But is it the climax or just an interval?????????
While everyone is debating over an "AI bubble-bursting or inflating," meanwhile, precious metals (Gold/ Silver) are crushing the markets
Tip of the Decade: Own assets or be left behind.
'Cinderella Gold' Episode 2 — Silver is Not Waiting Anymore 'Cinderella Gold' Episode 2 — Silver is Not Waiting Anymore 👑
Once upon a breakout… 📈
Back in March 2023, I dropped “Cinderella Gold Ready to Shine” — a bold claim that silver would rise from the shadows while the world watched only gold.
Fast forward to today — Silver (XAGUSD) is above $53 , and this chart doesn’t lie.
The forgotten sister of gold is no longer waiting for a dance…
She’s leading the entire ballroom now.
💥 Key Technical Levels
• $50.03 — now confirmed as new support
• $60.58 — next resistance / golden ratio (.618 fib)
• $73.24 — the “New Target” zone
• Ultimate fib expansion? $80+ is not fiction if momentum continues 🔭
This isn’t some one-day wonder. This is the result of 10+ years of structural consolidation breaking wide open.
And if you still think silver is a sidekick, you’re not reading the right story.
🧪 Why Now? The Tech-Silver Symbiosis
Most forget this:
Silver outperforms gold when technology is booming.
Why? Because unlike gold, silver isn’t just money — it’s semiconductors, solar panels, EV batteries, AI chips and the future of industry itself.
• 💻 Tech bull cycle → industrial demand skyrockets
• 🔋 Green energy transition → silver becomes critical infrastructure
• 🛠️ The macro tailwind + physical scarcity = explosive upside
🧠 Food for Thought 🍃
When tech runs hot, silver runs hotter.
It’s the metal that reflects not just fear — but progress.
Gold is the vault.
Silver is the spark.
One Love,
The FXPROFESSOR 💙
⚠️ Disclaimer
Disclaimer: These are my personal thoughts on the market. They are not financial advice. Every trade is your responsibility. Manage your risk and protect your capital.

SILVER AT MULTI DECADE HIGHSilver has broken 46 years high one can go long with target of 85 with stop 45.

XAG/USD DailyThe final day of trading last week saw buyers smash through the 54.00 barrier which has been a ceiling for the precious metal in late October and early November.
The question now is can the buyers maintain price above the level?
Look for a trade that meets your strategy rules.

XAGUSDThis chart and analysis are shared for educational purposes only.
Nothing here should be taken as financial advice.
Please conduct your own analysis before taking any buy or sell trades.

Silver prices surge due to the supply tightnessSilver briefly hit another record high at 78, then stabilized at above 57 due to the concern over the lack of supply in LME and SHFE. Meanwhile, demand from not only Solar PV but also EV and data center continues to surge, putting more pressure on the storage.
Meanwhile, China’s silver exports hit a record 660 tons in Oct, underscoring strong demand amid tightening global supply.
However, the gold/silver ratio fell to 74, near the average 25-year of 69, which could limit the rally.
XAGUSD rebounded from EMA21 and formed higher swings within the ascending channel. Diverging bullish EMAs reinforce its uptrend.
A break above the channel’s upper bound near 60.00 could prompt a rally toward the potential resistance at 63.00.
By Van Ha Trinh - Financial Market Strategis at Exness

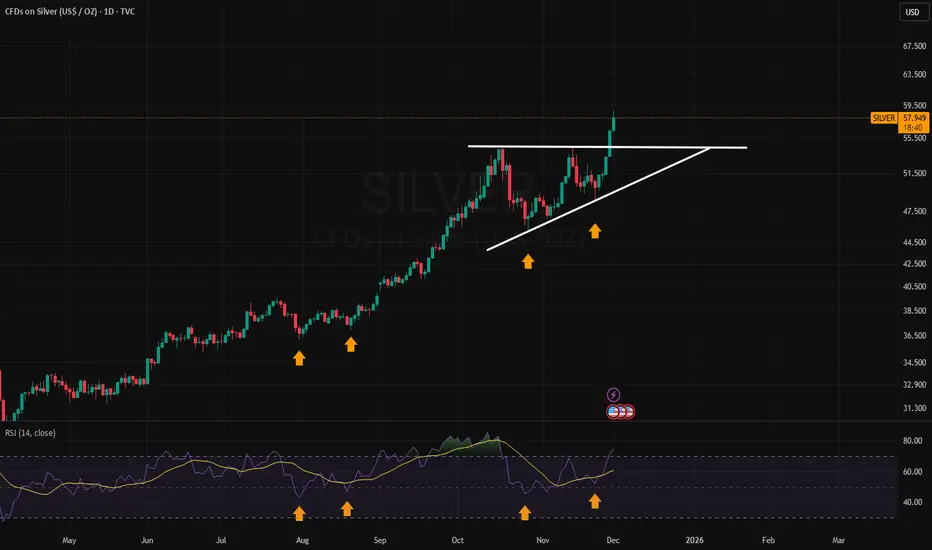
More follow through, bullishSilver has continued with strong follow through after breaking out of ascending triangle. This is bullish behavior. A retest of the $54.50 area is very plausible. Intraday high was $58.84, still under $60 which is a psycological area that likely will act as a magnet.
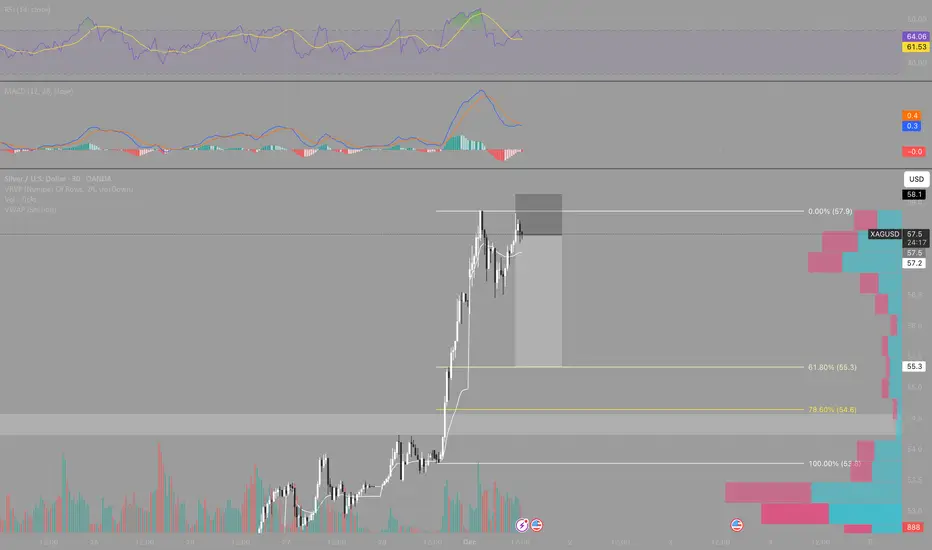
Small scalpy-XAGUSD – Tactical short idea inside a still bullishThis is not a high-probability setup, but it is a tactical idea that can offer a good risk-to-reward with small risk: price is at resistance after a very vertical move, showing signs of exhaustion and some confluence with a potential bounce on the DXY.
The plan is a low-risk short with attractive R:R:
• Entry around the current rejection / highs.
• Tight stop above the recent high.
• Targets at corrective levels (VWAP / volume nodes / Fibonacci retracements of the last bullish leg).
The point is not to “catch the final top”, but to exploit a possible corrective move inside a broader uptrend on the higher timeframes.
In fact, the ideal scenario would be that this correction actually develops, so that:
1. Price and RSI can cool down from these extended levels.
2. A clear, confirmed support forms (reaction in price, volume, clean rejection).
3. Then we can look for long entries aligned with the main trend, with a much better structure and lower squeeze risk.
In short: the current short is a speculative trade with controlled risk and good potential R:R, but the higher-probability plan is still to let the correction play out and join the long side from a solid support.
Silver bullish breakout, previous resistance - new supportThe Silver remains in a bullish trend, with recent price action showing signs of a corrective pullback within the broader uptrend.
Support Zone: 5420 – a key level from previous consolidation. Price is currently testing or approaching this level.
A bullish rebound from 5420 would confirm ongoing upside momentum, with potential targets at:
5875 – initial resistance
6000 – psychological and structural level
6106 – extended resistance on the longer-term chart
Bearish Scenario:
A confirmed break and daily close below 5420 would weaken the bullish outlook and suggest deeper downside risk toward:
5350 – minor support
5275 – stronger support and potential demand zone
Outlook:
Bullish bias remains intact while the Silver holds above 5420. A sustained break below this level could shift momentum to the downside in the short term.
This communication is for informational purposes only and should not be viewed as any form of recommendation as to a particular course of action or as investment advice. It is not intended as an offer or solicitation for the purchase or sale of any financial instrument or as an official confirmation of any transaction. Opinions, estimates and assumptions expressed herein are made as of the date of this communication and are subject to change without notice. This communication has been prepared based upon information, including market prices, data and other information, believed to be reliable; however, Trade Nation does not warrant its completeness or accuracy. All market prices and market data contained in or attached to this communication are indicative and subject to change without notice.

Silver Historical High - intraday Analysis 01-Dec-2025Silver prices reached a new all time high supported by several fundamental factors:
* Fed rate cut expectations which are currently at 90% that we will have rate cut in Dec-25 meeting.
* Demand on Silver especially that its used in production related to technology and AI.
In this video, we mark several area of interest we will be monitoring in the upcoming days/weeks.
Disclaimer: easyMarkets Account on TradingView allows you to combine easyMarkets industry leading conditions, regulated trading and tight fixed spreads with TradingView's powerful social network for traders, advanced charting and analytics. Access no slippage on limit orders, tight fixed spreads, negative balance protection, no hidden fees or commission, and seamless integration.
Any opinions, news, research, analyses, prices, other information, or links to third-party sites contained on this website are provided on an "as-is" basis, are intended only to be informative, is not an advice nor a recommendation, nor research, or a record of our trading prices, or an offer of, or solicitation for a transaction in any financial instrument and thus should not be treated as such. The information provided does not involve any specific investment objectives, financial situation and needs of any specific person who may receive it. Please be aware, that past performance is not a reliable indicator of future performance and/or results. Past Performance or Forward-looking scenarios based upon the reasonable beliefs of the third-party provider are not a guarantee of future performance. Actual results may differ materially from those anticipated in forward-looking or past performance statements. easyMarkets makes no representation or warranty and assumes no liability as to the accuracy or completeness of the information provided, nor any loss arising from any investment based on a recommendation, forecast or any information supplied by any third-party.
Risk Warning: 74% of retail investor accounts lose money when trading CFDs with this provider. You should consider whether you can afford to take the high risk of losing your money. Please refer to our full risk disclaimer on our website.

SILVER Will Grow! Long!
Here is our detailed technical review for SILVER.
Time Frame: 17h
Current Trend: Bullish
Sentiment: Oversold (based on 7-period RSI)
Forecast: Bullish
The market is testing a major horizontal structure 5,240.5.
Taking into consideration the structure & trend analysis, I believe that the market will reach 5,614.1 level soon.
P.S
Please, note that an oversold/overbought condition can last for a long time, and therefore being oversold/overbought doesn't mean a price rally will come soon, or at all.
Like and subscribe and comment my ideas if you enjoy them!

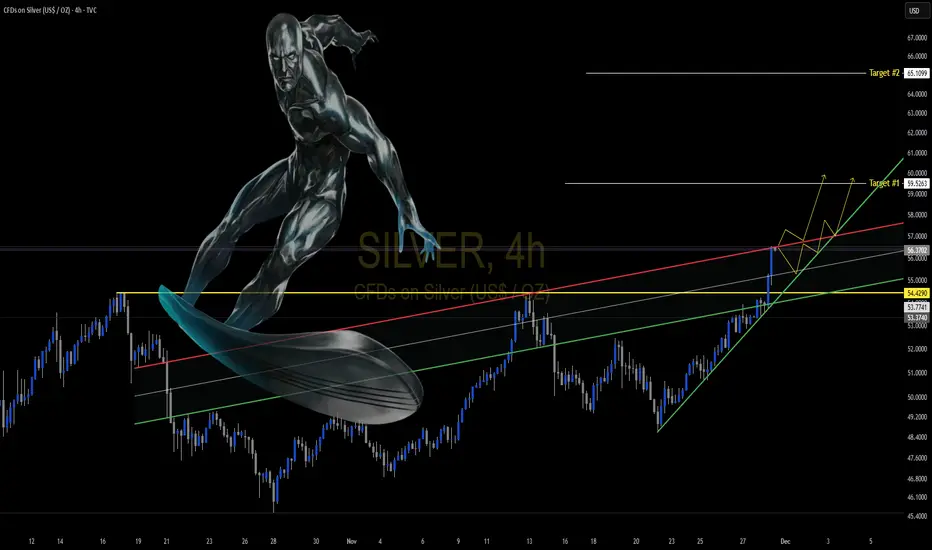
Silver Cup & Handle PatternWe had a very bullish push. Looking for a possible pullback and launch into the target #1 level.
SILVER: Forecast & Trading Plan
Remember that we can not, and should not impose our will on the market but rather listen to its whims and make profit by following it. And thus shall be done today on the SILVER pair which is likely to be pushed down by the bears so we will sell!
Disclosure: I am part of Trade Nation's Influencer program and receive a monthly fee for using their TradingView charts in my analysis.
❤️ Please, support our work with like & comment! ❤️

SIlver (XAGUSD) Next Buying Move SetupIf price fails to break the down-trendline and gives rejection (like bearish candle wick around
This is the first support from your chart.
Strong zone shown in your chart (Support Area).
Reasoning Based on Your Chart
Price is inside a descending triangle/pattern.
Support zone is highlighted below.
A rejection from the trendline gives a safe short entry.
Safe Trading Notes
Wait for confirmation candle at the resistance.
Avoid selling inside the support zone.
Please kindly Support with Boost and Comment i will be Glad i need your valueable feedback

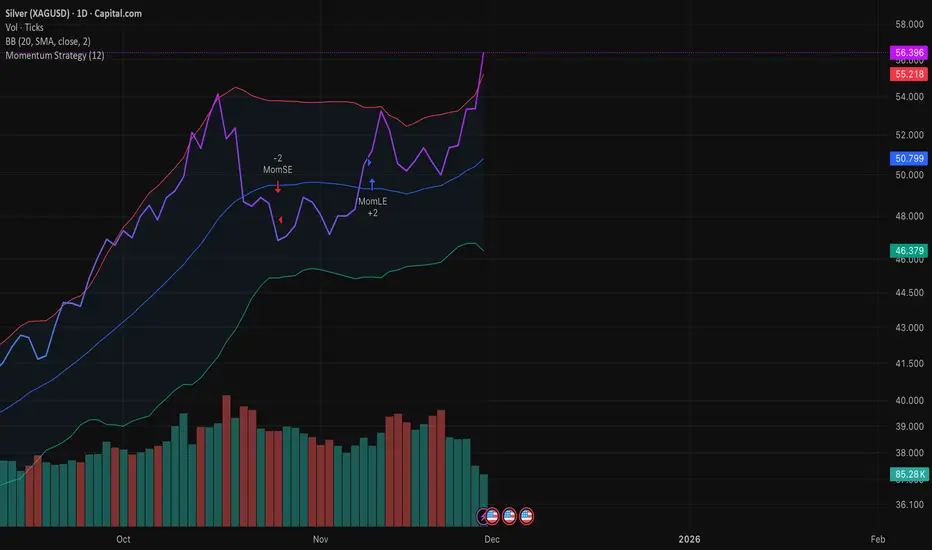
Silver price actionSreeni, you mentioned that if price is rising but volumes are falling, then we should not buy or rather it is a sell signal. In this graph, silver's price rose on Thursday and Friday but volumes are falling. What does this say?