The Silver Era Has Begun – Major Breakout in Silver/SPX RatioThe long-awaited breakout in the Silver vs S&P 500 ratio is now confirmed.
The latest pullback validated the retest of the multi-year downtrend, and today’s move officially establishes a new bullish structural cycle.
Why This Matters
For the last 14 years, capital overwhelmingly favored the S&P 500 — the “fastest horse” in global markets.
The breakout in the Silver/SPX ratio signals the beginning of a capital rotation away from overvalued equities and back into real assets, especially industrial and monetary metals.
Macro Drivers Behind the New Silver Cycle
5 consecutive years of structural deficit – demand consistently outpacing supply.
Silver added to the U.S. critical minerals list.
Central banks quietly accumulating silver for the first time in decades.
LBMA inventories at historic lows, reducing available liquidity.
Mining supply is constrained, with silver mostly produced as a by-product.
Weakening Western currencies push capital into tangible assets.
Exploding industrial demand, especially from next-gen solar technologies (TOPCon/HJT).
A looming supply cliff – few new discoveries and long development timelines.
Growing middle class in India & SE Asia driving record demand for jewelry and investment.
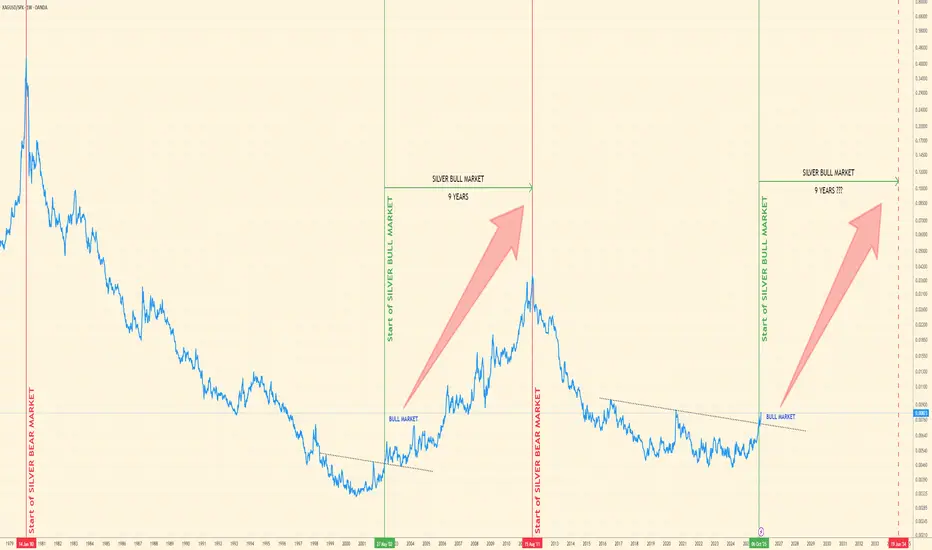
Cyclical Outlook
History suggests clear structural cycles:
Bear market: 1980–2002 (22 years)
Bull market: 2002–2011 (9 years)
In the last cycle, leading silver miners gained roughly 10x. Many miners already doubled from the 2022–2023 lows. If the pattern repeats, the current cycle (2025–2034?) could still deliver significant upside.
This cycle may even be faster and stronger, driven by exponential industrial demand and a fragile equity market dominated by a handful of megacap stocks.
Gold/Silver Ratio Signals Further Upside
Silver remains deeply undervalued relative to gold.
A move toward 62:1, and later 30:1, looks increasingly realistic based on technical structure.
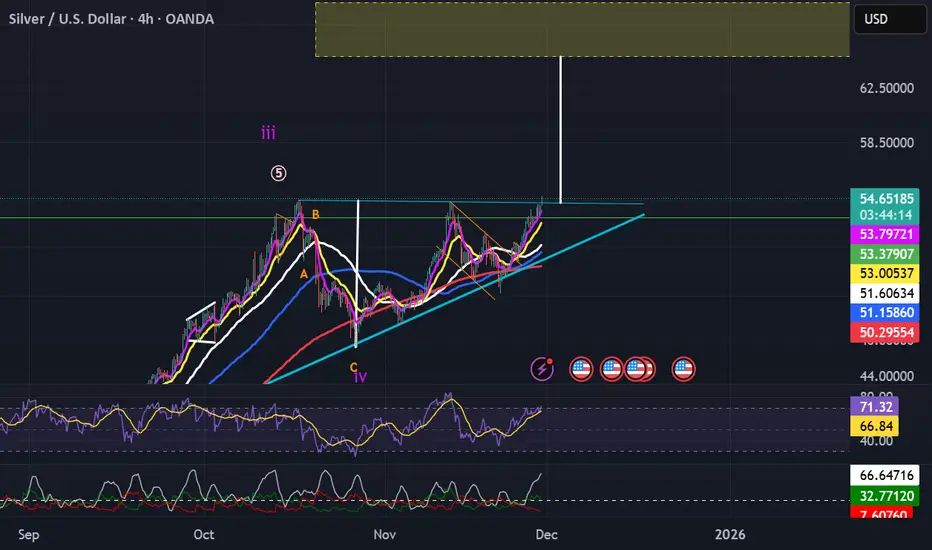
Technical Setup – $62.66 First Target
On the 4H chart, silver has confirmed a Cup & Handle breakout, projecting a short-term target of $62.66 — likely just a waypoint on the path toward $100+ if the macro cycle unfolds as expected.
Conclusion
Silver is entering a new secular bull market supported by macro forces, tightening supply, and strong technical confirmation.
The coming years could be highly volatile, but extremely rewarding for holders of real assets.
This is not investment advice — always do your own research.
Trade ideas
Silver Current target 77$
Last time we corrected *59% in 274 days .
And it took 912 days ( 480%) to the new high .
I see a similar scenario
( if we reach 77$)
Wich is the target for this cup&handle break out on silver .
274 days from 77$-33$ (-59%)
912 days from 33$-173$ ( + 440%)
I expect 77$ somewhere from jan - feb 26’

Silver (XAGUSD) Breaks a 14-Year Ceiling — Rounding Bottom Targe🌐 Market Context
Silver has just completed one of the most significant structural breakouts in modern commodity history. After consolidating for nearly 14 years beneath the 2011 high, price has surged through the multi-decade barrier at $50, launching into a new secular markup phase.
The current monthly candle shows extremely strong momentum, placing Silver firmly into price discovery, with volatility expanding and sentiment shifting from skepticism to early optimism.
🔍 Technical Analysis
📌 1. Completed 14-Year Rounding Bottom Pattern
Your chart clearly illustrates a massive Rounding Bottom that has been forming since the 2011 peak around ~$49.80. This long-duration base indicates extensive accumulation and supply absorption, as described in your analysis .
📌 2. Clean Breakout Above Historical Top
Silver has broken and closed above the historical April 2011 top, with price currently sitting near $56.50.
The breakout comes with strong volume expansion, validating institutional participation — a key signal emphasized in the PDF’s breakout mechanics section .
📌 3. Retest Zone / Golden Zone
Your chart marks a Golden Zone between ~$50.5 and ~$52.8.
This aligns with classical TA: former resistance → new support. Any pullback to this zone is structurally bullish.
📌 4. Projection Targets
Your overlay shows a Target Zone between ~$72 and ~$80, with an extended target of ~$87–$88.
These are consistent with:
Measured Move target ($86.40)
1.618 and 2.618 Fibonacci Extensions
Inflation-adjusted historical equivalents (implying plenty of room overhead)
📌 5. Price Behavior
The monthly chart shows:
Strong breakout candles
No meaningful upper wick → buyers firmly in control
No overhead market structure → pure price discovery
🎯 Bias: Strongly Bullish
The confluence of a completed 14-year base, a decisive breakout above a historic ceiling, and “Blue Sky” Fibonacci confluence gives this setup a high-conviction bullish bias.
As long as Silver remains above the $50–$52 support flip, the breakout structure remains intact.
🧭 Trade Plan / Setup (Not Financial Advice)
Potential Entries
Aggressive: Current market zone ($55–56)
Conservative: Pullback into the Golden Zone ($50.5–$52.8)
Breakout Continuation: Weekly close above $56.60 (Fib trigger)
Invalidation / Stop Ideas
Structural invalidation only if monthly closes below $46 (Handle top)
Short-term invalidation: daily close below $51
Targets
TP1: $65
TP2: $72–$75 (1.618 major extension)
TP3: $86 (measured move target)
Parabolic Extension: $100+ (2.618 fib; price discovery thesis)
These align with your projection models and analysis tables in the PDF .
📝 Summary / Final Thoughts
Silver has officially entered the early stages of a secular bull cycle after resolving a decade-plus consolidation. The breakout above $50 is not just a technical event — it’s the ignition point of a structural repricing supported by volume, pattern completion, and long-term fundamentals.
With no historical resistance ahead, Silver is now operating in open sky territory, where momentum, psychology, and algorithmic reactions can drive powerful and extended rallies.
This is one of the cleanest large-timeframe breakout structures currently visible across global markets.

Silver View (Contra Bias)Silver has rallied sharply and currently at LTH.
Price has now reached Long-Term Highs with sentiment turning aggressively bullish - exactly where risk asymmetry starts to flip.
Crowded bullish sentiment + overhead supply.
We can see a correction 30% atleast from these levels. $56–58.
Not a recommendation — just my contra positioning thought.
#Silver #Metals #CommodityTrading #Contrarian #TechnicalAnalysis #RiskReward

Official new high on SPOT mktsWe have an official new high on spot silver...accoring to my TV account, the silver futures is still down and not trading...I am very curious as to what shennanigans they have planned for us when the futures mkts reopen. As for me...I remain heavily long the metals and miners!
Silver start down trendCharting price action, anticipating completion of wave C within an ABC correction of a larger WXY pattern.
Looking to sell at the current price of 53.870, with a stop loss at 54.00. Confirmation upon a 1-hour close below 53.150.
Target: 50.500.

Silver’s Massive Cup & Handle Breakout After years of sideways frustration, silver is finally showing signs of life again. The metal has broken above the handle of a massive multi-decade Cup & Handle pattern, stretching all the way back to the 1980 peak and the subsequent 2011 high.
On the technical front, this breakout is textbook. The rounded base formed over several decades reflects deep accumulation and a structural bottom. The handle — which lasted more than a decade — represented the final phase of consolidation before a new bullish leg. Now that silver has cleared this resistance zone, momentum is building fast.
From a measured-move perspective, the breakout projects potential targets that could push silver into levels not seen in decades. Historically, patterns of this scale don’t play out overnight — they often unfold over several years — but they can define the next major trend.
Fundamentally, the story fits perfectly with the chart:
Global industrial demand for silver (especially from solar, EV, and tech sectors) is at record highs.
The supply deficit has widened for a third consecutive year.
And with central banks pivoting toward easier monetary policy, the environment for precious metals looks highly supportive.
Technically, the key zones to watch are:
Support: $32–34 — the breakout retest area (handle resistance now turned support).
Upside Targets: $50 (2020 high), followed by $75–80 on a long-term horizon if momentum persists.
Invalidation: A weekly close back below $30 would call the breakout into question.
The combination of bullish structure and macro tailwinds makes this one of the more compelling setups in the commodities space right now.

WOULD YOU TAKE THIS SHORT ON SILVER ? after a W shape the silveer will try to break this historical resistence aiming for a new all time highs , as the uncertainty in the crypto in obvious ; commodities will tend to compensate reatailers fears and take part of the market bull run

XAGUSD 4h
As the previous analysis, XAG broke the resistance area with a strong full body candle in 4h and hit ATH. we are in a bullish channel.

$65-70 likelyUnless the shenanigals at the CME manage to create a major dump this morning (After they closed the futures market overnight) then I see a major breakout coming! I see $65+ in a measured move ...if...they do not slam it this morning! I thinkg they are likely tring to organize a major short by the big boys...but lets see!

Silver trying to break 45 YEARS horizontal resistance at $54 !!!Silver trying to break 45 YEARS horizontal resistance at $54 today !!! I made a prediction it would reach $54 by 26 Nov, but didn't quite there yet. Once $54 resistance is broken, silver will revalue itself between $100-$200 within 2 quarters. It's going to be an epic jaw dropping move.
Don't leverage/trade with margin... silver short term volatile moves will wipe you off financially for good. Buy the real bullion or ETF long term. Good luck silver stackers...

SilverXAGUSD
- Bullish Channel as an corrective pattern in Long Time Frame
- Change of Characteristics
- Break of Structure
- Completed " 12345 " Impulsive Waves
- Demand Zone

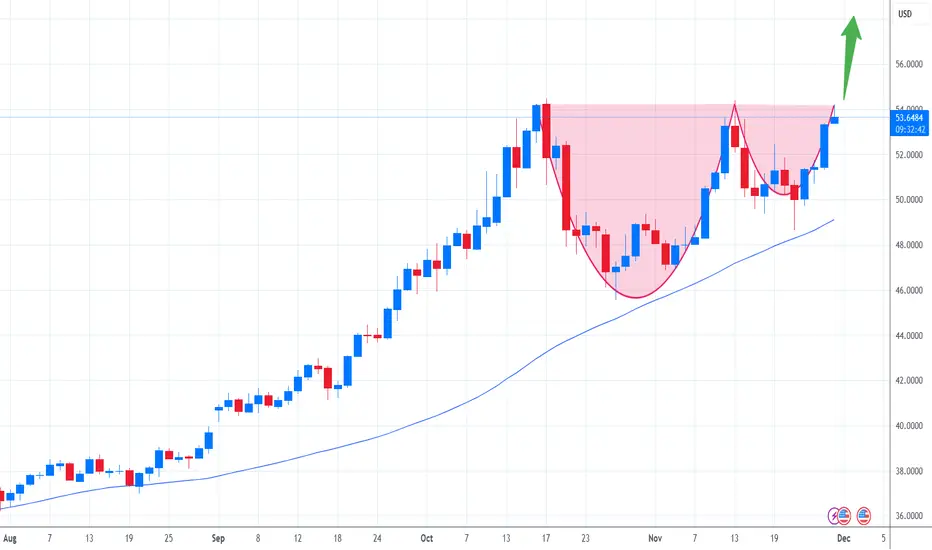
Silver Turning Positive – Breakout Ahead?Silver is gaining traction again as dollar weakness offers fresh support and buyers step back into the market. On the daily chart, the cup-and-handle formation is becoming more pronounced, and the current upward push raises the question of whether a clean breakout is finally underway. The key level to watch remains the USD 54.50 zone, as a decisive close above it could clear the path for a stronger bullish move.
A softer dollar environment continues to help, as it improves global purchasing power and often attracts fresh flows into precious metals. At the same time, improving inflation expectations keep silver relevant as a hedge, especially with investors preparing for potential policy shifts later in the year. The industrial side of the story also matters: demand from solar, electronics, and EV-related sectors remains strong, and any upbeat economic indicators could reinforce the case for higher prices. When equities trade in a risk-on mood, silver tends to benefit as part of the broader commodities cycle, and that dynamic is currently in play as well.
If the breakout fails, the tone could shift quickly. Weak economic data would raise concerns about industrial demand, while a rebound in the dollar or rising bond yields could cap momentum. These factors, combined with the possibility of profit taking after a solid run, might pull silver lower again. Still, as long as major support levels hold, the market keeps a constructive bias, and a confirmed breakout above 54.50 would likely be the trigger for the next strong leg higher.
New Name, New Year, New War: Venezuelan invasion coming soon? The Trump administration has made its intentions toward Nicolás Maduro clear. Removing the Venezuelan president is a stated goal, but the path the administration is willing to take remains uncertain.
A former U.S. ambassador to Venezuela has described the deployment of American ground troops as a “last option”, but anything is possible with Trump and his newly named Department of War.
Washington has already seized a tanker carrying Venezuelan crude and is preparing to intercept additional shipments. Also, the U.S. has carried out more than twenty strikes on vessels it claims were involved in drug-smuggling operations. Each step raises the risk of a broader confrontation.
Metal markets might rally on escalation. Silver remains in a strong vertical trend. The move above 63 pushed price into fresh record territory before a modest pullback. Gold has broken through the recent range and printed a new swing high near $4,285 before pulling back.
Any significant development in Venezuela, such as a new seizure or a military operation, could trigger a higher open in metals when markets resume.

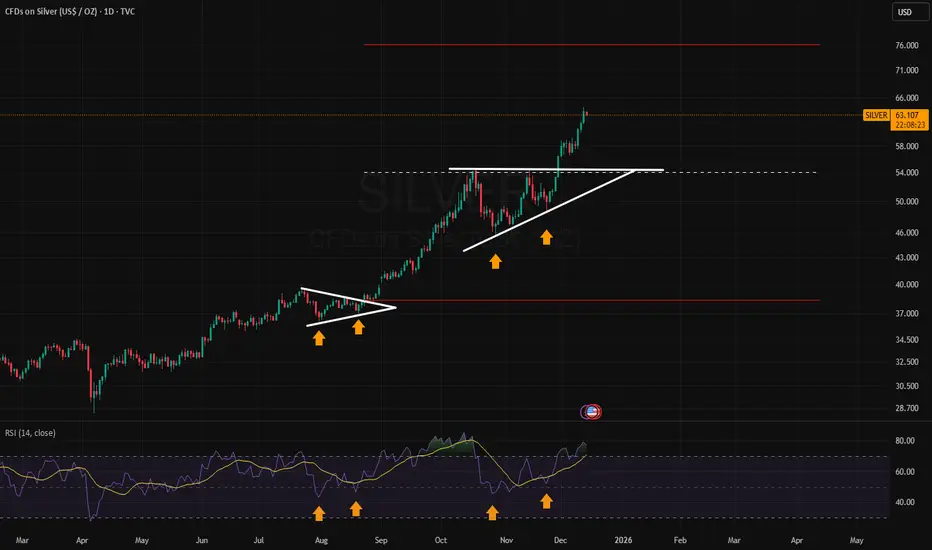
Potential target of $76 for silver on breakoutSilver has broken out of an ascending triangle with strength. Watch for RSI to become embedded in the overbought condition. Potential price target is $76 for this pattern to play out.
Grok Analysis of Gold/Silver Ratio - 4 month Price TargetsI asked Grok: Gold and silver 4 months price targets using Gold-silver ratio analysis of m2.
Grok: Gold Target $4,800 +13%
Grok: Silver Target: $70 +35%
Grok 4 month Summary
Thought for: 4m 33s
These targets align with a distribution of expert forecasts, which range from $4,000-5,500 for gold and $45-100 for silver in early 2026, but are specifically adjusted using the M2 and ratio framework. Risks include faster-than-expected M2 contraction (e.g., due to Fed policy) or geopolitical events accelerating precious metals demand. Not financial Advice

68-70 Near About & Eventually 94-9868-70 Near About & Eventually 94-98 #Silver.
Mind - Ascend won't be vertical.

Silver looks like it may finally b ready 2 confirm the c&h breakI feel like at the very least price action s ready to continue up to the dotted red emasured move lines target from a pattern we broke up from some time ago. SO next stop should be around $71 dollars. What it does after that is anyones guess but it does seem like probability is high that it will be validating the cup and handle breakout the neckline of which is shown here in green. You cant grasp from this picture just how high the dotted green measured move line goes for the cup and handle breakout but even after it reaches the dotted red measured move target here to reach the dotted green one it would still have to 10x or so. So obviously validating the cup and handle breakout here would be massively bullish. *not financial advice*

Silver/Platinum ChartThe chart dissects the nature of the bull run till now. With Silver/Platinum also playing catch up for IWM and such. These would have similiar time pivots and basically the red box to green box is my prediction.

SIlver: March 2020 cycle to extend to $66 Next?Silver strong impulse sequence has now entered the 224%-261.8% at 59.22-66.29 marking an advanced wave ((3)). Watch out for the wave ((4)) pullback at this zone. However, buy the dip in the 30min/H1 charts until the sub-waves of (5) of ((3)) are completed.


Silver flipped on RBA Rate decisionXAGUSD showed it hand last Friday, it was showing the market its strength to move higher.
Today Tuesday it does that , 2 lines horizontal above to watch. Second white line is ALT, watch for a move higher if triggered.
* Infomercial only. Not investment advice.

Silver weakness 2Hr ChartSilver XAGUSD still has big future profit opportunity, but its big run the past few months is coming off.
2Hr chart reveals this weakness & shorting possible under its 50ems on the 2HR chart.
