Silver is in the Bearish trend after testing ResistanceHello Traders
In This Chart XAGUSD HOURLY Forex Forecast By FOREX PLANET
today XAGUSD analysis 👆
🟢This Chart includes_ (XAGUSD market update)
🟢What is The Next Opportunity on XAGUSD Market
🟢how to Enter to the Valid Entry With Assurance Profit
This CHART is For Trader's that Want to Improve Their Technical Analysis Skills and Their Trading By Understanding How To Analyze The Market Using Multiple Timeframes and Understanding The Bigger Picture on the Charts
SILVER trade ideas

Silver | Long Setup | Industrial Demand Breakout | Aug 27, 2025📌 XAGUSD | Long Setup | Historic Undervaluation + Industrial Demand Breakout | Aug 27, 2025
ROI: $160M
Risk: $5.7M
🔹 Thesis Summary
Silver remains one of the most structurally undervalued assets in the commodities space. With accelerating institutional accumulation (COT data), surging industrial demand, and constrained mine supply, this setup offers asymmetric upside into the next commodity supercycle.
🔹 Trade Setup
Bias: Long
Entry Zone: $27.00 – $38.50
Stop Loss: $10.65 (below liquidity shelf and structural invalidation)
Take-Profits:
TP1: $44.50 (previous high retest)
TP2: $64.14 (channel median + prior fib confluence)
TP3: $83.12 (partial TP near long-term resistance)
Max Target: $128.22+ (structural breakout projection)
Risk/Reward: Up to 7.5R
Timeline: Multi-year (targeting 2030–2036 commodity rotation cycle)
🔹 Narrative & Context
Silver’s current technical posture reflects a multi-decade accumulation breakout within a rising channel structure dating back to 2011. Institutional positioning confirms smart money is re-entering (per COT data), aligning with surging industrial demand from solar, electronics, and EV sectors.
From a relative value lens, the silver-to-gold ratio remains elevated, historically signaling upside reversion potential. The undervaluation is amplified by physical shortages, as indicated by U.S. Mint supply constraints and rising dealer premiums.
As a dual-purpose metal, silver benefits from both risk-off macro hedging and real-world industrial pull. It remains accessible to retail yet remains institutionally underweighted.
🔹 Macro Considerations
Tailwinds:
Global inflation persistence or fiat distrust (BRICS dedollarization)
Renewed solar/green energy investment cycles
Physical shortages or COMEX delivery strains
Fed pause or dovish pivot sustaining commodities bid
Risks:
Strong USD resurgence / higher real yields
Industrial demand substitution (e.g., graphene or other conductors)
Regulatory interventions or taxation shifts on precious metals
🔹 Forward Path
Should this thesis gain traction, a follow-up will cover:
Monthly timeframe structural pivots
Silver-to-Gold ratio mean reversion mechanics
SLV ETF flows and miner outperformance signals
Key levels to watch for parabolic breakout validation
Like & Follow for structured ideas, not signals. I post high-conviction setups here before broader narratives play out.
⚠️ Disclaimer: This is not financial advice. Always do your own research. Charts and visuals may include AI enhancements.

Silver (XAGUSD) – Cup & Handle on the Monthly ChartSilver (XAGUSD) – Cup & Handle on the Monthly Chart
🔹 Technical Overview
The long-term chart of Silver shows the development of a massive Cup & Handle pattern.
The “cup” formed from the 1980 peak down to the 1990s lows, followed by a long recovery to retest the 2011 highs.
Price is now trading in the potential handle phase, consolidating in the 38–39 USD zone.
🔹 Key Levels
Major Support (long-term): 3.47 – 4.00 USD.
Strategic Support: 26–30 USD zone.
Major Resistance: 48.00 USD – neckline of the pattern.
Targets if breakout confirms:
First target: 161 USD.
Extended target: 616–664 USD (ultra long-term).
🔹 Interpretation
As long as price remains below 48.00, the breakout is not confirmed.
A monthly close above 48.00 would validate the Cup & Handle formation and open the door to much higher levels.
If price loses the 26–30 USD zone, the bullish scenario is weakened and may be delayed.
🔹 Conclusion
Silver is at a critical long-term inflection point.
A confirmed breakout above 48 USD could trigger one of the largest bullish waves in its history, while failure to break out keeps price locked in a wide consolidation.
📝 Quick Key Points
📊 Long-term Cup & Handle formation.
📍 Major support: 3.47–4.00 USD.
📍 Critical resistance: 48.00 USD.
🎯 Breakout targets: 161 → 616+ USD.
⚠️ Loss of 26–30 USD weakens the bullish case.

SILVER: Bears Are Winning! Short!
My dear friends,
Today we will analyse SILVER together☺️
The price is near a wide key level
and the pair is approaching a significant decision level of 38.341 Therefore, a strong bearish reaction here could determine the next move down.We will watch for a confirmation candle, and then target the next key level of 38.225.Recommend Stop-loss is beyond the current level.
❤️Sending you lots of Love and Hugs❤️

SILVER GROWTH AHEAD|LONG|
✅SILVER will be retesting
A support level soon around 38.30$
From where I am expecting a bullish reaction
With the price going up but we need
To wait for a reversal pattern to form
Before entering the trade, so that we
Get a higher success probability of the trade
LONG🚀
✅Like and subscribe to never miss a new idea!✅

SILVER What Next? SELL!
My dear friends,
SILVER looks like it will make a good move, and here are the details:
The market is trading on 38.882 pivot level.
Bias - Bearish
Technical Indicators: Supper Trend generates a clear short signal while Pivot Point HL is currently determining the overall Bearish trend of the market.
Goal - 38.270
About Used Indicators:
Pivot points are a great way to identify areas of support and resistance, but they work best when combined with other kinds of technical analysis
Disclosure: I am part of Trade Nation's Influencer program and receive a monthly fee for using their TradingView charts in my analysis.
———————————
WISH YOU ALL LUCK

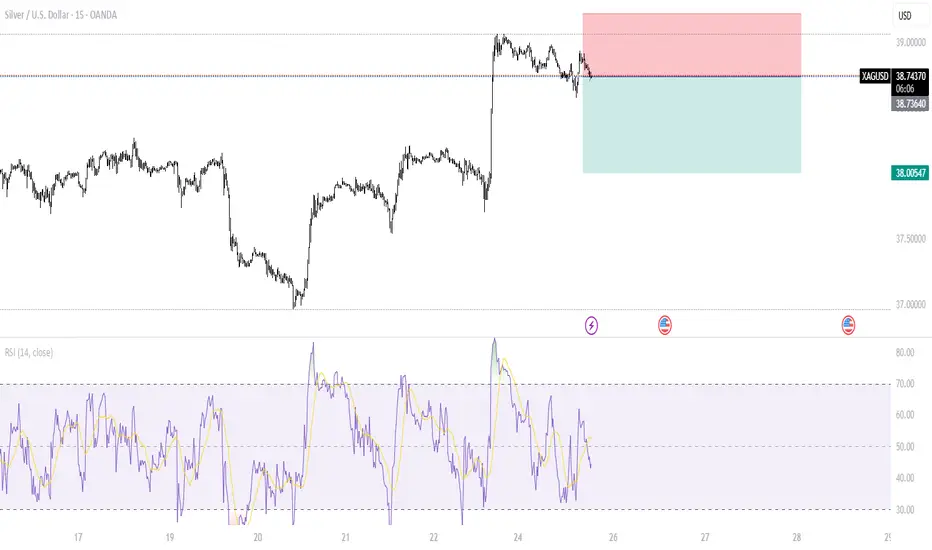
Silver (XAG/USD) Technical AnalysisThe price of silver is in a strong overall uptrend, with a downward corrective movement on the hourly timeframe. It's currently testing a support area at $38.40.
Bearish Scenario: If the $38.40 support area is broken and the price holds below it, it could push the price toward $38.00.
Bullish Scenario: If the price rebounds from the support area and successfully breaks above $38.70, closing above this level could support an ascent to retest the $39.00 area or even test $39.40.

LONG TERM AND MEDIUM TERM BIAS FOR SILVER
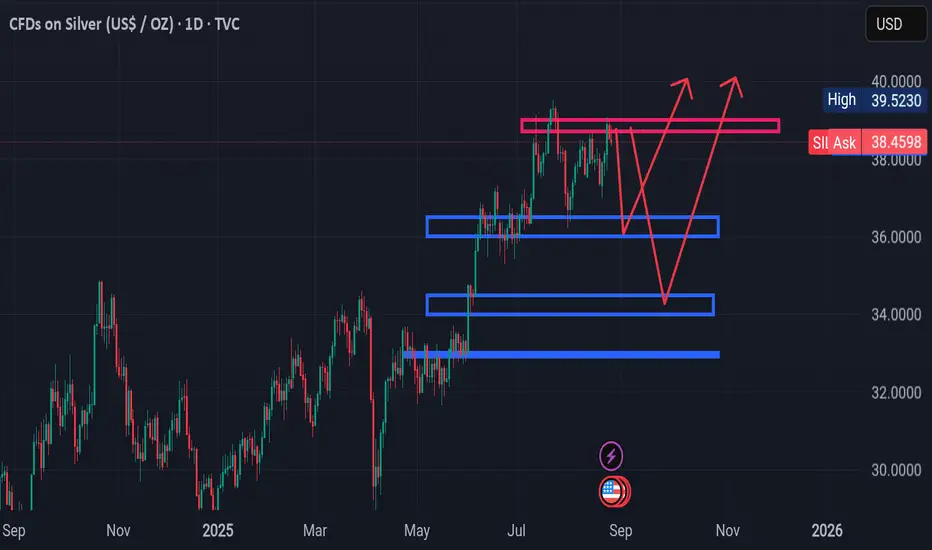
1. Key Levels Marked
Red Zone (Resistance / Supply Zone ~39.00 – 38.70):
Price has tested this zone multiple times but struggled to break above.
This shows strong selling pressure or profit-taking around here.
Blue Zones (Demand / Support Zones):
36.00 – 36.50: First strong demand block. This is where buyers previously defended and pushed price up.
34.00 – 34.50: Next accumulation/support zone. If price breaks below 36, this is the next strong liquidity area.
32.90 – 33.00: Deeper structural support, where strong rallies originated.
---
2. Market Structure
Currently, price is range-bound between 37.80 – 39.20.
The trend is upward on higher timeframes, but Silver is consolidating near resistance.
Multiple liquidity sweeps happened around 39.10 (fake breakouts that reversed down), showing that big players are selling into buying pressure.
---
3. Volume Context
Volume spikes are visible around upward pushes, but recent moves into 39 zone are with lower conviction → possible distribution phase before a pullback.
---
4. Possible Scenarios
Bearish Case (More Likely in Short-Term):
If price keeps rejecting the 39.10 resistance, expect a pullback first to 36.50 zone.
A clean break of 36.00 could send price down toward 34.60 support.
Bullish Case (If Resistance Breaks):
If Silver breaks and closes above 39.20 with strong volume, next rally target could be 40.50 – 41.00.
This would invalidate near-term shorts and signal trend continuation.
---
5. Trading Bias
Short-term: Bearish (sell from resistance, target 36.50).
Medium-term: Neutral to bullish as long as 34.00 holds.
Key Invalidations: A daily close above 39.20 kills the bearish short-term setup.
---
✅ Summary:
Silver (XAGUSD) is consolidating below a heavy resistance (39.10). Until that zone breaks, bias favors short setups targeting 36.50 and possibly 34.60. A confirmed breakout above 39.20 would flip bias back to bullish toward 41.
LONG TERM AND MEDIUM TERM BIAS FOR SILVER Here’s my breakdown of your XAU/USD (Gold, Daily timeframe) chart:
---
1. Price Context
Current price: $3372.57.
The chart shows gold in a strong uptrend from late 2024, but recently it’s been consolidating sideways in a range.
Consolidation is happening between $3300 – $3410, which means price is coiling and building liquidity before the next breakout.
---
2. Key Zones Marked on Chart
Red Zones (Supply / Sell Areas):
3412 – 3467: A higher supply zone where strong sellers may step in.
3350 – 3412: A nearer supply zone that price has been rejecting multiple times.
→ These zones are potential short entry areas if price shows weakness after testing them.
Blue Zones (Demand / Buy Areas):
3301 – 3310: Closest demand zone, currently acting as support.
3191 – 3135: Mid-level demand zone, stronger if the first support fails.
2970 – 3025: Deep demand zone, major swing support where large buyers may step in.
→ These zones are possible long entry areas if price dips into them.
---
3. Market Structure
Price is ranging with repeated rejection at $3410–$3420 (resistance).
Support is firm at $3300.
A breakout either side will likely lead to a strong trend continuation:
Break above $3412 → rally toward $3467 and beyond.
Break below $3300 → drop toward $3190 and possibly $2970.
---
4. Trading Bias
Since gold has been in a macro uptrend, the overall bias is still bullish.
However, near-term, this sideways range shows accumulation/distribution—meaning institutions may be building positions before the next move.
Strategy outlook:
Aggressive sellers: Can short inside 3410–3467 with stop above 3470, target 3300.
Buyers: Better to wait for a dip into 3300 or 3190 demand zones for safer long entries, with targets back toward 3410 and 3467.
---
✅ In short:
Immediate bias = Neutral / Range-bound (3300–3412).
Bigger picture bias = Bullish unless 3300 and 3190 break cleanly.
Watch for liquidity grab (false breakout) around 3412 or 3300 before the real move.

SILVER: Strong Bullish Sentiment! Long!
My dear friends,
Today we will analyse SILVER together☺️
The market is at an inflection zone and price has now reached an area around 38.677 where previous reversals or breakouts have occurred.And a price reaction that we are seeing on multiple timeframes here could signal the next move up so we can enter on confirmation, and target the next key level of 38.812.Stop-loss is recommended beyond the inflection zone.
❤️Sending you lots of Love and Hugs❤️
Silver Daily NEOWAVE Analysis Since its sharp decline of over 15% in April 2025, Silver has been unfolding in a Running Contracting Triangle. The market is currently advancing in Wave D, with Wave E expected to complete the structure. Once Wave B concludes, a bullish thrust to the upside is anticipated; however, failure to materialize could indicate the development of an X-wave instead.

Buy Plan – Silver (XAGUSD)🟢 Buy Plan – Silver (XAGUSD)
Price has already reacted from the H4 demand zone (highlighted in blue).
A higher timeframe target (Weekly) and an intermediate H4 target are marked above, showing liquidity magnets.
Current structure suggests price is consolidating after a sharp rejection from the lows.
📌 Conditions for Entry
Wait for price to hold above the dealing range low (blue horizontal line).
Look for a bullish fair value gap or market structure shift on the lower timeframe (5m–15m) inside this range.
Entry should be taken from the bullish dealing range when momentum aligns with HTF direction.
🎯 Context
Bias: Bullish (aiming for H4 target, then Weekly liquidity).
Reasoning: Price swept liquidity on the downside and left an imbalance; upside liquidity now acts as magnet.
Validation: Entry valid only if price forms a bullish dealing range within the current consolidation.

SILVER ABOUT TO SHOOT UP?!Previous and current trend-Uptrend
full analysis breakdown- As we can see price broke are Major Low, giving us a new Lower low but somehow failed to breakthrough that Lower Low(previous low) which shows us that buyers are stronger than sellers.
Price proceeded to make new highs, (FHH) and New Higher High and broke above these levels and made a retest to the new Higher high, we can anticipate this as a start of Impulsive move and expect the price to rise, as it's already in an uptrend and we have strong buyers
Kindly follow for more technical analysis😉


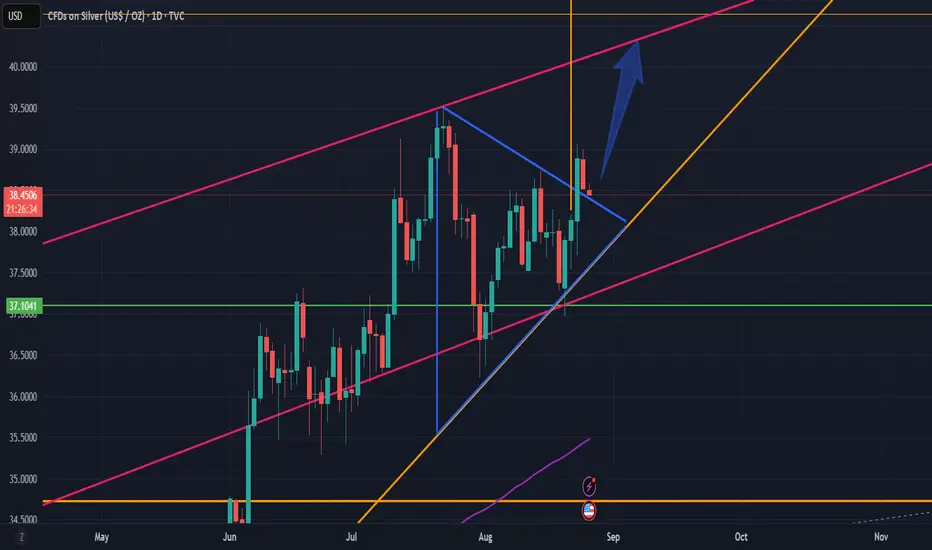
Silver to break $40 by early SeptSilver to break $40 by early Sept. It broke the consolidation triangle within a price channel. I would put everything on it (no leverage, just ETF or physical). Once it breaks the 45 yrs cup & handle pattern, it will give you a life changing fortune.
XAGUSD (1H) – Trend Breakout & Key Reaction Zones SILVERFOREXCOM:XAGUSD
Structure | Trend | Key Reaction Zones
Strong trend breakout from consolidation supported by aggressive buying.
Price tapped near 39.00 resistance and is now pulling back.
Current supports: 38.70 (EMA 50) and 38.20–38.30 rejection zone.
Market Overview
Silver rallied sharply after holding the 37.00 demand zone.
Now testing the 38.70 EMA 50 support – stability here could fuel another push toward 39.00+.
Failure to hold may drag price into the rejection zone for retest.
Key Scenarios
Bullish Case 🚀
Holding above 38.70 support.
🎯 Target 1: 39.00
🎯 Target 2: 39.40–39.60 liquidity zone
Bearish Case 🔻
Rejection below 38.70 leads to deeper retracement.
🎯 Target 1: 38.30 rejection zone
🎯 Target 2: 37.00 demand zone
Current Levels to Watch
Resistance: 39.00 → 39.60
Support: 38.70 → 38.30 → 37.00
⚠️ Disclaimer: This analysis is for educational purposes only. Not financial advice.


XAGUSDSilver appears to be overbought, the long term trend is bullish but I believe we could see silver pullback to the downside for short retracement, RR 1:1.5
SILVER: Move Down Expected! Short!
My dear friends,
Today we will analyse SILVER together☺️
The in-trend continuation seems likely as the current long-term trend appears to be strong, and price is holding below a key level of 38.918 So a bearish continuation seems plausible, targeting the next low. We should enter on confirmation, and place a stop-loss beyond the recent swing level.
❤️Sending you lots of Love and Hugs❤️

Silver bullish continuation supported at 3830The Silver remains in a bullish trend, with recent price action showing signs of a continuation breakout within the broader uptrend.
Support Zone: 3830 – a key level from previous consolidation. Price is currently testing or approaching this level.
A bullish rebound from 3830 would confirm ongoing upside momentum, with potential targets at:
3965 – initial resistance
4000 – psychological and structural level
4040 – extended resistance on the longer-term chart
Bearish Scenario:
A confirmed break and daily close below 3830 would weaken the bullish outlook and suggest deeper downside risk toward:
3800 – minor support
3755 – stronger support and potential demand zone
Outlook:
Bullish bias remains intact while the silver holds above 3830. A sustained break below this level could shift momentum to the downside in the short term.
This communication is for informational purposes only and should not be viewed as any form of recommendation as to a particular course of action or as investment advice. It is not intended as an offer or solicitation for the purchase or sale of any financial instrument or as an official confirmation of any transaction. Opinions, estimates and assumptions expressed herein are made as of the date of this communication and are subject to change without notice. This communication has been prepared based upon information, including market prices, data and other information, believed to be reliable; however, Trade Nation does not warrant its completeness or accuracy. All market prices and market data contained in or attached to this communication are indicative and subject to change without notice.

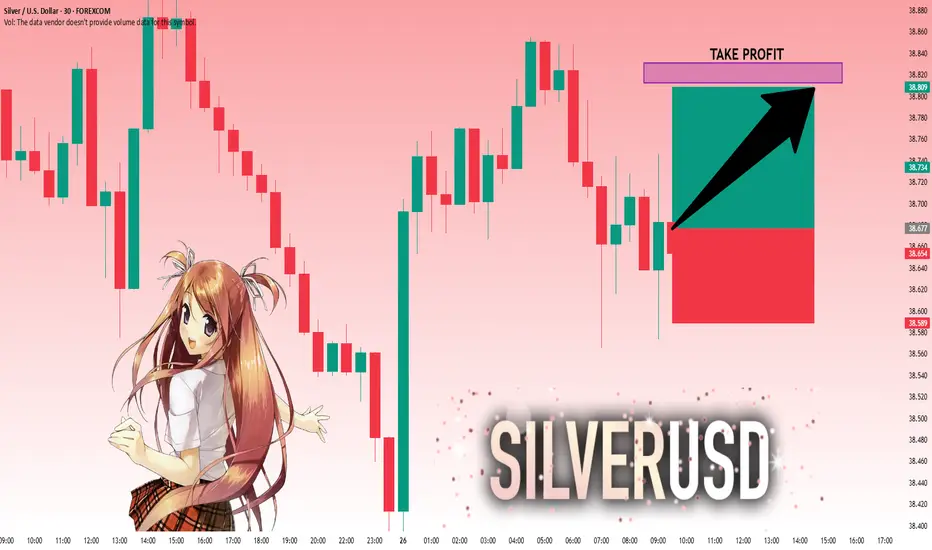
A Short-Term Bearish OutlookIt seems the holiday of life is over. The market responded to Powell's Friday speech with a decent rise, but there was no significant movement, and in fact, it closed below 39.
Today, we’re already starting to drop.
Entering a short position seems reasonable; I think we should decline to the 50-day moving average, possibly even lower, but for now, the target is 37.35.
There’s no ammunition for continued growth, and it doesn’t seem to be coming anytime soon.
The chart setup is not looking particularly positive.
Short-term, the short idea is quite solid.
📝Trading Plan
🟢Entry: From the current level
🔴Stop: 39.10
🎯Target: 37.35

SILVER BEST PLACE TO SELL FROM|SHORT
SILVER SIGNAL
Trade Direction: short
Entry Level: 3,880.2
Target Level: 3,627.7
Stop Loss: 4,048.6
RISK PROFILE
Risk level: medium
Suggested risk: 1%
Timeframe: 1D
Disclosure: I am part of Trade Nation's Influencer program and receive a monthly fee for using their TradingView charts in my analysis.
✅LIKE AND COMMENT MY IDEAS✅

XAGUSD SELLI’m expecting further weakness in Silver (XAG/USD) with a downside target at 37.81808. Price momentum favors sellers, and I’ll remain short-biased as long as the market holds below recent resistance. Stops should be placed above the latest swing high to control risk.
