SILVER: Bearish Continuation & Short Trade
SILVER
- Classic bearish pattern
- Our team expects retracement
SUGGESTED TRADE:
Swing Trade
Sell SILVER
Entry - 58.349
Stop - 58.743
Take - 57.644
Our Risk - 1%
Start protection of your profits from lower levels
Disclosure: I am part of Trade Nation's Influencer program and receive a monthly fee for using their TradingView charts in my analysis.
❤️ Please, support our work with like & comment! ❤️
Trade ideas

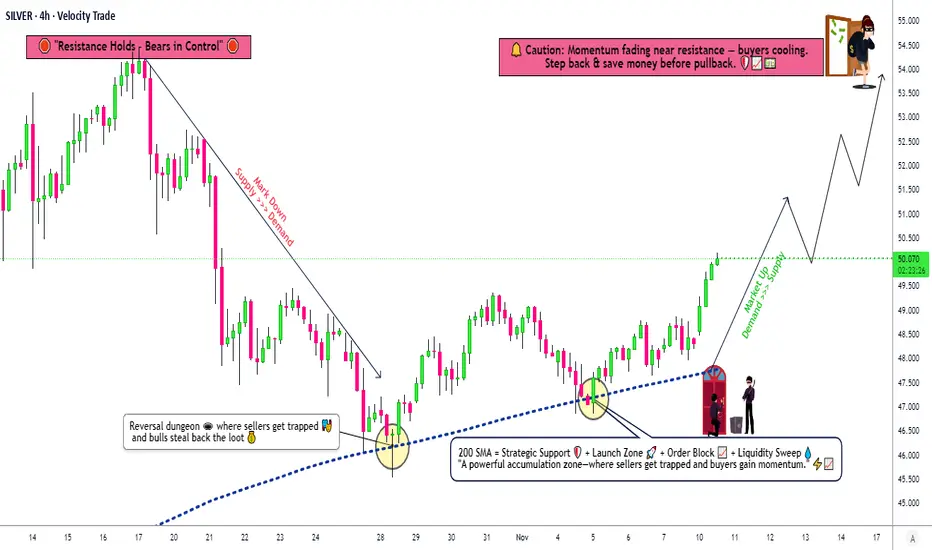
XAG/USD Key Zone Reaction – Are Bulls Ready to Take Control?🥈 XAGUSD: SILVER VS US DOLLAR 💰
Metals Market Opportunity Blueprint | Swing Trade Analysis
📊 MARKET STRUCTURE & SETUP
✅ Current Price Action: $48.34 | 52-Week Range: $28.16 - $54.50
✅ Technical Trend: Bullish Bias Confirmed
✅ Setup Type: Double Pullback Retest of 200 SMA
🎯 THE THIEF STRATEGY: LAYERED ENTRY APPROACH
This is NOT a single entry point strategy. We employ the THIEF LAYERING METHODOLOGY — multiple limit orders positioned at strategic support zones to maximize entry efficiency and reduce average entry price.
📍 ENTRY LAYERS (Buy Limit Orders):
Layer 1: $48.000 ⭐ (Immediate Support)
Layer 2: $48.500 ⭐ (Pullback Zone)
Layer 3: $49.000 ⭐ (Resistance Break)
Layer 4: $49.500 ⭐ (Extended Support)
💡 Pro Tip: You can increase/decrease layers based on your risk tolerance and position size. Accumulate, don't dump!
🛑 STOP LOSS MANAGEMENT
📌 Thief Original SL: $47.000
⚠️ This is MY suggested level based on technical structure
🔴 IMPORTANT: Dear Ladies & Gentlemen (Thief OG's) — Set YOUR OWN stop loss based on YOUR risk profile
💪 This is YOUR money, YOUR risk, YOUR decision
Adjust SL based on your strategy, account size, and risk/reward ratio
🚀 PROFIT TARGET STRATEGY
🎪 Target Zone: $54.000
📈 Technical Basis: 200 SMA acts as strong dynamic resistance
⚡ Market Structure: Overbought territory warning
🔔 Trap Alert: Potential sell-side liquidity trap at resistance
⚠️ Target Notes:
🔴 IMPORTANT: Dear Ladies & Gentlemen (Thief OG's) — Set YOUR OWN take profit target
📊 Don't just copy my TP blindly — analyze price action yourself
💼 You earn the profits, you manage the exit — YOUR choice, YOUR reward
Consider trailing stops or partial profit-taking strategy
🔗 CORRELATED PAIRS TO MONITOR (Key Dollar Pairs)
1️⃣ TVC:DXY (US Dollar Index)
Correlation: INVERSE ↔️ As DXY strengthens, XAG/USD weakens
Why Monitor: Strong dollar headwind for silver prices
Watch Level: DXY above 105.00 = bearish for silver
Strategy: If DXY rallies, reduce silver long positions
2️⃣ $XAU/USD (Gold vs Dollar)
Correlation: POSITIVE ✅ Silver follows gold's lead
Why Monitor: Gold is the "big brother" in precious metals
Watch Level: If gold breaks $2,100, silver likely follows
Strategy: Gold weakness = caution on silver longs
3️⃣ FX:EURUSD (Euro vs Dollar)
Correlation: INVERSE ↔️ Weak dollar = strong euro
Why Monitor: Dollar weakness supports precious metals
Watch Level: EURUSD above 1.1200 = bullish for silver
Strategy: Strong euro environment = tailwind for XAG
4️⃣ FX:USDJPY (Dollar vs Japanese Yen)
Correlation: INVERSE ↔️ Dollar weakness supports risk-on sentiment
Why Monitor: Risk appetite indicator (yen often "fear" currency)
Watch Level: USDJPY below 145.00 = risk-on (silver bullish)
Strategy: Lower USDJPY = better environment for commodities
5️⃣ SP:SPX / S&P 500 Index
Correlation: POSITIVE ✅ Risk-on markets support commodities
Why Monitor: Stock market rallies often lift precious metals
Watch Level: SPX new highs = bullish momentum for silver
Strategy: Market strength = broader bullish sentiment
📋 TRADE CHECKLIST BEFORE ENTRY
✅ Price action confirms double pullback on 200 SMA
✅ DXY showing weakness or neutral bias
✅ XAU/USD supporting bullish thesis
✅ No major macro events in next 4-6 hours
✅ Volume confirmation on breakout
✅ Risk/Reward ratio minimum 1:2
✅ Position size = % of account (YOUR decision)
⚡ KEY TRADING RULES
Layering ≠ Averaging Down Losers
Build positions at PRE-PLANNED levels only
Don't add to losing positions outside your strategy
Stop Loss is Sacred
NO moving stops to breakeven without reason
Protect capital first, chase profits second
Take Profits Strategically
Partial exits: Scale out at resistance zones
Don't go all-in, don't take all-out at once
Dollar Monitoring is Mandatory
Strong DXY = reconsider position
Weak DXY = stay long with conviction
Risk Management Over Everything
Your SL & TP = your rules
No trade is worth emotional decision-making
XAGUSD Long Positioning Headed into FOMCLooking H1 time frame wise closest demand zone around 57.900 is right below Irochimoku cloud, RSI coming it to test and possibly bounce from 50 level, Stochastic RSI in oversold area with a 21/50 SMA cross below price. Were seeing a lot of bullish confluence here if we do end up getting that steeper pullback I would be looking for longs around 57 with a 2 candle swing conformation.

xagusd 1h🔹 Overall Outlook and Potential Price Movements
In the charts above, we have outlined the overall outlook and possible price movement paths.
As shown, each analysis highlights a key support or resistance zone near the current market price. The market’s reaction to these zones — whether a breakout or rejection — will likely determine the next direction of the price toward the specified levels.
⚠️ Important Note:
The purpose of these trading perspectives is to identify key upcoming price levels and assess potential market reactions. The provided analyses are not trading signals in any way.
✅ Recommendation for Use:
To make effective use of these analyses, it is advised to manually draw the marked zones on your chart. Then, on the 5-minute time frame, monitor the candlestick behavior and look for valid entry triggers before making any trading decisions.


A lil bit of UJ analysisHere is a bit of UJ analysis for the purpose of educating on how price moves through the matrix.
I cover aspects of liquidity and efficiency.
I hope you find it useful.
- R2F Trading

SILVER REBOUND AHEAD|LONG|
✅ SILVER price is reacting off the anchored demand block, with displacement showing early signs of bullish orderflow returning.
A liquidity sweep beneath intraday lows suggests engineered sell-side delivery before a corrective move higher into the target zone.Time Frame 1H.
LONG🚀
✅Like and subscribe to never miss a new idea!✅

Silver (XAG/USD) – 4H Technical OutlookSilver (XAG/USD) – 4H Technical Outlook
Silver is currently sitting right on the red bullish trendline, which is the main structure holding this entire uptrend together. This level is the pivot that will decide whether the market continues its bullish run or enters a deeper correction.
Bullish Scenario
If price bounces cleanly from the red trendline, we can expect momentum to shift back upward toward the next key level at 59.528.
A strong rejection here would signal continuation of the bullish structure, opening the door for new highs above the recent peak.
Bearish Scenario
If price breaks and closes below the red trendline, this will invalidate the short-term bullish structure.
That break would likely trigger a deep correction, with the first liquidity target sitting around 54.575 (yellow zone).
Key Note
From this exact zone, both outcomes are on the table — either a new high is born from a trendline bounce, or a structural correction begins from a confirmed trendline break. Traders should wait for confirmation before choosing a direction.

Silver is in the Bullish directionHello Traders
In This Chart XAGUSD HOURLY Forex Forecast By FOREX PLANET
today XAGUSD analysis 👆
🟢This Chart includes_ (XAGUSD market update)
🟢What is The Next Opportunity on XAGUSD Market
🟢how to Enter to the Valid Entry With Assurance Profit
This CHART is For Trader's that Want to Improve Their Technical Analysis Skills and Their Trading By Understanding How To Analyze The Market Using Multiple Timeframes and Understanding The Bigger Picture on the Charts

Silver might continue after a record monthly gainSilver is likely to be 2025’s best performing major CFD after a series of short squeezes, record inflows to London and generally tightening supplies around the world. Monetary policy remains in focus, with the Fed very likely to cut on 10 December and most participants expecting two or three cuts in 2026.
The 261.8% monthly Fibonacci extension which coincides with the dynamic support of the 100 SMA is likely to be an important area in the event of a deep retracement. The main short-term supports are likely to be dynamic, the 20 and 50 SMAs.
Current strong overbought signals from Bollinger Bands and the slow stochastic might make it risky to buy in immediately. $60 as a round number is an obvious candidate for resistance; beyond this the 423.6% monthly Fibo around $63.15 is another. Given volumes for CFDs, spot deliverables and futures, gains are likely to continue overall but finding a good entry so close to the highs might be challenging.
For the latest analysis and opinions, visit the link on my profile to follow me on X too.
This is my personal opinion, not the opinion of Exness. This is not a recommendation to trade.

Silver sideways consolidation capped at 5875 resistanceThe Silver remains in a bullish trend, with recent price action showing signs of a corrective pullback within the broader uptrend.
Support Zone: 5420 – a key level from previous consolidation. Price is currently testing or approaching this level.
A bullish rebound from 5420 would confirm ongoing upside momentum, with potential targets at:
5875 – initial resistance
6000 – psychological and structural level
6106 – extended resistance on the longer-term chart
Bearish Scenario:
A confirmed break and daily close below 5420 would weaken the bullish outlook and suggest deeper downside risk toward:
5350 – minor support
5275 – stronger support and potential demand zone
Outlook:
Bullish bias remains intact while the Silver holds above 5420. A sustained break below this level could shift momentum to the downside in the short term.
This communication is for informational purposes only and should not be viewed as any form of recommendation as to a particular course of action or as investment advice. It is not intended as an offer or solicitation for the purchase or sale of any financial instrument or as an official confirmation of any transaction. Opinions, estimates and assumptions expressed herein are made as of the date of this communication and are subject to change without notice. This communication has been prepared based upon information, including market prices, data and other information, believed to be reliable; however, Trade Nation does not warrant its completeness or accuracy. All market prices and market data contained in or attached to this communication are indicative and subject to change without notice.

XAGUSD H121. Market Structure
Price is in a strong bullish trend, making higher highs and higher lows.
The most recent impulsive leg broke above the 57.00 – 57.40 resistance zone and is now pulling back.
The current correction is normal within an uptrend and looks like a bullish flag / shallow retracement.
2. Key Levels
Support Zones
57.00 – 56.70 → Immediate support (previous resistance turned support)
54.50 – 55.00 → Stronger support zone if deeper pullback happens
51.00 – 52.00 → Major demand zone (unlikely to be retested unless momentum collapses)
Resistance
60.75 – 61.00 → Major target / next resistance
3. Price Action Signals
After a strong impulsive rally, last two candles show short-term profit-taking.
The market is still holding above structure; no sign of trend reversal yet.
If price retests 56.70 – 57.00 and prints bullish rejection wicks or engulfing, it becomes a high-probability long setup.
4. Projection
Your chart already shows the ideal scenario, and it aligns with the structure:
Bullish Scenario (Higher Probability)
Pullback → Stabilization at 56.70 – 57.00
Bullish continuation → Target 60.75
Break above 60.75 opens extension toward 62.00
Bearish Scenario (Lower Probability)
Break below 56.70 → Deeper correction toward 55.00
This level should act as strong support for buyers to step in.

XAGUSD Impulsive Rally Points Toward Higher ExtensionThe rally in Silver from the 28 October low continues to unfold as a five‑wave impulse, though the structure remains incomplete. From that low, wave 1 advanced to 54.39, followed by a corrective pullback in wave 2 that concluded at 48.6. The metal then resumed its upward trajectory in wave 3, which itself subdivides into another five‑wave sequence of lesser degree. From the termination of wave 2, wave ((i)) reached 53.85, while the subsequent pullback in wave ((ii)) settled at 52.86.
Momentum strengthened as wave ((iii)) extended to 58.84, before wave ((iv)) corrected modestly to 56.55. The market should now push higher in wave ((v)), thereby completing the larger wave 3. The potential termination zone for wave 3 aligns with the 100% to 161.8% Fibonacci extension of wave 1, calculated at 57.8 to 63.4. This region has already been tested, suggesting that the cycle is mature and wave 3 may be approaching completion.
Once wave 3 concludes, a corrective phase in wave 4 should emerge, retracing the cycle from the 21 November low before the broader trend resumes upward. In the near term, as long as the pivotal support at 48.64 remains intact, pullbacks should attract buyers. These retracements may unfold in sequences of three, seven, or eleven swings, providing opportunities for renewed upside participation.

silverMy prediction for silver. The final ceiling based on its alignment with the US balance sheet and past periods.

Silver (XAG/USD) - Breakout SetupPrice is approaching a key resistance level. I expect a short consolidation under the zone, followed by a breakout and continuation of the upward movement.
A Buy Stop order above the resistance allows entering only after confirmation of bullish strength.
If the price gives a retest after the breakout - even better for additional entries.
Market structure remains bullish, and the scenario stays valid as long as price holds above the local higher lows.

Silver = to the moon??? September 03, 2025Who’s Loading Up:
A top dog at Pan American Silver Corp., a heavyweight in North American silver digs, just scooped up a hefty chunk of shares.
Deal Size: This exec grabbed 50,000 shares at $22.50 a pop on August 28, 2025, dropping $1.125 million—talk about putting skin in the game!
Company Lowdown
Pan American Silver Corp. runs 10 mines across the Americas, packing 468 million ounces of silver and 6.7 million ounces of gold. Based out of Vancouver, they’ve got cash flowing like a river, fueling big bets like La Colorada Skarn and Escobal.
Sector Vibes:
• The Silver Institute’s calling for a fifth straight supply crunch in 2025, with photovoltaics and AI tech demand hitting all-time highs.
• Tariff threats, green energy boom, and a possible Fed rate cut in September 2025 could send silver soaring.
Big Funds Jumping In
Last quarter (June–August 2025), heavy hitters like Sprott Asset Management (+8% in Pan American), BlackRock Inc. (+5% in iShares Silver Trust), and Invesco Ltd. (+6% in VanEck Silver Miners ETF) piled into silver.
Buzz on X says Saudi Central Bank’s dipping its toes into silver via iShares Silver Trust (SLV), ditching its gold-only playbook.
London Vaults Drying Up
The LBMA’s silver stash is under siege from a supply deficit. With 150 million ounces short in 2024, the Silver Institute hints reserves might shrink 5–10% yearly if demand keeps raging, setting the stage for a price explosion.
1979 Boom & 2025–2026 Wild Cards
1979 Flashback: The Hunt Brothers’ silver grab, plus inflation and oil chaos, rocketed silver from $6 to $50/oz (+700%). Gold jumped from $300 to $850/oz on similar vibes.
2025–2026 Triggers:
Inflation’s sticky above 3%, the USD’s wobbling from tariffs, and a Fed cut looms in September 2025. Watch for U.S.-China trade wars, Middle East flare-ups, or a BRICS metals exchange—any could ignite a 1979-style silver rocket if deficits worsen.
Price Targets:
Short-Term (3 months): $60.00 (+46.9%)
Mid-Term (6–12 months): $120.00 (+193.7%)
Long-Term (18–24 months): $240.00 (+487.5%)
🤔🤔🤔🤔🤔🤔🤔🤔

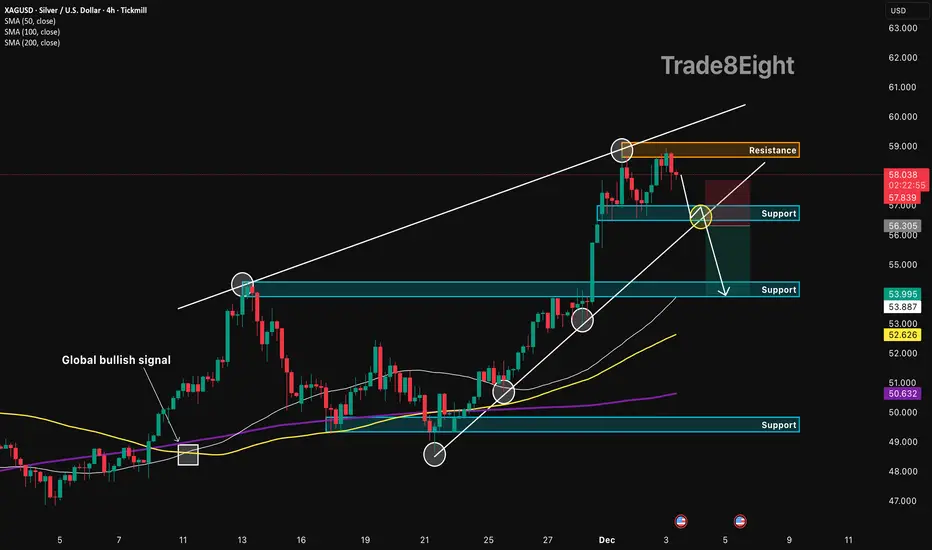
XAGUSD: reversal from resistance🛠 Technical Analysis: On the 4-hour timeframe, silver (XAGUSD) rebounded from the important resistance level of 59.00, signaling a potential bearish reversal. Currently, the price is likely to test the nearest support at 56.30, a confirmed break of which would provide a potential sell entry. The trading setup suggests a correction toward the demand zone at 54.00, which coincides with the support area marked on the chart.
❗️ Trade Parameters (SELL) ❗️
➡️ Entry Point: Sell on breakdown of support (approx. 56.30)
🎯 Take Profit: 53.90 – 54.00 (Support Zone)
🔴 Stop Loss: Above local resistance structure (approx. 57.85)
⚠️ Disclaimer: This is a potential trade idea based on current analysis; market conditions and price direction are subject to change based on news factors and volatility.
Silver : New Safe Heaven : According to me. No Major Sellers are available to sell silver.
It is growing like silver shine..
Ideal entry to buy 55
Sl 52
Target 63.
Logic : Ascending triangle with it's pending movement.
I have extended triangle's length to upward after breakout.
Manage your risk

XAGUSD 4h
Silver has formed a cup pattern, potentially it can move upward approximately equal to dept of the cup.
Blue line and the Purple lines are the resistance lines.
We will be seeing higher prices based on weekly and monthly candle analysis.
Stay Tuned for our next update.

XAGUSD 4h
XAG started a strong movement now we are in the middle of the wave and sellers are in competition with buyers. we are excepting that the price at least touch the top of the Chanelle.
Below is support line in smaller timeframe in case some one missed the opportunity from our last analysis.
Stay tuned for next updates!

XAGUSD - Signal#XAGUSD - Signal
H4 - Formation of the 3rd wave + trendline breakout. Stop loss beyond the high of the 1st wave.
Entry: 56.52040
TP: 54.95818 - 53.76428 - 52.54498 - 49.38243
Stop: 58.85736

XAG/USD 2H: High-Probability Sell Entry at Drop-Base-Rally (BRD)📈 XAG/USD 2H: High-Probability Long Entry at Drop-Base-Rally (DBR) Demand Zone
📝 Market Context: Bullish Trend and Retracement
The overall trend for Silver (XAG/USD) is strongly bullish, driven by fundamental factors like tight physical supply and expectations of future US interest rate cuts. The chart shows price has been moving sharply higher, but has recently experienced a significant and necessary pullback from its high. This pullback is being treated as a correction to gather new demand before continuing the primary upward trend toward potential targets like $60 - $65 per ounce.
The current price action has approached a critical area that served as the launchpad for the prior bullish impulse.
🔑 Technical Focus: Unmitigated Demand and Entry Confirmation
The analysis highlights two key zones: a high-quality Demand Zone and the last area of consolidation before the final breakout.
1. Drop-Base-Rally (DBR) Demand Zone 🟢
Zone Location: The green shaded box, spanning approximately $54.00 to $54.50.
Significance : This area is identified as a fresh Demand Zone. It conforms to the Drop-Base-Rally (DBR) structure, where an initial drop was followed by a period of consolidation (the Base), before buyers aggressively took control, leading to the strong rally (the Rally). This zone is considered a Reversal Zone where institutional buy orders are expected to remain unmitigated.
Action Plan: This is the high-probability area to initiate a long (buy) position, anticipating a strong rebound.
2. Liquidity & Stop-Loss Target (Bottom Green Zone)
Zone Location: The lower green box, around $53.50 to $53.80.
Significance : This zone may represent the ultimate base of the prior move. The price of Silver is known for high volatility. Placing the Stop Loss (S/L) safely below this zone (e.g., below $53.50) is crucial to protect the trade from a potential "liquidity sweep" or deeper structural break, providing a healthy buffer.
📊 Trade Plan: Sell the Dip
Trade Direction: Short (SELL)
Entry Strategy: Wait for price to enter the DBR Demand Zone (around $54.00 - $54.50). Confirmation is highly recommended, such as monitoring for a clear bullish reversal pattern (like an engulfing candle or a double bottom) on a lower timeframe (e.g., 30M or 1H) before entry.
Stop Loss (S/L): Place S/L below the entire demand structure, for example, below $53.50.
Take Profit (T/P) 1: The first target is the level of the most recent high that initiated the current drop (a retest of the supply that caused the current pullback).
Take Profit (T/P) 2: A higher-level target is the prior swing high at $56.00, or pushing towards the psychological $60 per ounce level, which is a common projection based on current market dynamics.
⚠️ Risk and Fundamental Caveats
While the technical setup is strong, Silver is highly volatile. Traders must closely monitor upcoming US economic data, as stronger-than-expected US reports could delay expected Fed rate cuts and put temporary downward pressure on non-yielding assets like Silver.
Invalidation: A decisive close below the Stop Loss area (below $53.50) would invalidate this long trade idea, signaling a deeper correction or a structural shift.

