Silver breakout coming!Dont get shaken out of your positions....the next move up should take us up above $40...perhaps to $45...then expect a pb...followed by one more major move up...likely to $60+...I expect a overshoot once we break $50.
SILVER trade ideas

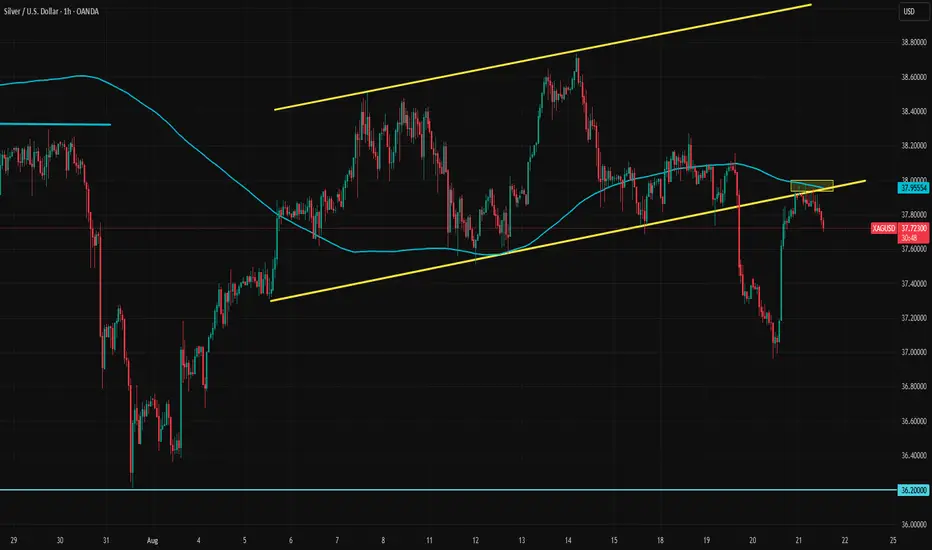
A Quick Update on SilverThe 200-hour SMA has long been a key moving average, acting as support, resistance, or an anchor after sharp moves. Today, it is serving as resistance together with a broken short-term trendline. As long as silver remains below this level, the intraday direction will stay downward.
XAGUSD Short Setup – 30m TimeframeSilver (XAGUSD) has rejected the resistance zone around 37.97 – 38.00 and failed to push higher.
On the 30m timeframe, price broke below minor structure support at 37.82 after multiple rejections, confirming bearish pressure.
Entry: 37.82 (after support break)
Stop Loss: Above 37.98 (resistance zone)
Take Profit: 37.30 (next key support)
This setup offers a clean risk-to-reward opportunity, with sellers targeting lower liquidity zones. A close above 37.98 would invalidate the bearish scenario.

Silver Continues to Face Bearish Pressure ? Hello, what do you think about the trend of TVC:SILVER ?
Silver continues to face downward pressure as it trades within a descending channel. Recent price action shows that the metal is testing resistance and struggling to maintain upward momentum. Given the current market dynamics, including a strong US Dollar and global economic concerns, the bearish trend is likely to persist in the short term.
With the bearish factors and technical indicators in place, it’s important to closely monitor price action near the support zone to look for potential shorting opportunities. Be cautious and manage risk effectively.
As long as the trendline remains intact, selling remains the favored strategy.

SILVER (XAGUSD): Bearish Move From Trend Line
I see a test of a strong trend line on Silver on an hourly time frame.
A rapid growth stopped once the price approached that
and a consolidation started.
A bearish breakout of its support is a strong confirmation to sell.
I think that the market will retrace to 37,54
❤️Please, support my work with like, thank you!❤️
I am part of Trade Nation's Influencer program and receive a monthly fee for using their TradingView charts in my analysis.

Silver Potential Road Mapsilver appears ready for w3 to start. yellow line with a entry signal up is a go. keep an eye for any reversal/continuation signals to downside - w3 white line may start here (2 potential Road maps)

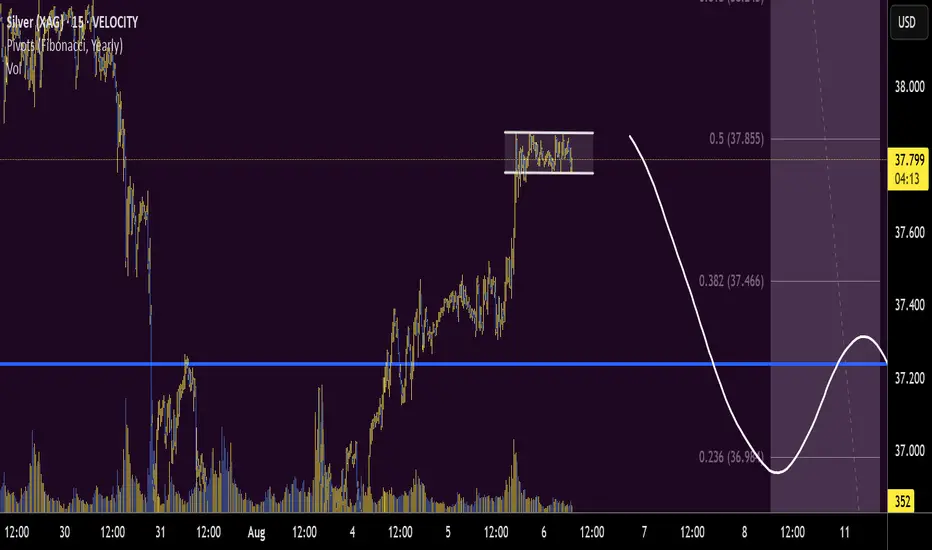
Silver potentialSilver. previous trade SL kicked in. now their seems 3 possibilties for a downward leg. 1. high hold. 2 false break. 3. ABC - C last leg

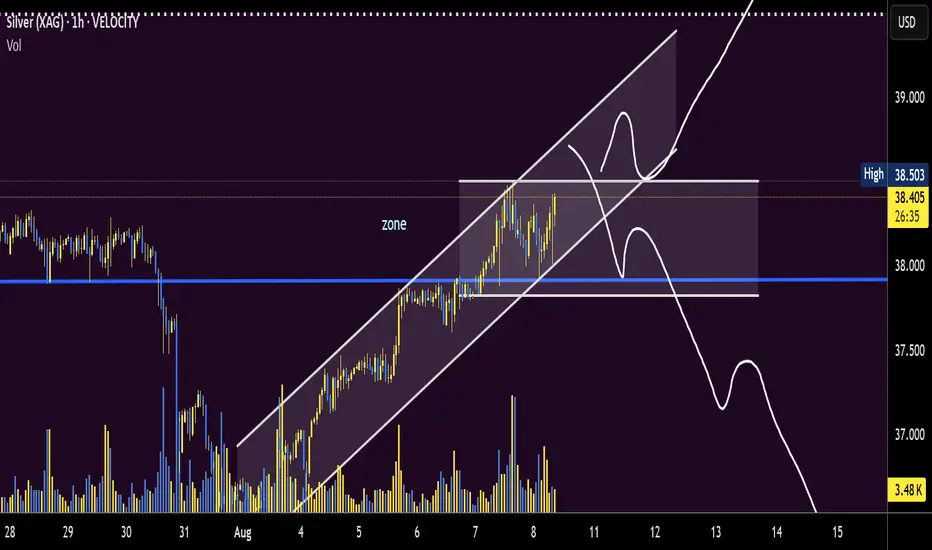
Is silver roadmap at a crossroadssilver trend has been up for ages. perhaps pushing to attack the highs of "50.000" - the trend is your...
ZONE: offers 2 roadmaps:
1.going with the trend up favours bullish entry signals - ABC complete??
2. a unusaul significant entry signal suggesting abc correction within ABC not complete another nuance.
Silver Rallies Post 3 Wave Pullback, Aiming for New HighThe bullish cycle in Silver (XAGUSD), initiated from the April 2025 low, continues to unfold as an impulse pattern. Starting from that low, wave (1) peaked at 33.68, followed by a corrective dip in wave (2) that concluded at 31.65. Silver then surged in wave (3) to 39.52, with a subsequent pullback in wave (4) finding support at 36.2, as illustrated on the 1-hour chart. Currently, wave (5) is developing as a lower-degree impulse. For the bullish trend to persist without risk of a double correction, Silver must break above 49.52.
From the wave (4) low, wave ((i)) reached 36.8, and a brief pullback in wave ((ii)) stabilized at 36.34. The metal then climbed in wave ((iii)) to 38.5, followed by a correction in wave ((iv)) to 37.48. The final leg, wave ((v)), concluded at 38.73, completing wave 1 in a higher degree. A corrective wave 2 then unfolded as a zigzag Elliott Wave structure. From the wave 1 peak, wave ((a)) declined to 37.7, wave ((b)) rallied to 38.26, and wave ((c)) fell to 36.94, finalizing wave 2. Silver has now resumed its ascent in wave 3. As long as the 36.2 pivot holds, expect Silver to continue rallying.

XAGUSD SILVERThe Jackson Hole Economic Policy Symposium is an annual, three-day conference hosted by the Federal Reserve Bank of Kansas City in Jackson Hole, Wyoming. It brings together central bankers, economists, academics, and financial market participants from around the world to discuss key economic issues and monetary policy.
Why Jackson Hole Matters to Traders:
It is one of the most closely watched central banking events globally because top policymakers, including the Federal Reserve Chair, often signal future monetary policy directions here.
Speeches and discussions at Jackson Hole can provide early hints on interest rate moves, inflation outlook, and economic strategy, which significantly influence global financial markets.
Market participants anticipate policy clues that can affect currencies, bonds, stocks, and commodities, leading to increased volatility during and shortly after the event.
This year's theme is focused on "Labor Markets in Transition: Demographics, Productivity, and Macroeconomic Policy," addressing important structural changes in labor markets and their implications on monetary policy.
For traders and investors, Jackson Hole is crucial as it can shape expectations for central bank actions and market trends for months to come.


SILVER: Will Go Up! Long!
My dear friends,
Today we will analyse SILVER together☺️
The in-trend continuation seems likely as the current long-term trend appears to be strong, and price is holding above a key level of 37.683 So a bullish continuation seems plausible, targeting the next high. We should enter on confirmation, and place a stop-loss beyond the recent swing level.
❤️Sending you lots of Love and Hugs❤️

Silver (XAG/USD):Silver is moving strongly in an upward trend and is currently testing the golden zone (Fibonacci retracement area) at resistance near 37.80.
If price breaks and holds above this zone, it could extend toward 38.00.
However, if the price rejects this golden zone and breaks below 37.70 with a close beneath it, this would support a decline toward 37.40, and potentially 37.20.

SILVER - High R/R, 3rd vol contractionExcellent Risk/Reward entry on Silver this morning, testing the bottom of a 3rd consecutive symmetrical triangle and the top of the previous consolidation area. Silver is again consolidating constructively above a breakout level with contracting volatility before the next move. Consistent with longterm macro bullishness on metals and continued technical uptrend. Tight stop below the 36.90 low or lower trendline. For longer term entry stop below the 31/7 low.
Any entry below the dashed midline provides excellent R/R, even to just to retest the July high.
Expect possible retest/liquidity grab on either trendline and/or midline post-breakout. May provide another high R/R entry.
4 hour RSI Oversold.

SILVER Will Go Lower From Resistance! Sell!
Take a look at our analysis for SILVER.
Time Frame: 8h
Current Trend: Bearish
Sentiment: Overbought (based on 7-period RSI)
Forecast: Bearish
The market is approaching a key horizontal level 3,759.7.
Considering the today's price action, probabilities will be high to see a movement to 3,630.5.
P.S
We determine oversold/overbought condition with RSI indicator.
When it drops below 30 - the market is considered to be oversold.
When it bounces above 70 - the market is considered to be overbought.
Disclosure: I am part of Trade Nation's Influencer program and receive a monthly fee for using their TradingView charts in my analysis.
Like and subscribe and comment my ideas if you enjoy them!


SILVER BEARS ARE GAINING STRENGTH|SHORT
SILVER SIGNAL
Trade Direction: short
Entry Level: 3,807.9
Target Level: 3,771.0
Stop Loss: 3,832.4
RISK PROFILE
Risk level: medium
Suggested risk: 1%
Timeframe: 3h
Disclosure: I am part of Trade Nation's Influencer program and receive a monthly fee for using their TradingView charts in my analysis.
✅LIKE AND COMMENT MY IDEAS✅

Silver Analysis – August 20, 2025In our previous analysis, we highlighted 38.3 as a key decision-making level.
Last week, price not only swept liquidity around that level and dropped, but also broke through our 37.5 resistance zone with solid momentum.
📉 The 4H close below this area indicates the market has entered a new bearish phase.
From here, it becomes much more likely for silver to head toward $35 and $34.
🔻 At this stage, every rally should be considered a selling opportunity.

XAGUSD SELL 37.5On the 4-hour chart, XAGUSD formed a head-and-shoulders pattern before declining, indicating a short-term bearish trend. Currently, focus on resistance near 37.5. Consider shorting if a rebound is blocked. Focus on the previous demand zone of 36.2-36.7 below.

SILVER BEARISH BREAKOUT|SHORT|
✅SILVER broke the key
Structure level of 37.60$
And the breakout is confirmed
Which makes me bearish biased
And I think that after the retest of
The broken level is complete
A bearish continuation will follow
SHORT🔥
✅Like and subscribe to never miss a new idea!✅

Silver: Bulls clinging to 50DMA, bears smell opportunitySilver finds itself resting on the key 50DMA, a level traders have used as a launchpad for bullish moves on the last two occasions of testing. However, with unconvincing price action and momentum indicators turning neutral, it may be a case of third time lucky for bears on this occasion.
Silver has already broken beneath the February 2012 high of $37.46, which has acted as something akin to a dividing line for price action since first being crossed in July—a small win for bears seeking a deeper pullback. But given how often bears have attempted to break beneath the 50DMA only to see the price reverse back in their face, to bolster the case for shorts it would be preferable to see a close beneath the level before establishing bearish positions. Potential targets include $36.27 and $35.50. A stop above either the 50DMA or $37.46 would offer protection against reversal.
If the 50DMA holds firm again, the setup could be flipped with longs established above the level with a stop beneath for protection. $38.73 screens as an initial target having acted as both support and resistance in July and August.
Good luck!
DS

Bearish reversal off pullback resistance?XAG/USD is rising towards the resistance level which is a pullback resistance and could reverse from this level to our take profit.
Entry: 37.67
Why we like it:
There is a pullback resistance level.
Stop loss: 38.62
Why we like it:
There is a swing high resistance.
Take profit: 36.30
Why we like it:
There is a multi swing low support.
Enjoying your TradingView experience? Review us!
Please be advised that the information presented on TradingView is provided to Vantage (‘Vantage Global Limited’, ‘we’) by a third-party provider (‘Everest Fortune Group’). Please be reminded that you are solely responsible for the trading decisions on your account. There is a very high degree of risk involved in trading. Any information and/or content is intended entirely for research, educational and informational purposes only and does not constitute investment or consultation advice or investment strategy. The information is not tailored to the investment needs of any specific person and therefore does not involve a consideration of any of the investment objectives, financial situation or needs of any viewer that may receive it. Kindly also note that past performance is not a reliable indicator of future results. Actual results may differ materially from those anticipated in forward-looking or past performance statements. We assume no liability as to the accuracy or completeness of any of the information and/or content provided herein and the Company cannot be held responsible for any omission, mistake nor for any loss or damage including without limitation to any loss of profit which may arise from reliance on any information supplied by Everest Fortune Group.
