XAGUSD H1 | Bullish Bounce Off Key SupportMomentum: Bullish
Price is currently above the ichimoku cloud.
Buy entry: 50,608
- Strong pullback support
- 50% Fib retracement
- 100% Fib projection
- Fair Value Gap
Stop Loss: 49.634
- Swing low support
Take Profit: 51.631
- Multi-swing high resistance
High Risk Investment Warning
Stratos Markets Limited (tradu.com/uk ), Stratos Europe Ltd (tradu.com/eu ):
CFDs are complex instruments and come with a high risk of losing money rapidly due to leverage. 70% of retail investor accounts lose money when trading CFDs with this provider. You should consider whether you understand how CFDs work and whether you can afford to take the high risk of losing your money.
Stratos Global LLC (tradu.com/en ): Losses can exceed deposits.
Please be advised that the information presented on TradingView is provided to Tradu (‘Company’, ‘we’) by a third-party provider (‘TFA Global Pte Ltd’). Please be reminded that you are solely responsible for the trading decisions on your account. Any information and/or content is intended entirely for research, educational and informational purposes only and does not constitute investment or consultation advice or investment strategy. The information is not tailored to the investment needs of any specific person and therefore does not involve a consideration of any of the investment objectives, financial situation or needs of any viewer that may receive it. Past performance is not a reliable indicator of future results. Actual results may differ materially from those anticipated in forward-looking or past performance statements. We assume no liability as to the accuracy or completeness of any of the information and/or content provided herein and the Company cannot be held responsible for any omission, mistake nor for any loss or damage including without limitation to any loss of profit which may arise from reliance on any information supplied by TFA Global Pte Ltd.
Trade ideas

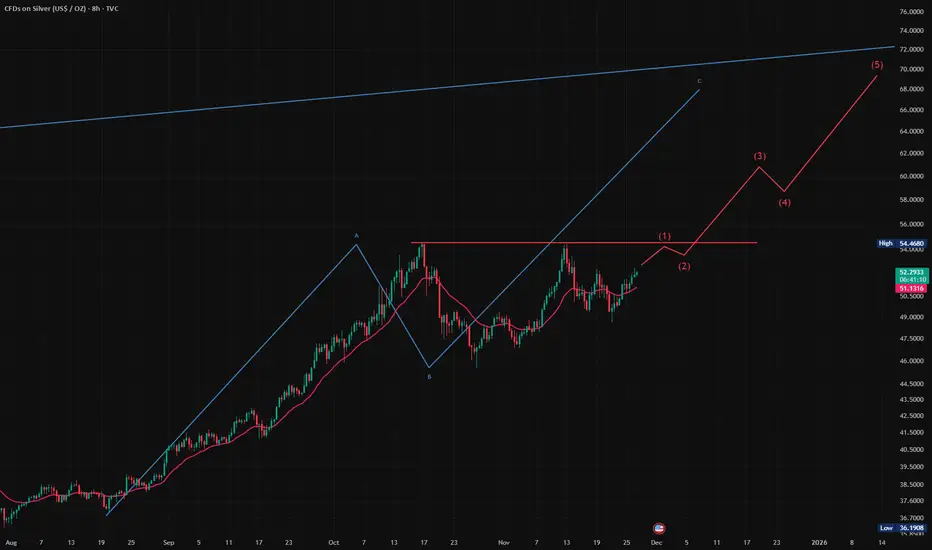
#SILVER will likely reach $70 in the next few weeks/months.Bears have now failed twice to reverse the trend, this has now improved the odds for a bull flag continuation breakout.
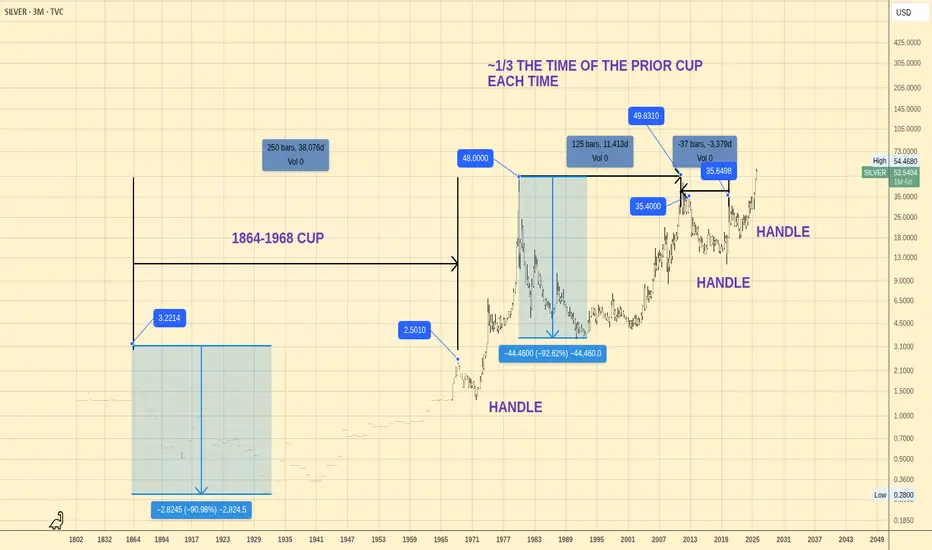
Silver Cup and Handle Formations With Time ApproximationGoing back to the origin of the data in the mid 1800s, Silver shows repeating and somewhat fractal cup and handle formations. If you look at the time to complete of these formations, you can see that each cup and handle takes 1/3 of the time to complete from the previous.
We are continuing to see this on the smaller timeframes. I assume these will cause Silver to go exponential in the short term which is likely happening now
Current pattern in formation
Silver hit TP1 and BE closed the position — Entry 2Silver tapped straight into the key reaction zone and re-triggered the sell-stop setup exactly as expected. The precision of the move reinforces the bearish intent we were tracking, giving Entry 2 a clean structure and a justified re-engagement after the first trade closed at BE.
The primary target stays at 2R, but with the downside imbalance and broken demand levels lining up, this leg has room to stretch toward 4R+ if sellers keep driving the flow.
Technically, the rejection from the upper liquidity pocket is clear, followed by a rotation in structure that favors continued downside. Bullish momentum has stalled, and the candle sequence is showing steady, controlled selling pressure. Break-and-retest behavior across intraday timeframes continues to support the bearish continuation.
Managing the position is personal—locking in 2R is reasonable—but the chart is still offering an open lane for extended downside as long as order flow remains aligned.
Overall, Silver is giving a clean second short setup backed by a liquidity sweep, momentum shift, and strong confluence—solid conditions for those keeping the bearish bias alive.


XAGUSD H4 | Bullish RiseMomentum: Bullish
The price has reacted off the buy entry, which is a pullback support.
Buy entry: 50.84
Pullback support
Stop loss: 49.39
Pullback support
Take profit: 54.09
SWing high resistance
145% Fibonacci extension
High Risk Investment Warning
Stratos Markets Limited (tradu.com ), Stratos Europe Ltd (tradu.com ):
CFDs are complex instruments and come with a high risk of losing money rapidly due to leverage. 70% of retail investor accounts lose money when trading CFDs with this provider. You should consider whether you understand how CFDs work and whether you can afford to take the high risk of losing your money.
Stratos Global LLC (tradu.com ): Losses can exceed deposits.
Please be advised that the information presented on TradingView is provided to Tradu (‘Company’, ‘we’) by a third-party provider (‘TFA Global Pte Ltd’). Please be reminded that you are solely responsible for the trading decisions on your account. Any information and/or content is intended entirely for research, educational and informational purposes only and does not constitute investment or consultation advice or investment strategy. The information is not tailored to the investment needs of any specific person and therefore does not involve a consideration of any of the investment objectives, financial situation or needs of any viewer that may receive it. Past performance is not a reliable indicator of future results. Actual results may differ materially from those anticipated in forward-looking or past performance statements. We assume no liability as to the accuracy or completeness of any of the information and/or content provided herein and the Company cannot be held responsible for any omission, mistake nor for any loss or damage including without limitation to any loss of profit which may arise from reliance on any information supplied by TFA Global Pte Ltd.

XAGUSDHow to become successful in forex and stock trading: 1.Master fundamentals and technical analysis. 2,Build and follow a solid trading plan. 3.Apply strict risk management (1–2% rule). 4.Stay disciplined—control fear and greed. 5.Record and analyze every trade. 6.Focus on high-quality setups only. 7.Diversify across assets and markets. 8.Keep evolving—study, adapt, and grow daily.

silver usdHI GUYS,
UPDATE ON SILVER
We have made an upgrade from H4, H6, H8 PATH to daily path.
in a few hours it will be Wednesday .
we sell as soon as situation presents itself.
we are to hold these entries for at least 2 weeks

XAGUSD _1h
Price is still struggling to find its path, although it broke the resistance dynamic line, but we cant surly decide its way yet. Its ranging in 15 Min as below screenshot.
SILVER USDHI GUYS,
We are to hold our entries till wed.
however for those that didn't make entries last week we have a pull back this Mon
to complete the Head shoulder price pattern.
The yellow trend-line for sells is not active or accurate as we need to make it to (wed) and adjustments will be made

XAGUSD – SILVER MARKET OUTLOOK ( SELL )Silver has tapped directly into our key reaction zone and activated the sell-stop setup exactly as anticipated. The precision of the move confirms the bearish intent we were watching for, giving us a clean entry with solid structure behind it.
Our base target remains 2R, but with layered TP levels mapped out along the downside imbalance and prior demand breaks, this move has potential to stretch toward 4R or more if sellers maintain control.
From a technical standpoint, we’re seeing a decisive rejection out of the upper liquidity pocket, followed by a clear rotation in market structure. Momentum is fading on the bullish side, and the most recent candle sequence shows controlled but persistent selling pressure. The break-and-retest behavior across intraday timeframes further strengthens the bearish continuation narrative.
Trade management is, of course, up to the individual—taking profits at 2R is completely valid—but the chart is offering a clean path for extended downside if the order flow keeps aligning.
Overall, Silver is presenting a sharp, well-structured short opportunity backed by liquidity sweep, momentum shift, and technical confluence. A strong chart for those following the downside bias.

XAGUSDMarket Structure
Silver recently broke out from a descending trendline, signaling a shift from short-term bearish momentum to a potential bullish reversal phase.
Price is currently around 51.49, forming a minor pullback after the breakout.

Silver - potential scenario Silver is in correction wave C, completing a flat pattern.
A confirmed close above 50.100 on Monday, November 24, 2025, suggests an upward move to a first target of 51.400, continuing to a final target of 53.300.
Stop-loss if the hourly close falls below 49.700.

SILVER LongTrendline break and trendline support.
Look to buy a little pullback.
See if the levels work


Any guesses on Silver's next move? This is a coin flip at the moment.
This will resolve before the new year.
Get ready and act accordingly.
The yellow line below is a weekly and monthly gap. IF it breaks below, it could reach that $39 level and fill that gap before the next move higher.
However, it may not matter. It could easily blast higher (VERY SOON) to the measured $70-$80 range.
For now, just something to keep an eye on.

Silver Wave Analysis – 24 November 2025
- Silver reversed from support area
- Likely to rise to resistance level 52.50
Silver recently reversed from support area between the round support level 50.00 (which was set as the likely downward target in our earlier report for this instrument), 20-day moving average and the 50% Fibonacci correction of the upward impulse (1) from October.
The upward reversal from this support area started the active intermediate impulse wave (3).
Given the overriding daily uptrend, Silver can be expected to rise to the next resistance level 52.50 (top of the previous wave B).

XAGUSD _ 4h
Update on silver
I would be waiting to see market reaction when price touches top of the Chanell.

xagusd 20% retraceim very much with a bullish dollar into march if that scenario plays in favour all precious metal like gold which is hanging by a thread waiting to drop so will silver. like hsbc bank predicts 38-41
Silver oversold bounce testing resistance at 5033The Silver remains in a bullish trend, with recent price action showing signs of a corrective pullback within the broader uptrend.
Support Zone: 4845 – a key level from previous consolidation. Price is currently testing or approaching this level.
A bullish rebound from 4845 would confirm ongoing upside momentum, with potential targets at:
5033 – initial resistance
5108 – psychological and structural level
5214 – extended resistance on the longer-term chart
Bearish Scenario:
A confirmed break and daily close below 4845 would weaken the bullish outlook and suggest deeper downside risk toward:
4780 – minor support
4740 – stronger support and potential demand zone
Outlook:
Bullish bias remains intact while the Silver holds above 4845. A sustained break below this level could shift momentum to the downside in the short term.
This communication is for informational purposes only and should not be viewed as any form of recommendation as to a particular course of action or as investment advice. It is not intended as an offer or solicitation for the purchase or sale of any financial instrument or as an official confirmation of any transaction. Opinions, estimates and assumptions expressed herein are made as of the date of this communication and are subject to change without notice. This communication has been prepared based upon information, including market prices, data and other information, believed to be reliable; however, Trade Nation does not warrant its completeness or accuracy. All market prices and market data contained in or attached to this communication are indicative and subject to change without notice.

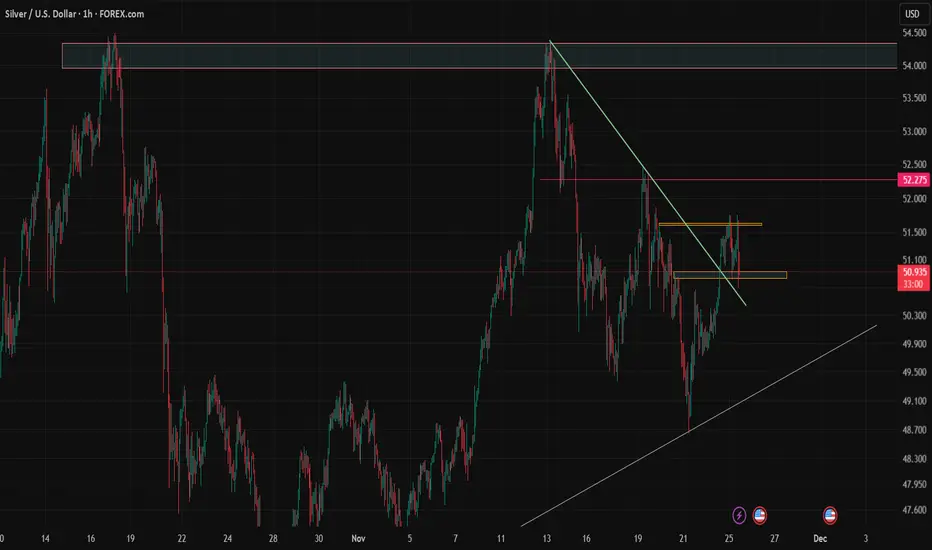
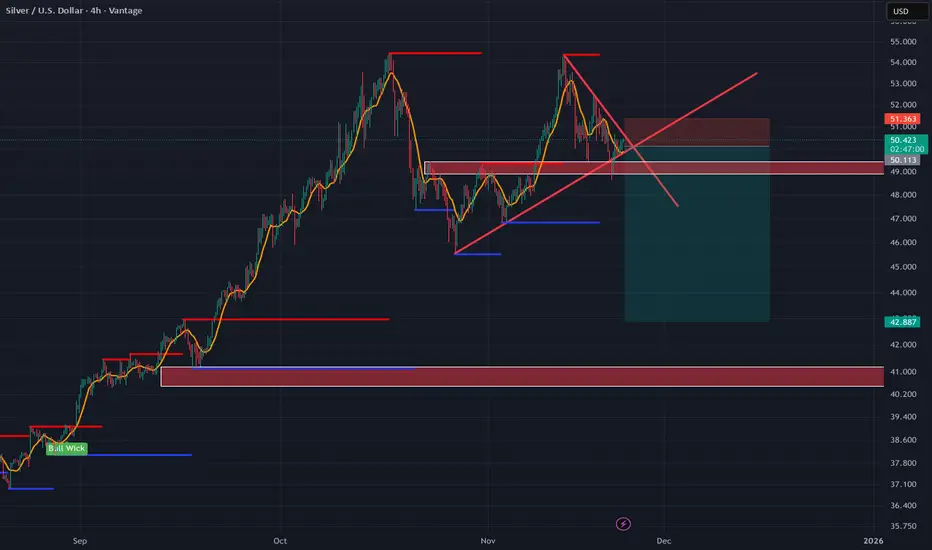
Below 51, Silver Remains Heavy – Watching 47.50 Next1. What Happened After Last Week’s Call
As expected — and exactly as outlined in last week’s analysis — Silver reversed sharply from the sell zone above 52, dropping nearly 4,000 pips from that level.
This was a textbook reversal from resistance, confirming that the 52+ area is a major rejection zone for the metal.
After the drop:
- Price reclaimed the 49 support, showing short-term stabilization,
- But failed to regain the 50.50 zone, which was crucial for a genuine bullish recovery.
- Instead, Silver has now slipped into a sideways consolidation, showing hesitation and lack of strong buyers.
2. Current Market Context – Not the Same as Gold, but Still Bearish
While Silver’s structure is not identical to Gold’s, it shares the same underlying message:
➡️ The market is heavy, not neutral.
Key observations:
- The rebound lacked momentum.
- Every rally since the drop has been corrective, not impulsive.
- The failure at 50.50–51.00 confirms that sellers are still defending this zone aggressively.
This leaves Silver stuck under resistance with a bearish tone, despite the temporary bounce above 49.
3. Technical Outlook – Preparing for the Next Leg Down
Resistance zone:
50.50 – 51.00
This remains the decisive ceiling.
As long as Silver stays below this band, the market structure is bearish, and every rally into this area is a sell opportunity.
Support zone:
49.00
A key reference point.
If Silver breaks below 49 again, sellers will likely push aggressively.
Downside target:
47.50 zone
This is the next major support, and the most logical destination for a completed second leg down.
Given the current rhythm of the market, a drop into this zone is highly plausible if 49 gives way.
4. Trading Plan – Clear, Simple, Disciplined
- Sell rallies into 50.50–51.00 resistance
- More confirmation if price approaches 49 again
- If 49 breaks, expect a continuation toward 47.50
Bias changes only if Silver reclaims 51 with strong buying (low probability for now)
No need to overcomplicate this setup — the market is offering clear technical boundaries.

SILVER BEARS ARE STRONG HERE|SHORT
SILVER SIGNAL
Trade Direction: short
Entry Level: 4,992.1
Target Level: 4,536.3
Stop Loss: 5,296.0
RISK PROFILE
Risk level: medium
Suggested risk: 1%
Timeframe: 1D
Disclosure: I am part of Trade Nation's Influencer program and receive a monthly fee for using their TradingView charts in my analysis.
✅LIKE AND COMMENT MY IDEAS✅

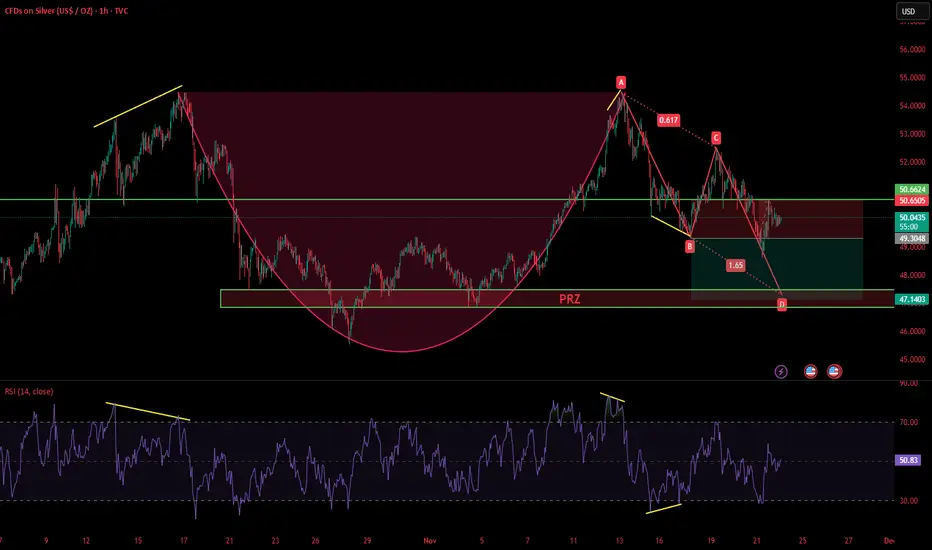
SILVERSilver may follow ABCD pattern and continue its downward trend towards its PRZ. Hopefully RSI divergence will be printed at PRZ as it is major support zone at 4H timeframe.