SILVER (XAG/USD): Potential Pullback Trade ExplainedThe price of ⚠️SILVER is currently consolidating within a strong horizontal support structure.
To initiate a long position with a confirmation, wait for a bullish breakout of the resistance of the range on a 4H time frame.
A 4H candle closing above 49.40 will confirm a violation.
A Subsequent bullish momentum is anticipated, potentially reaching the 50.50 resistance level.
The setup will be invalidated if the price establishes a new lower low.
Trade ideas

SILVER | Head & Shoulder Breakdown After All-Time HighAfter reaching a new all-time high, #SILVER seems ready for a healthy correction before the next bullish rally.
🔹 On the 1H timeframe, price has clearly formed a Head & Shoulder pattern.
🔹 The neckline has been broken, confirming the start of a bearish move.
🔹 This indicates a possible short-term correction phase before bulls take control again.
Trade Idea:
Taking a short position at CMP with strict risk management looks favorable.
Potential targets: near recent support levels.
Stop loss: above the right shoulder.
Always wait for candle confirmation and use proper position sizing.
What’s your view — will #Silver continue the correction or bounce back soon?
Comment your thoughts below and don’t forget to like, follow, and share if you find this analysis helpful!
#Silver #XAGUSD #HeadAndShoulders #ChartAnalysis #TechnicalAnalysis #PriceAction #TradingSetup #Commodities #Forex #Metals #SwingTrade #DayTrading #TradeIdeas #BearishSetup #RiskManagement #TradingCommunity #MarketAnalysis #TradersLife #TrendReversal

XAGUSD – Silver Analysis | Technical & Fundamental Outlook by RaXAGUSD – Silver Analysis | Technical & Fundamental Outlook
by Rami Hajj Bakour – Emara Capital Group
🔹 Technical Analysis:
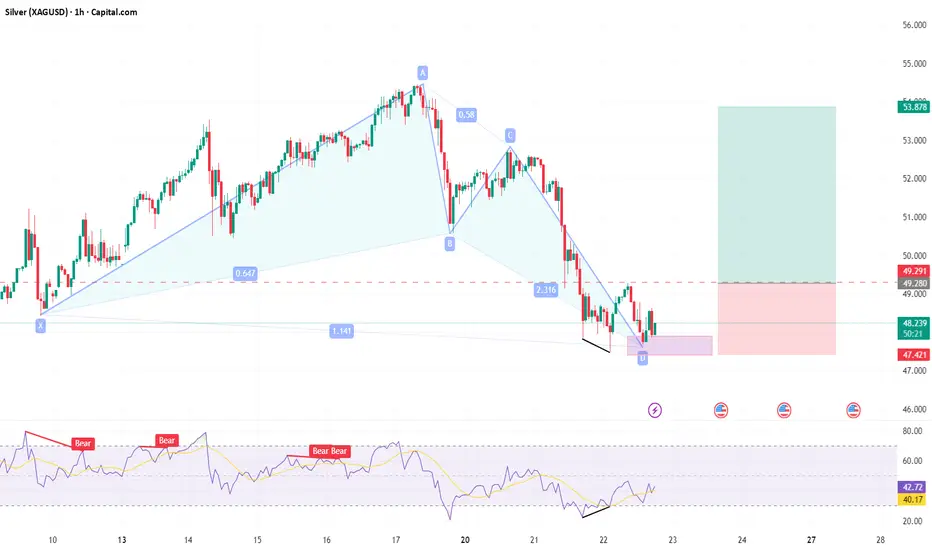
Silver completed a clear five-wave impulsive structure, followed by a corrective phase labeled as (A)(B)(C).
Currently, prices are expected to make a short-term corrective rise toward the 51.68 – 52.00 zone — aligning with the 50% to 61.8% Fibonacci retracement — before resuming the downward wave (C) targeting 46.50 – 45.00 levels.
Resistance zones:
49.05
51.68
Support zones:
46.50
45.76
45.02
📉 The bearish scenario remains valid as long as the price stays below 52.78.
🔸 Fundamental Analysis:
Silver prices are stabilizing after recent declines, supported by a weaker US dollar and softer bond yields. However, tightening monetary policy expectations continue to limit gains.
Bullish factors:
Market expectations for rate cuts in H1 2026.
Strong industrial demand, especially from solar energy and electronics sectors.
Potential further weakness in the US dollar.
Bearish risks:
Hawkish comments from Fed officials.
Rising long-term yields.
Weak Chinese manufacturing demand.
📊 In summary:
The short-term bias remains corrective, with potential bullish momentum building near 45–46 USD if reversal signals appear. The 51.7–52 zone remains the key resistance area to watch.
📍Author: Rami Hajj Bakour
Financial Consultant | Emara Capital Group
#XAGUSD #Silver #TechnicalAnalysis #ElliottWave #TradingView #EmaraCapital #RamiBakour #Commodities #MarketOutlook #Forex

XAGUSD - Bullish ReversalXAGUSD has formed a double bottom on 1H. Placing buy stop on break of neckline.

silver longsgold and silver have been selling off for quite some time now anyone with a brain will tell you the dump cannot go on forever. I might be entering early but im confident in the price action and so I will take the longs.

XAGUSD End of Bearish Correction.We saw huge sell off from the beginning of the week due to massive profit taking. On Wednesday price closed with bullish pin bar which in 4HR is double bottom a bullish reversal pattern, wait for price to break 49.333 Double bottom Neckline for confirmation.

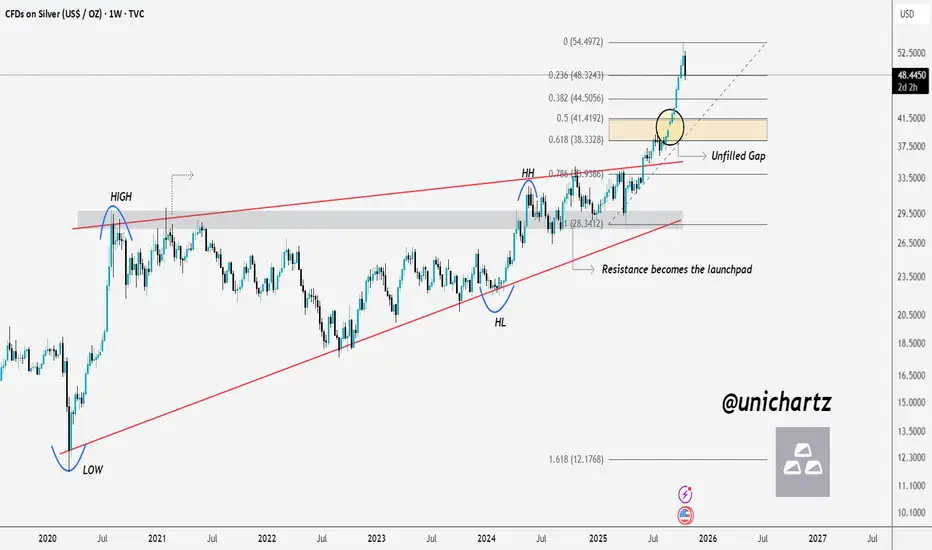
Correction Incoming – Silver Eyes Fib ZoneSILVER Weekly Analysis 🪙
At first, Silver faced strong rejection from the resistance zone, but once it finally broke out, the price came back to retest that same resistance — which then turned into a powerful launchpad, sending prices to new all-time highs.
Currently, the price is showing early signs of a correction. I’m expecting a possible retest of the Golden Fib Zone (0.5–0.618), where there’s also an unfilled gap near the 0.5 level. A move toward that area would make sense before the next major leg higher.
Resistance becomes the launchpad.
DYOR, NFA
Thanks for reading! Appreciate your support and engagement 🙏
Silver (XAG/USD) – Key Support Zone Under Pressuresilver is currently testing a major support zone (highlighted in purple) after a strong bearish move from the recent highs.
This area has previously acted as a strong demand zone, and buyers are now attempting to defend it once again.
If the market fails to hold this support, a break and retest pattern could form, opening the way toward the next major support area around the blue line.
However, as long as price remains above the purple zone, a short-term bullish reaction or range-bound movement is still possible.
Trade Plan:
🔹 Scenario 1 – Bearish Break:
• Wait for a clear break and retest below the purple zone
• Entry: On bearish confirmation (e.g., rejection wick or bearish engulfing)
• Stop Loss: Above the broken zone
• Take Profit: Blue horizontal level (next major support)
🔹 Scenario 2 – Bullish Rejection:
• If price shows strong rejection candles within the purple zone
• Entry: On bullish confirmation
• Target: Mid-range resistance or recent swing high
Bias:
⚖️ Neutral to Bearish — watching for confirmation of breakdown before entering short positions.
Market Logic:
Silver is at a critical decision point. The purple zone represents the last line of defense for buyers.
A confirmed close below it would shift the market structure toward bearish continuation, while a rebound could trigger a temporary pullback before another attempt lower.

XAGUSD Bullish Reversal Harmonic PatternXAGUSD Completed XABCD pattern indicating the PRZ supported by bullish divergence. Strong reversal expected from this zone. Entry at the breakout of LH.
Nasty reversal candle on Silver monthly chart.Silver.
That is one nasty reversal candle on monthly chart.
Problem is that it's happening with price historically stretched from moving average, where corrections start.
There is an outlier chance we still get a melt-up.
8 more trading days to see how the dust settles.

SILVER Is Bearish! Short!
Please, check our technical outlook for SILVER.
Time Frame: 1D
Current Trend: Bearish
Sentiment: Overbought (based on 7-period RSI)
Forecast: Bearish
The market is trading around a solid horizontal structure 4,794.2.
The above observations make me that the market will inevitably achieve 4,123.0 level.
P.S
The term oversold refers to a condition where an asset has traded lower in price and has the potential for a price bounce.
Overbought refers to market scenarios where the instrument is traded considerably higher than its fair value. Overvaluation is caused by market sentiments when there is positive news.
Like and subscribe and comment my ideas if you enjoy them!

Silver Price Falls Below $50Silver Price Falls Below $50
According to the XAG/USD chart, silver has fallen below the $50 mark after setting a historic high on 17 October, when the price briefly climbed above $54.40 for the first time.
Since then, the market has turned lower:
→ Silver formed a bearish ABCD pattern and broke below the key $50 psychological level.
→ A similar move occurred in gold, which dropped this week from around $4,375 to nearly $4,000 per ounce.
As many media outlets have noted:
→ The decline in precious metals appears to be a correction within a broader uptrend;
→ The fundamental outlook remains strong.
However, the aggressive nature of the sell-off raises concern.
→ On one hand, the drop may have been driven by an overheated rally and heavily leveraged long positions.
→ On the other, the speed of the decline suggests the autumn metals rally could be nearing exhaustion.
Technical Analysis of the XAG/USD Chart
An analysis of XAG/USD reveals several key turning points, allowing the construction of a widened ascending channel. This week’s drop has stretched the channel downward, effectively turning the former lower boundary into the new median line.
Bullish perspective:
→ The new lower boundary of the expanded channel acts as strong support.
→ A bullish RSI divergence has formed.
→ Price action near point D this morning resembles a potential Triple Bottom pattern.
Bearish perspective:
→ Selling pressure this week has been highly effective, with bears managing to break through:
$52.60, which has now flipped from support to resistance;
The $50 psychological level.
Given the above, it is reasonable to assume that bulls may attempt to use the lower boundary of the expanded channel to restart the autumn uptrend. However, after such a sharp sell-off, confidence may remain fragile. Should $50 now act as resistance, bears could target the next support near $45.88.
This article represents the opinion of the Companies operating under the FXOpen brand only. It is not to be construed as an offer, solicitation, or recommendation with respect to products and services provided by the Companies operating under the FXOpen brand, nor is it to be considered financial advice.

Silver (XAG/USD) 2-hour chart Pattern...Silver (XAG/USD) 2-hour chart, here’s a complete target analysts
---
📊 Chart Overview
Instrument: Silver (XAG/USD)
Timeframe: 2-hour
Current Price: Around $50.85
Trend: Bearish — price has broken below both the ascending trendline and the Ichimoku Cloud, confirming downward momentum.
Indicators Used: Ichimoku Cloud, Trendline, Price Action
---
🎯 Target Levels
1. 🎯 Target Point 1 (Short-Term Target):
Price Zone: $49.00 – $49.20
This matches my first “Target Point” on the chart.
It’s the next significant support level after the trendline break.
Expect partial take-profit or price pause here before further continuation.
2. 🎯 Target Point 2 (Extended / Major Target):
Price Zone: $46.50 – $46.70
This matches my second (lower) “Target Point” marked on the chart.
If bearish pressure continues and price stays below $50.50 resistance, this is the next strong downside target.
---
🧭 Summary Table
Target Type Price Level Notes
🎯 TP1 $49.00 – $49.20 First support zone / short-term profit area
🎯 TP2 $46.50 – $46.70 Extended bearish target / swing completion
🛑 Resistance / Stop Area $51.90 – $52.10 Above cloud — invalidation for short setups

XAGUSD 22 octI’ve identified a cup and handle pattern in silver, which is a bullish signal as it has already broken out. Based on the projection of this cup and handle pattern, we could see silver reaching a price range of 78-90 in the coming months. This outlook is supported by the current market situation, where gold prices are already high and the limited supply of gold, driven by massive physical gold buying recently, is making silver an attractive alternative for hedging.

SILVER (XAGUSD): Correction is Over?!
Silver shows some strength after a test of a key intraday support.
A formation of a rejection candle followed by a buying imbalance
suggests a highly probable rise.
Goal - 50.15
❤️Please, support my work with like, thank you!❤️
I am part of Trade Nation's Influencer program and receive a monthly fee for using their TradingView charts in my analysis.

Bearish Trend/Bearish Divergence on Silver, Price Likely To FallSilver is showing Bearish Momentum on 1H and 4H timeframes. Bearish Divergence has been played on both timeframes, and now a Bearish Trend has also formed on both 1H and 4H timeframes.
Price of Silver can fall further from here. Looking at this scenario, we can take a 1:1 Sell trade here. Let's see how it goes.

Stop!Loss|Market View: SILVER🙌 Stop!Loss team welcomes you❗️
In this post, we're going to talk about the near-term outlook for SILVER ☝️
Potential trade setup:
🔔Entry level: 46.91212
💰TP: 41.26205
⛔️SL: 50.07903
"Market View" - a brief analysis of trading instruments, covering the most important aspects of the FOREX market.
👇 In the comments 👇 you can type the trading instrument you'd like to analyze, and we'll talk about it in our next posts.
💬 Description: Metals have fixed intraday decline records early this week. For now, the likelihood of continued declines is higher, and a reversal is more likely. A strong factor for continued declines in silver would be the formation of an accumulation between levels 47 and 48. In this case, a drop to level 38 could be expected. The declines in metals are explained with profit-taking, thereby strengthening the USD.
Thanks for your support 🚀
Profits for all ✅
❗️ Updates on this idea can be found below 👇

XAGUSD formed a head and shoulders patternOn the 4-hour chart, XAGUSD has formed a head-and-shoulders pattern. Currently, attention should be paid to resistance near 50.6. If a rebound encounters resistance, consider continuing to sell. Support is expected near 47.5, and if it falls below, further support is expected near 45.7. If the price of XAGUSD breaks back above 52.8, the bullish trend will resume.

Silver Bearish analysis sell strong now 📉 Silver Bullion Technical Breakdown Update (1H Chart)
Silver is showing a strong bearish momentum following an inverse flag & pole breakdown from the resistance area at $52.600. 🔻
💡 Trend Outlook:
Momentum turning bearish after rejection from resistance.
Breakdown confirmation suggests further downside pressure.
🎯 Technical Targets:
1️⃣ $50.600 — First support / potential short-term target.
2️⃣ $49.300 — Second support / extended target if selling pressure continues.
⚠️ Note: Watch for potential pullbacks to retest the breakdown zone before continuation.
#Silver #XAGUSD #TechnicalAnalysis #PriceAction #Commodities #TradingSetup

long on XAGUSD. Silver tap into weekly fvg and and after that taking previous day liquidity and after that failed 4 hour bearish fvg. So market into ullish mood.

#SILVER #XAGUSD Looks a good oppturnuity to buy FX_IDC:XAGUSD Currentl at 48.850 level is an excellent oppturnuity to buy at market with Sl mentioned at 46 levels for 55---59+ levels. The market looks extremly bullish and this is the first bigger correction we are geting and seems to a good buying oppturnuity. We dont see the rally to end anytime soon.

mrmoney limited XAG/USD swing trading ideaprice formed a range demand zone which will aid price for its bullish trends

BEARISH BAT PATTERNLooking for a completion of this Bearish Bat Pattern at 46.75
After forming a new higher high on the Daily chart we have already extended to the oversold zone with rsi divergence.
Disclaimer: trade idea NOT financial advice
✌🏾☀🧘🏾♂️
