SILVER XAGUSD SILVER ,ON TECHNICAL IS going for correction and i will follow the structure to communicate the next buy position based on the price movement.
#silver #xagusd
Trade ideas

Could this be correct? Time to get defensive in my opinionThis count has perfect fib extentension and I am beginning to this the pb that we are all expecting is coming soon...very soon. To each is own, but I am going to take some chips off the table here and be ready for a decent pull back to reload...but to each his own.

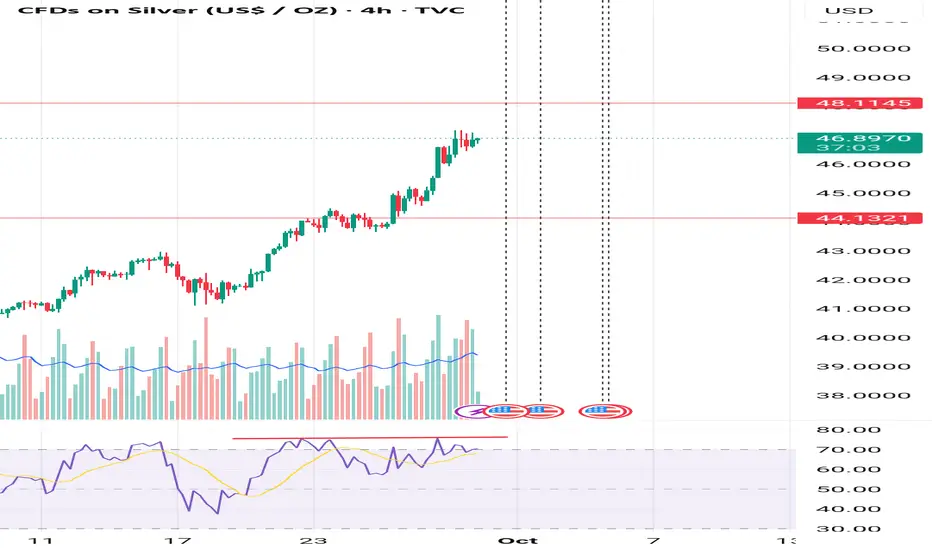
SILVER (XAGUSD): ALL-TIME HIGH AHEAD!
A bullish rally may temporarily stop soon as Silver
is approaching a major resistance cluster based on a current All-Time High.
48.0 - 50.0 zone will be an important structure from where the market may retrace.
After a pullback from that, be ready for another bullish wave and a breakout of the underlined area.
❤️Please, support my work with like, thank you!❤️
I am part of Trade Nation's Influencer program and receive a monthly fee for using their TradingView charts in my analysis.

XAGUSD Long Idea: Bullish Retest of Former ResistanceHello TradingView Community,
This post outlines a potential long trade setup on the Silver / U.S. Dollar (XAGUSD) pair, based on the 15-minute chart.
Technical Analysis:
The chart is currently in a clear uptrend, demonstrating strong buying momentum. A key horizontal level can be identified at approximately $45.947. This level previously acted as a significant resistance, where the price struggled to break through on multiple occasions.
We have recently witnessed a decisive breakout above this resistance zone, which is a strong bullish signal. The trading idea is based on the classic "resistance-turned-support" principle. We are looking for a pullback to this broken level, which is now expected to act as a new support floor. A bounce from this area would confirm bullish continuation and present a potential entry point.
Trade Setup:
The long position tool on the chart visualizes a potential trade plan for this scenario:
Entry: Approximately $45.947 (at the retest of the new support).
Stop Loss: $45.041 (placed below the support structure to invalidate the idea if the level fails to hold).
Take Profit: $48.646 (targeting a new higher high in the prevailing trend).
This setup provides a structured plan with a favorable risk-to-reward ratio for a potential move higher.
Disclaimer: This analysis is for educational and discussion purposes only and should not be considered financial advice. Trading commodities involves significant risk. Please conduct your own due diligence and manage your risk appropriately.

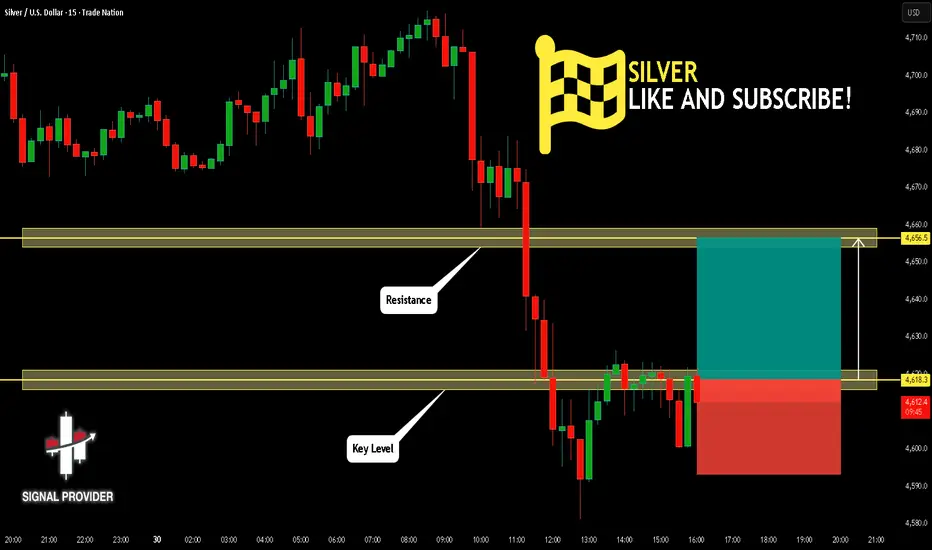
SILVER Is Very Bullish! Buy!
Here is our detailed technical review for SILVER.
Time Frame: 15m
Current Trend: Bullish
Sentiment: Oversold (based on 7-period RSI)
Forecast: Bullish
The market is testing a major horizontal structure 4,618.3.
Taking into consideration the structure & trend analysis, I believe that the market will reach 4,656.5 level soon.
P.S
Please, note that an oversold/overbought condition can last for a long time, and therefore being oversold/overbought doesn't mean a price rally will come soon, or at all.
Like and subscribe and comment my ideas if you enjoy them!
SILVER BEARS ARE GAINING STRENGTH|SHORT
SILVER SIGNAL
Trade Direction: short
Entry Level: 4,733.3
Target Level: 4,466.5
Stop Loss: 4,911.7
RISK PROFILE
Risk level: medium
Suggested risk: 1%
Timeframe: 9h
Disclosure: I am part of Trade Nation's Influencer program and receive a monthly fee for using their TradingView charts in my analysis.
✅LIKE AND COMMENT MY IDEAS✅

Silver Price: October Kicks Off with a 14-Year HighSilver Price: October Kicks Off with a 14-Year High
As the XAG/USD chart shows, today silver prices climbed above the $47.50 per ounce mark for the first time since 2011. Since the beginning of the month, silver has appreciated by approximately 15%.
Why is silver rising?
According to media reports, demand for so-called safe-haven assets has intensified amid the US government shutdown, which officially began on 1 October. President Trump has placed the blame on Democrats, while maintaining optimism that the shutdown could be leveraged to streamline the work of federal agencies.
Trading Economics further highlights that the Silver Institute forecasts a deficit in the global silver market. Production is expected at 844 million ounces – around 100 million ounces short of demand, which continues to be driven by the expansion of solar energy, consumer electronics, and data centres.
Technical analysis of the XAG/USD chart
On 22 September, when analysing the XAG/USD chart, we:
→ Drew a long-term upward blue channel, along with a steeper orange channel indicating accelerated growth.
→ Noted that the silver price had broken above the upper boundary of the blue channel and suggested that XAG/USD was in a vulnerable position for a potential correction.
Shortly thereafter (as shown by the red arrow), the price encountered resistance. However, it was insufficient to trigger a pullback, as the upper boundary of the blue channel acted as support (S), allowing silver to continue its ascent within the orange channel.
Yesterday, when reviewing the gold chart, we noted a sharp decline in precious metals at the start of Monday’s session. Although bulls managed to recover during the US session (signalling robust demand), bears remain present – underscored by today’s failure to hold above Monday’s high (marked by the black arrow).
Applying any oscillator (such as RSI) will likely reveal signs of bearish divergence, pointing to a weakening bullish momentum.
Taking the above into account, we could assume that:
→ The market remains bullish. While demand forces may be losing steam, the momentum of the rally could continue to play a significant role.
→ A correction is possible – for example, towards the lower boundary of the orange channel (S2), which is reinforced by a bullish FVG (an imbalance zone favouring buyers).
This article represents the opinion of the Companies operating under the FXOpen brand only. It is not to be construed as an offer, solicitation, or recommendation with respect to products and services provided by the Companies operating under the FXOpen brand, nor is it to be considered financial advice.

Silver To Hit $55? XAGUSD AnalysisSilver (XAGUSD) is clearly in a strong bullish trend on the daily chart. The price has broken out of previous resistance levels and continues to form higher highs and higher lows. The breakout above the $43.70–$44.00 zone shows strong demand, and daily candles are closing near their highs, which reflects strong buyer dominance. As long as price holds above the $43.70 support, momentum favors further upside.
The next major resistance sits around $50.00, followed by $52.50, and an extended move could test $55.00. Momentum indicators and price action confirm buyers are in control, with no significant bearish reversal patterns showing yet.
Trade Setup 📈
• Entry: $47.30 – $47.40
• Stop Loss: $43.70 ❌
• Target 1: $50.00 🎯
• Target 2: $52.50 🔥
• Target 3: $55.00 🏆
This setup offers a favorable risk-to-reward of around 1:2, with continuation potential if bullish momentum stays intact.

Silver Analysis – Multi-Year Highs but Correction LoomsSeptember has been a remarkable month for Silver, with prices running from the 40 zone all the way to 47.50, marking an impressive 20% gain and printing a new multi-year high.
Just like Gold, the long-term trend remains strongly bullish – no doubts there.
However, also like Gold, the recent rally looks overstretched, and history tells us that sharp corrections often follow such aggressive moves.
Yesterday, after touching above 47, Silver sold off hard and dipped to an intraday low of 45.78. Bulls quickly stepped back in, and overnight the market managed to print new highs around 47.57.
For now, the price remains elevated, but with correction looming, I believe the bearish side will eventually prevail in the short-term.
🔑 Technical Perspective:
• Key support to watch: 46.80.
• If this level fails to hold, we could see a stronger sell-off than yesterday’s, with the most appropriate near-term target sitting around 45.00.
🚀 As always, the market needs to confirm, but at these elevated levels, caution is warranted for late buyers.
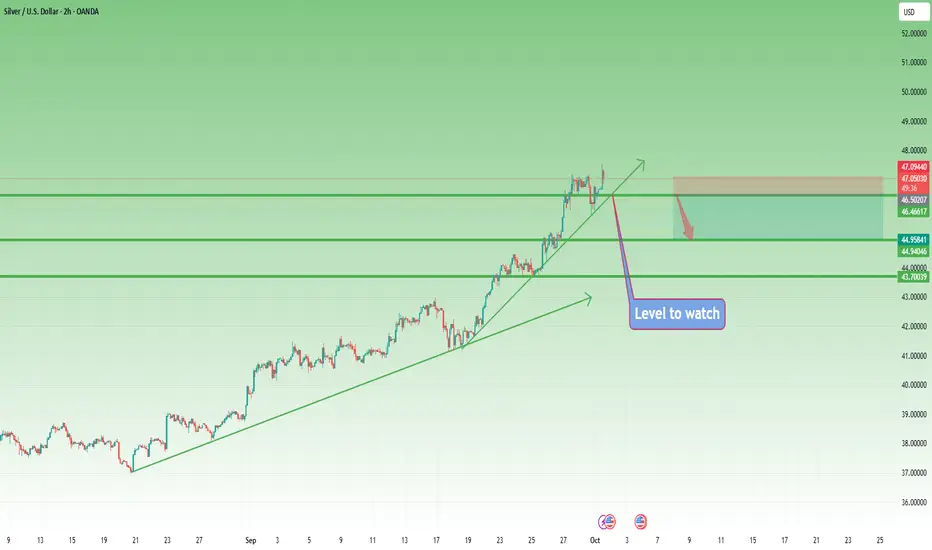
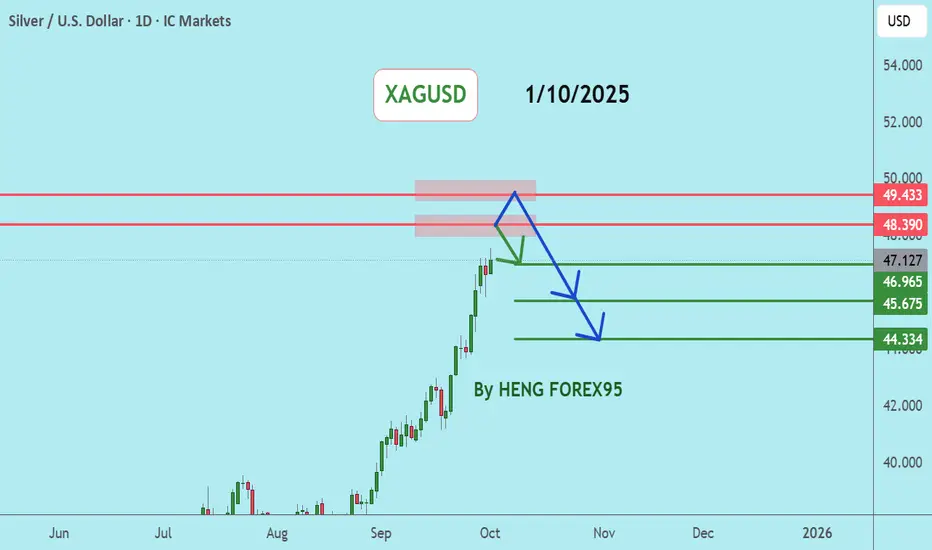
XAGUSDSilver price is in a strong uptrend. The price has a chance to test the 48.39-49.75 level, which is a key resistance zone. If the price cannot break through the 49.75 level, it is expected that the price has a chance to go down in the short term. Consider selling in the red zone.
🔥Trading futures, forex, CFDs and stocks carries a risk of loss.
Please consider carefully whether such trading is suitable for you.
>>GooD Luck 😊
❤️ Like and subscribe to never miss a new idea!
Silver’s Deficit Dilemma: Buy the Dip or Wait?Silver prices eased after touching a 14-year high, but the structural story remains intact. The Silver Institute projects a 100 mln ounce shortfall in 2025, marking the fifth consecutive annual deficit. Fiscal uncertainty and US government shutdown fears have bolstered safe-haven demand, while industrial momentum remains strong, especially from solar and electronics. Persistent deficits and rising demand suggest dips may attract renewed buying rather than signal a trend reversal.
From a technical perspective, XAGUSD broke out of the ascending channel and extended its rally, with prices testing the 100% Fibonacci Extension at 48.00. An extension of the bullish momentum may prompt further upside toward the 127.2% Fibonacci Extension and psychological resistance at 50.00. Conversely, retreating below 48.00 may see XAGUSD retrace and retest the support and bullish fair value gap at 46.00.
By Li Xing Gan, Financial Markets Strategist Consultant to Exness

XAGUSDKey Market Drivers
US Political Instability: Concerns over a potential government shutdown are driving demand for safe-haven assets like gold.
Federal Reserve Policies: Growing bets on Fed rate cuts are weakening the US dollar and supporting gold prices.
Geopolitical Risks: Renewed tariffs on global trade are adding to market uncertainty.

White Box is near term tgtThe white box on this chart is my near term target (next 3 monhts)...then we should see a pull back of some size...until then stay long and strong in my opinion. Yes there may be a few small dips along the way, but I wil not be exiting any of my longs until this zone is reached.

HIGHEST QUARTERLY CLOSE EVER!!!!!!Folks...we made history today...we have the highest quarterly close in silver in HISTORY! (yes this is in nominal terms and is not adjusting for CPI) but none the less is a historic moment. I do not now what lies ahead, but something tells me October will bring some major "happenings" that will cause precious metals to explode higher! I for one am fully loaded for the ride.
All the best to all of you!

Silver Rally Faces Profit-Taking PressureSilver has staged a strong rally throughout September, pushing prices into overbought territory across the daily, weekly, and monthly charts. As the month comes to a close, the market is showing signs of exhaustion, with traders likely to engage in profit-taking, a pattern often seen after extended bullish runs.
The key resistance remains at USD 47.50, a level that has capped upside momentum in the past. Failure to decisively break and hold above this zone could pave the way for a corrective retracement. A natural pullback toward USD 42.00 appears likely, as this level previously acted as a strong technical pivot and now serves as the next major support.
Other factors are adding to the case for near-term weakness:
- Strong U.S. dollar performance is creating headwinds for precious metals, limiting further upside in Silver.
- Bond yields ticking higher reduce the appeal of non-yielding assets like Silver, especially after an extended rally.
- From a technical perspective, momentum oscillators show overbought readings, reinforcing the risk of a corrective move.
- Seasonally, the end of the month and quarter often brings portfolio rebalancing and profit-taking, which could accelerate downside moves.
While the long-term trend for Silver remains constructive, traders should be cautious in the short term. Unless Silver breaks above USD 47.00 with conviction, a deeper retracement toward USD 42.00 or even lower levels cannot be ruled out.


SILVER Free Signal! Sell!
Hello,Traders!
SILVER Triple-top rejection at premium levels confirms distribution phase. SMC shows liquidity sweep above highs before sharp drop through neckline, shifting order flow bearish.
-------------------
Stop Loss: 4,721$
Take Profit: 4,537$
Entry: 4,632$
Time Frame: 3H
-------------------
Sell!
Comment and subscribe to help us grow!
Check out other forecasts below too!
Disclosure: I am part of Trade Nation's Influencer program and receive a monthly fee for using their TradingView charts in my analysis.

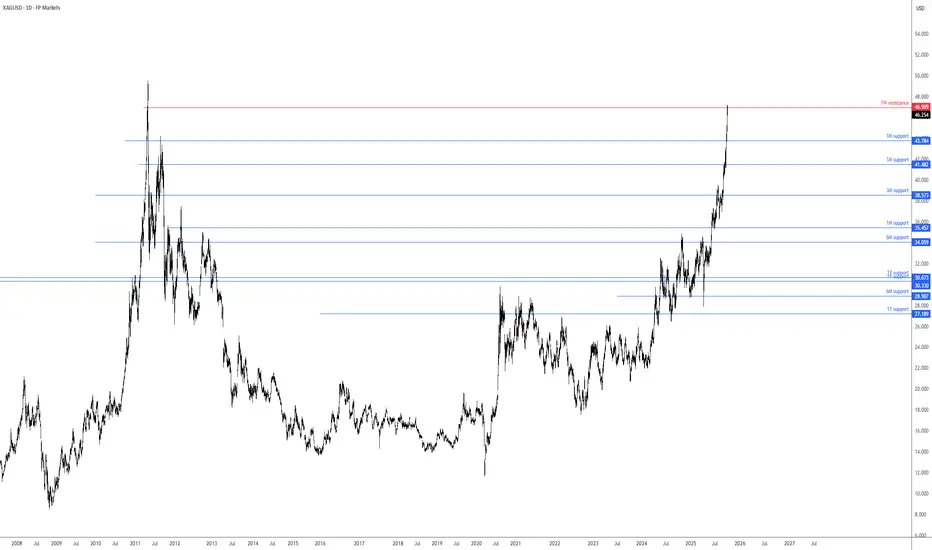
Silver to challenge all-time highs?Alongside Spot Gold (XAU/USD), which continues to set all-time highs, the price of XAG/USD has reached multi-year highs of 47.18 and tested a 1W resistance level of US$46.91.
Importantly, if US$46.91 gives way, the all-time high of US$49.51 will likely be challenged (formed in 2011). Ultimately, this remains a bullish market for the time being.
Written by the FP Markets Research Team
Silver Wave Analysis – 29 September 2025
- Silver broke resistance area
- Likely to rise to resistance level 48.00
Silver recently broke the resistance area between the resistance level 45.00 (previous upward target set for Silver) and the resistance trendlines of the 2 up channels from August and April.
The breakout of this resistance area accelerated the active impulse wave 5 of the intermediate impulse wave (3) from July.
Given the strong daily uptrend, Silver can be expected to rise to the next resistance level 48.00 (target price for the completion of the active impulse wave 5).

Silver Bullish breakout support at 4595The Silver remains in a bullish trend, with recent price action showing signs of a continuation breakout within the broader uptrend.
Support Zone: 4595 – a key level from previous consolidation. Price is currently testing or approaching this level.
A bullish rebound from 4595 would confirm ongoing upside momentum, with potential targets at:
4745 – initial resistance
4822 – psychological and structural level
4886 – extended resistance on the longer-term chart
Bearish Scenario:
A confirmed break and daily close below 4595 would weaken the bullish outlook and suggest deeper downside risk toward:
4555 – minor support
4525 – stronger support and potential demand zone
Outlook:
Bullish bias remains intact while the silver holds above 4595. A sustained break below this level could shift momentum to the downside in the short term.
This communication is for informational purposes only and should not be viewed as any form of recommendation as to a particular course of action or as investment advice. It is not intended as an offer or solicitation for the purchase or sale of any financial instrument or as an official confirmation of any transaction. Opinions, estimates and assumptions expressed herein are made as of the date of this communication and are subject to change without notice. This communication has been prepared based upon information, including market prices, data and other information, believed to be reliable; however, Trade Nation does not warrant its completeness or accuracy. All market prices and market data contained in or attached to this communication are indicative and subject to change without notice.

Potential long for XAGUSD/SilverLooking for a new potential entry for silver. Silver is really bullish, and im looking to buy and ride the price up to potential new ATH

Silver Breakout after 45 yearsVery simple.. SilverUsd chart shows a clear cup and handle for 45 years long. We should forget about short term measures like all time high, resistant, fibo etc. Let’s focus on the resistance level after the break out of 50$ . I can’t imagine , can you?
