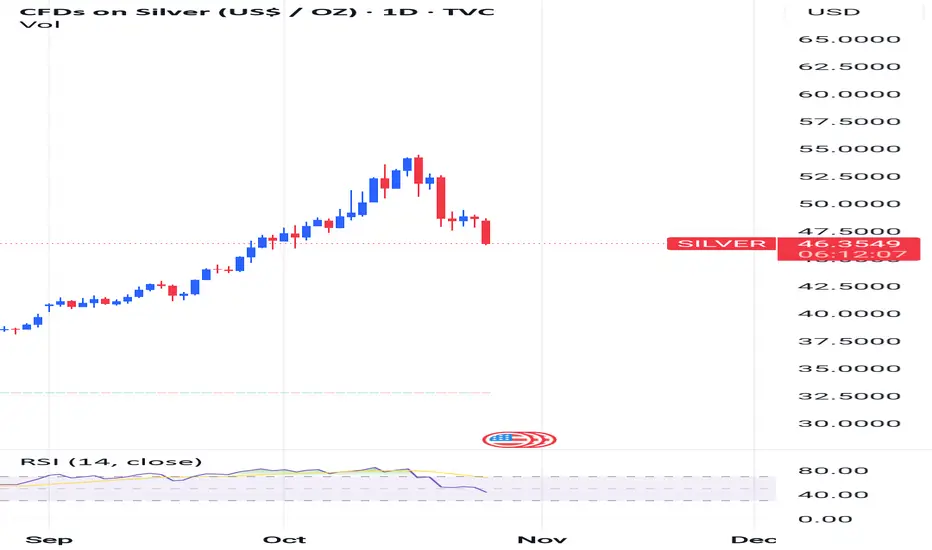
Silver - 6-month analysis and resultsThe strength of the price movement in silver has continued to increase since the 6-month analysis was sent for it, because this price analysis was done at the stop of the price movement, and with this increase in the price of silver and all metals in the financial markets, the price will increase.
Sasha Charkhchian
Trade ideas

SILVER: Will Go Up! Long!
My dear friends,
Today we will analyse SILVER together☺️
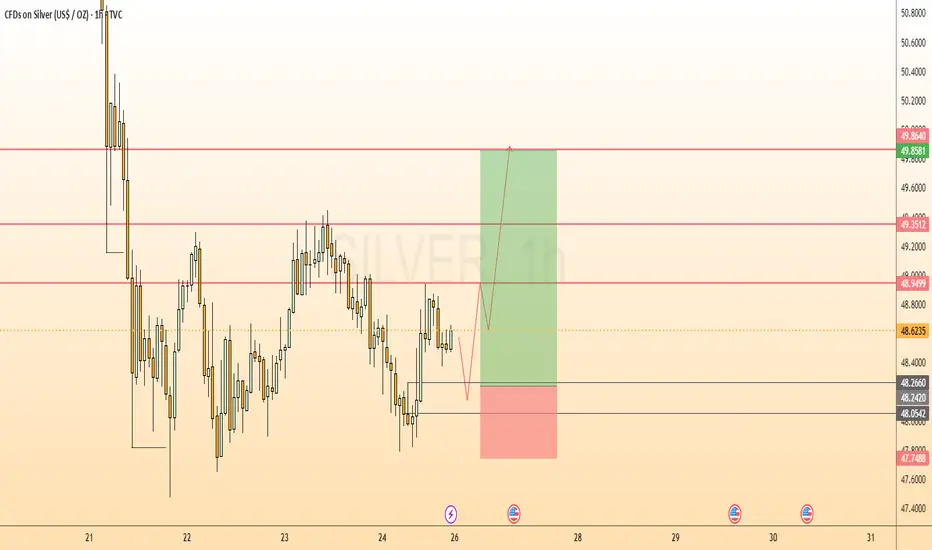
The in-trend continuation seems likely as the current long-term trend appears to be strong, and price is holding above a key level of 48.271 So a bullish continuation seems plausible, targeting the next high. We should enter on confirmation, and place a stop-loss beyond the recent swing level.
❤️Sending you lots of Love and Hugs❤️

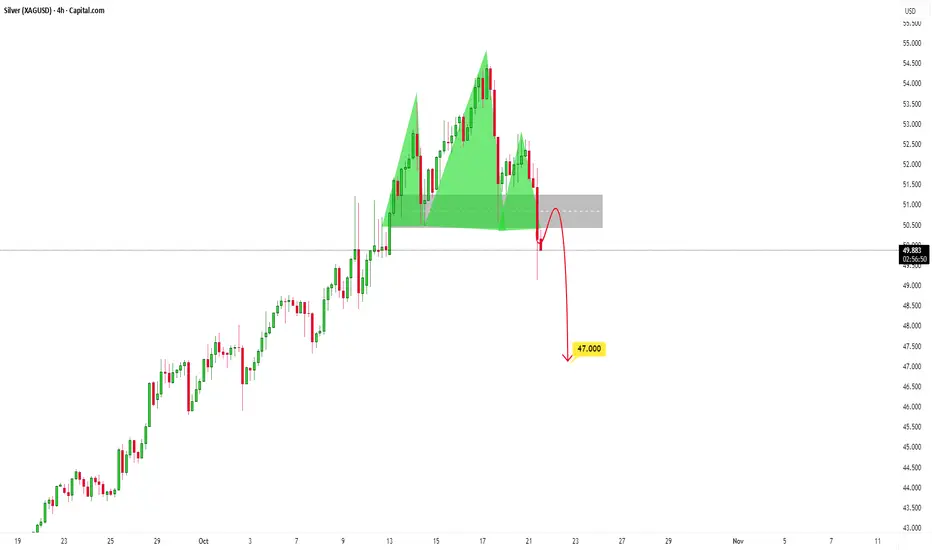
SILVER - BEARISH MOVE!Hello traders,
The Silver price failed to create a new higher high!
Currently, The higher low is broken (change of character).
So, I expect a bearish move📉
__________
TARGET: 46.99000🎯

Siver may reach ATH again but not gold. 26/Oct/25 XAGUSD based on wave substructure silver may reach ATH again next week with price touching the upper trendline ( red) 3rd time at 55 +/-

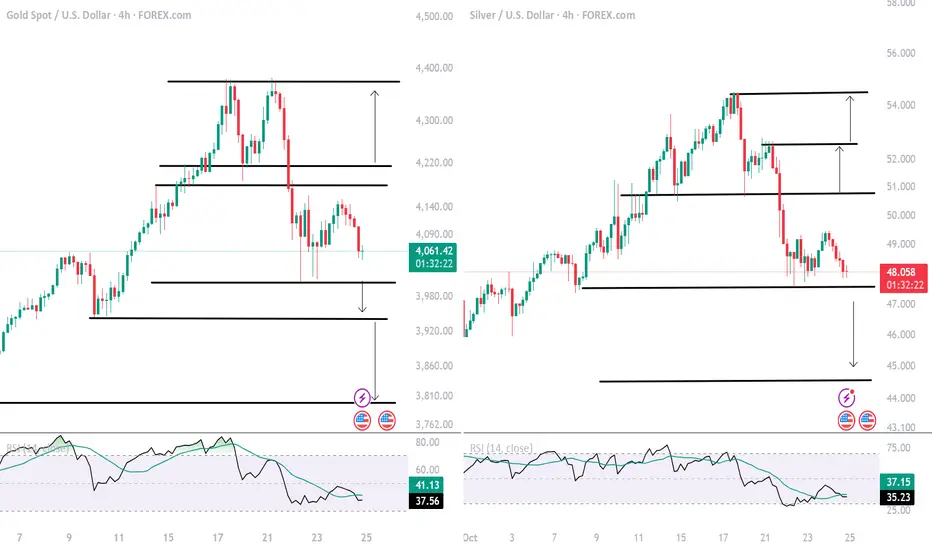
Gold, Silver Outlook: Haven Sentiment, Reversal Patterns on HoldFollowing the heated headlines on gold and silver — driving long lines outside jewelry stores and fueling intense media coverage and momentum — a contrarian signal has emerged. This signal was confirmed by classic reversal patterns, triggering the 300+ point selloff we witnessed this week.
Gold Outlook:
On the 4-hour chart, gold prices have formed a double-top pattern near the $4,380 peak, pulling back toward $4,000 support — a level that now defines two potential scenarios:
A sustained move below $4,000 — the double-top target and key support — could trigger another 300-point decline, with the next support zones around $3,920 and $3,780.
As price action remains above the target but below the neckline, the bearish bias persists. A clean break above $4,200–$4,240 would be required to reignite upside momentum toward $4,300–$4,380, after which new record highs could extend toward $4,900–$5,000.
Silver Outlook
On the 4-hour chart, silver has traced a head and shoulders reversal pattern, targeting the $47.30 level. If prices close back above the neckline at $50.80, gains may resume toward record levels, with key targets at $52.40, $54.40, and $56.60. Holding below $47 could extend losses toward $44.40 and $42.90, aligning with the trendline connecting consecutive higher highs between January 2023 and October 2024, setting up a potential bullish rebound.
- Razan Hilal, CMT
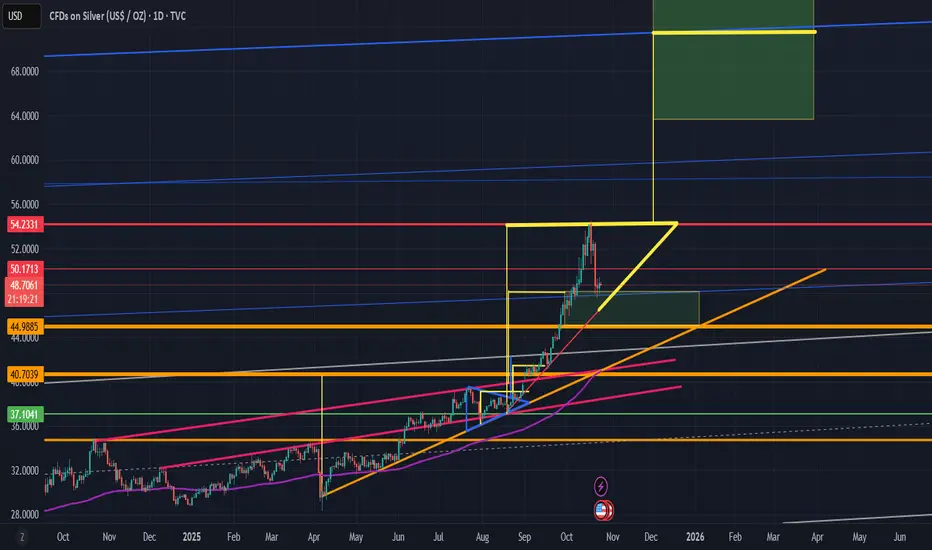
New target for silver $71 after current consolidationNew target for silver $71 after current consolidation. If you're on leverage/margin, good luck with in-between roller coaster rides.
Three Failed Probes Hint at Silver UpsideAfter three failed probes beneath $48 and a bullish engulfing candle, some upside may be in store for silver.
While entry on a pullback would be preferred, longs could be considered around current levels with a stop below $48 for protection, targeting $51, which acted as both support and resistance earlier this month.
Even though the momentum picture has changed dramatically over the past week, RSI (14) has flattened just above 50 while MACD remains in positive territory despite crossing the signal line from above. Combined, the message is one of diminished upside pressure, not an outright bearish signal. As with this setup, more emphasis should be placed on price action rather than retaining a specific directional bias.
Good luck!
DS

Silver Forms Classic Head & Shoulders Pattern: Wait for retestPrice was in a strong uptrend, with buyers clearly dominating. Each push higher showed strong momentum, but bullish strength started to fade.
The first pullback formed the left shoulder, showing early signs of hesitation. Buyers tried to regain control, pushing price to a new high, "the head", but that move lacked follow-through. This is a big clue.
When price pulled back again and formed a lower high, the right shoulder, sellers stepped in more aggressively. This was the first real sign that the trend might be shifting.
Once the neckline broke, it confirmed that sellers had taken control. A retest of the neckline could now serve as a perfect short entry point, anticipating a move toward around 47.000.
I may have been too hasty...a second lookI took a second look at the wave count from the last drop...on a micro level (15 min) you can discern a clean 5 wave pattern to make up a C leg(yellow)...therefore it is too early to call this a 5-3-5 vs a 3-3-5 pattern...if this support zone holds then we will likely see the ABC (purple) take up back up to the $50-$51 range...then the final leg down (5 wave pattern) likely to the mid $45-$46 range vs my previous target of $40-$42...
The key is to remain patient and wait for the pivot where we should exceed $60.

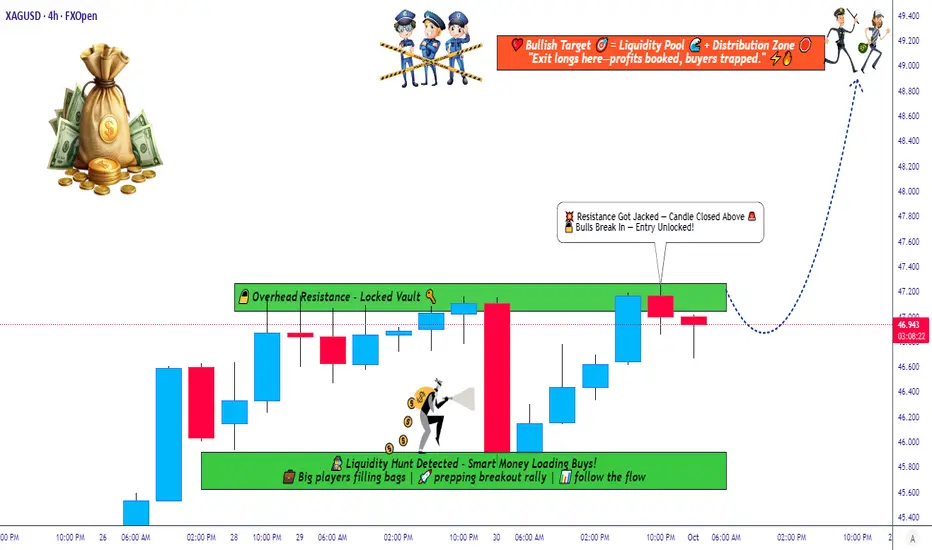
Market Insight: Silver’s Next Move Hinges on MA Breakout!🎯 XAG/USD: The Great Silver Heist - Bearish Breakout Setup! 💰
📊 ASSET OVERVIEW
Pair: XAG/USD (Silver vs U.S. Dollar)
Market: Precious Metals
Strategy Type: Swing/Day Trade
Bias: 🐻 BEARISH
🎭 THE HEIST PLAN (Trading Setup)
🔴 Entry Zone: The Breakout
Level: $49.50 (MA Breakout Zone)
Signal: Waiting for price to break below moving average support
Confirmation: Clean break with volume + momentum shift
🛑 Stop Loss: The Safety Vault
Level: $52.00
Purpose: Protection for potential pullback scenarios
Note: This SL accommodates a possible bounce before continuation down
⚠️ Risk Disclaimer: Fellow traders, this stop loss is MY risk tolerance. YOU decide your own risk parameters. Trade what YOU can afford to lose. Your money, your rules! 🎰
🎯 Target: The Escape Route
Primary Target: $47.00
Why This Level?
🚧 Strong resistance zone acting as support (role reversal)
📈 Overbought conditions on lower timeframes
Potential bull trap zone - perfect profit extraction point
⚠️ Profit Disclaimer: This is MY target based on MY analysis. YOU make your own profit decisions. Lock gains when YOUR strategy says so. Always secure the bag at YOUR comfort level! 💼
🔍 TECHNICAL ANALYSIS BREAKDOWN
Key Factors:
Moving Average Breakdown - Price rejecting MA as new resistance
Market Structure - Lower highs forming on H4/D1 timeframes
Resistance Cluster - Multiple confluences at $52 area
Volume Profile - Decreasing buy pressure
What I'm Watching:
📉 Sustained close below $49.50
📊 Volume confirmation on breakdown
🕒 Time alignment with USD strength cycles
💱 RELATED PAIRS TO MONITOR (Correlation Watch)
Metals Family:
XAU/USD (Gold) - Moves in tandem with silver ~70% correlation
GC1! (Gold Futures) - Leading indicator for precious metals sentiment
HG1! (Copper Futures) - Industrial metals correlation
USD Strength Plays:
TVC:DXY (Dollar Index) - Inverse correlation with metals
FX:EURUSD - Risk-on/risk-off sentiment gauge
FX:USDJPY - Safe haven flow indicator
Key Point: When DXY 📈 = Precious metals 📉 typically. Watch Fed policy signals and real yields for directional bias!
🎪 THE "THIEF STYLE" STRATEGY PHILOSOPHY
This setup follows the "steal profits when the market sleeps" approach:
🎯 Identify overextended moves
⏰ Wait for breakout confirmation
💨 Execute with precision
🏃 Escape before the reversal
It's all about timing, patience, and taking what the market gives!
Conduct your own research (DYOR)
Use proper risk management
Never risk more than you can afford to lose
Consider consulting a licensed financial advisor
💼 No Guarantees: No trading outcome is guaranteed. Markets are unpredictable. Trade responsibly!
📢 ENGAGEMENT FOOTER
✨ "If you find value in my analysis, a 👍 and 🚀 boost is much appreciated — it helps me share more setups with the community!"
🏷️ HASHTAGS
#XAGUSD #Silver #PreciousMetals #BearishSetup #SwingTrading #DayTrading #ForexTrading #MetalsTrading #TechnicalAnalysis #BreakoutStrategy #SilverTrading #USD #DXY #ForexSignals #TradingIdeas #ChartAnalysis #PriceAction #RiskManagement #ForexCommunity #TradingView #MarketAnalysis
🎬 End of Analysis | Trade Safe, Trade Smart! 🎬

SILVER LIKELY TO GO HIGHER|LONG|
✅SILVER is currently trading within a bullish dealing range between the demand and supply areas. After engineering liquidity beneath internal equal lows, strong displacement confirms bullish order flow. Expect continuation toward external liquidity above 50.50$. Time Frame 4H.
LONG🚀
✅Like and subscribe to never miss a new idea!✅

Silver Punches 45-Year Trend Line and Gets A Return PunchSilver prices reached a 45-year trend line going back to 1980 and has since retreated. The monthly candle for October is drafting a large wick to the upside similar to a shooting star candle formation.
In the video, we discuss some downside targets for XAGUSD of this correction that would be considered 'normal' after such a large runup.
Typical Elliott Wave patterns like this would call for a retracement back to the mid-40s and possibly $36-37.
See our written post from Sept 5 (attached below) when we mentioned "if silver does plow above $4.92, then the 1980 trend line will likely offer a bearish reaction."

Silver Strategy Map — Thief Layers, Smart Targets, and Risk Zone📊 XAG/USD “Silver vs U.S Dollar” — Metals Market Wealth Strategy Map (Swing/Day Trade)
🔑 Plan: Bullish Setup
This setup follows the “Thief Strategy”, which means using layered limit entries to scale into the trade. Instead of going all-in at one level, we “steal the entries” across multiple layers.
💰 Layered Buy Limit Entries (Example Setup):
46.200
46.400
46.600
46.800
47.000
👉 You can increase layers as per your own plan and risk style.
🛑 Stop Loss (Protective Exit): 45.600
(This is my thief SL — but you’re free to adjust as per your own risk appetite.)
🎯 Target Zone: 49.000
⚠️ Around 49.300, we see a “Police Barricade” (heavy resistance + overbought conditions + potential trap).
That’s where profits should be taken — escape with gains before the trap closes!
Why This Setup?
Support Zones: Strong accumulation zones forming near 45.600–46.000.
Trend Bias: Silver remains bullish in the medium-term metals market outlook.
Layering Strategy Advantage: Reduces entry risk and allows better average fill.
Profit Zone: 49.000 aligns with strong supply area + RSI extension risk.
🔗 Correlation & Related Pairs to Watch
OANDA:XAUUSD (Gold vs USD): Gold often leads Silver’s moves — watch Gold for early signals.
TVC:DXY (US Dollar Index): A weaker USD usually boosts metals.
TVC:PLATINUM & CAPITALCOM:PALLADIUM : Industrial metals correlation — strong moves here can influence Silver sentiment.
TVC:SILVER Futures: Always track COMEX Silver contracts for volume confirmation.
✨ “If you find value in my analysis, a 👍 and 🚀 boost is much appreciated — it helps me share more setups with the community!”
📌 Disclaimer: This is a Thief-style trading strategy, created just for fun and educational sharing. Not financial advice — trade at your own risk.
#XAGUSD #Silver #Metals #TradingStrategy #SwingTrade #DayTrade #ThiefStrategy #Gold #DXY #Forex #Commodities
Bullish idea for silverIt's been very exciting to watch to watch gold and silver tearing up the charts. We've seen a beautiful retracement on silver (and gold as well).
Silver cleared that OB and now I'm waiting for any meaningfull reaction to this area of interest.
Ideally I would like to see it touch the edge of the low volume node (blue) and start making bullish structure. That would be my cue to step into a long position. TP would be near the last ATH, but with the given market conditions I would rather trail my SL further into profit.
If price fails to bounce of the low volume node, we might see a further drop to the 43,500 area.
For now we just set alerts and monitor PA

Bounce BackIn Upper Level Warn In Advance, Don't Make new Positions here.
Now Silver down 16.8 % in just 2 weeks.
Now 44.88/45.88$ some Support zone.
Some Bounce Back Possible at this level.
Keep in mind we play only for dad cate bounce.
SILVER UpdateNext move on the way, focus on proper risk management & stay disciplined. Wishing you successful trades..!
Key Reason:
1. 1H Bullish OB formation.
2. BISI still in pending.
3. From this zone possible bullish move expected.
Let's see how it will work.
XAG/USD – SELL Entry (H1- Wedge Breakout Pattern)The XAG/USD Pair, Price has been trading within a Wedge Pattern on the H1 chart, forming consistent higher highs and higher lows. Price action is now testing the upper boundary of the Pattern, signalling a possible breakout. OANDA:XAGUSD
✅Market Context:
1️⃣Strong Upward Structure Inside the Pattern.
2️⃣Buyers are showing strength near Resistance.
3️⃣Breakout above the Trendline indicates Momentum continuation toward higher zones.
✅Trade Plan:
Entry: Buy after Confirmed Breakout above the Resistance (H1 candle close above trendline or retest of the breakout).
💰Take Profit (TP): At the Key Zone – a Major Resistance area identified ahead.
🛑Stop Loss (SL): Below the Pattern Structure.
✅Psychological Discipline :
1️⃣Stick to plan – No Revenge Trades.
2️⃣Accept losing trades as Part of the Strategy.
3️⃣Risk only 1–2% of your account balance per trade.
💬 Support the community: If you found this useful, drop a 👍 like and share your thoughts in the comments!
⚠️ Disclaimer: This analysis is for educational purposes only and does not constitute financial advice. Forex trading involves high risk. Trade only with capital you can afford to lose and always do your own research.

Silver at critical resistance, is a great collapse next?Silver has a long history of dramatic price spikes, each coinciding with significant global macro events:
June 1980, the Hunt Brother’s squeeze sent silver parabolic before collapsing
March 2011, post Global Financial Crisis (GFC) stimulus + QE mania led to another blow off top
Present day, amidst chaotic politics and incomprehensible levels of debt price action is once again testing the same resistance zone around $50
This area has proven to be a multi-decade resistance. Each prior approach ended in a swift and brutal correction.
Technical analysis
Monthly chart: Price action has surged aggressively. 300% since the lows of 2020 to the $45-50 resistance band, mirroring the same vertical rallies of 1980 and 2011.
RSI: A long term descending RSI resistance line connects the 1980 and 2011 tops. Current RSI is once again colliding with this barrier, hinting at exhaustion.
Momentum: While silver is undeniably strong, history suggests the upside risk may be limited at these levels compared to the downside potential.
Risk reward breakdown
Upside potential: A clean breakout above $50 could open the door to a true price discovery phase possibly $60+ if silver enters a secular commodities super cycle.
Downside risk: Failure here would mimic the historic collapses:
1980: -90% drawdown
2011: -70% drawdown
A pullback to $25-30 would not be unusual, especially if macro liquidly tightens.
Trading strategy ideas:
Aggressive traders: Consider short setups or profit taking near the $50 resistance, with stops above $52-53 to manage risk.
Conservative traders: Wait for confirmation, either a monthly breakout or close above $50 (bullish) or a strong rejection signal.
Conclusion
Silver has once again like Gold reached historic levels. The risk/reward profile favours caution here on. History shows that vertical rallies into this level tend to end poorly for late longs. Unless silver breaks and holds above $50, the probability of a deep correction remains high.
Is it possible price action continues higher? Sure.
Is it probable? No.
Ww

XAGUSD - Signal#XAGUSD - Signal
H4 - Formation of the 3rd wave + breakout of the trend line. Stop behind the high of the 2nd wave.
Entry: 47.72828
TP: 46.31355 - 45.58804 - 44.36677 - 41.16757
Stop: 49.09465

#XAGUSD(SILVER):Is Bull Run Over? Major Correction On the Way? Dear Traders,
Silver has experienced a significant decline since the DXY began to recover. The price is likely to continue falling and we believe this may be the commencement of a major decline. We anticipate a smooth drop based on previous price reactions.
**Potential Entry Zone:**
- Enter when the price reaches the FVG area marked with a white box. The initial take profit can be set at $45 and the swing trade at $40.
**Support:**
- We would appreciate your support by liking and commenting on our ideas which will encourage us to post more in the future.
Team Setupsfx

SILVER XAGUSDSILVER IS POSITIONING FOR BUY FROM THE CURRENT PRICE ACTION BY CLOSE OF THE WEEK.AS THE MARKET OPENS I EXPECT A BULLISH CORRECTION INTO BREAK OF THE ASCENDING TRENDLINE (BAR).
SILVER IN CONTEXT.
Silver is a multifaceted precious metal valued for both its industrial applications and status as a store of value. It plays an essential role in various sectors due to its unique physical and chemical properties.
Key Characteristics of Silver
High Electrical and Thermal Conductivity: Silver is the best conductor of electricity and heat, which makes it indispensable in electronics and electrical applications.
Antimicrobial Properties: Silver is widely used in medical settings for wound dressings, coatings, and sterilization due to its germicidal capabilities.
Reflectivity: Its high reflectivity makes it useful in solar panels and certain optical applications like mirrors.
Major Industrial Applications
Electronics: Components such as switches, connectors, and conductive adhesives rely heavily on silver.
Solar Energy: Photovoltaic cells in solar panels use silver paste for efficient electricity generation.
Healthcare: Used in antimicrobial coatings and medical devices.
Jewelry and Silverware: Traditional uses, often mixed with other metals in alloys.
Other Uses: Batteries, photographic films (though decreased with digital), and catalysts.
Investment and Market Insights
Silver is traded actively as bullion, ETFs, futures, and options.
It tends to have higher price volatility compared to gold due to its dual role as an industrial metal and investment asset.
Price movements are influenced by industrial demand, inflation expectations, USD strength, and geopolitical factors.
Silver often has a strong correlation with gold but can diverge due to shifting industrial demand.
Summary
Silver’s importance spans from critical industrial applications in electronics and green energy to safe-haven investment. Its market price reflects a complex balance between industrial use and investment-driven demand, contributing to its volatility and attractiveness.
This makes silver an important commodity for diversified investment and industrial strategy.
TRADING STRATEGY.
WATCH US10Y
WATCH DXY DOLLAR INDEX
WATCH KEY SUPPLY AND DEMAND STRUCTURE FROM THE CHART.
RISK MANAGEMENT IS KEY.
#XAGUSD #SILVER #DOLLAR #DXY

SilverTechnical Analysis – XAG/USD (Silver)
After a strong downtrend, the price of silver (XAG/USD) shows clear signs of seller exhaustion at the 48,000 level, which now acts as key support. A breakout of the downtrend line indicates a possible reversal and renewed buying momentum.
As long as the price remains above support, the outlook favors an upward movement toward the resistance at 51,500–52,000, where the next point of liquidity and selling interest is located.
*A close below 47,800 would invalidate the bullish scenario.

XAGUSDTrading forex based on strong fundamentals is beneficial because it allows investors to make informed decisions grounded in real economic data rather than speculation. By analyzing key indicators like interest rates, inflation, GDP growth, employment, and geopolitical stability, a trader can anticipate currency movements driven by macroeconomic forces. This approach helps identify long-term trends and reduces emotional or impulsive trading, offering more consistent and sustainable profits. In essence, good fundamentals turn forex trading from a gamble into a strategic investment rooted in economic reality.
