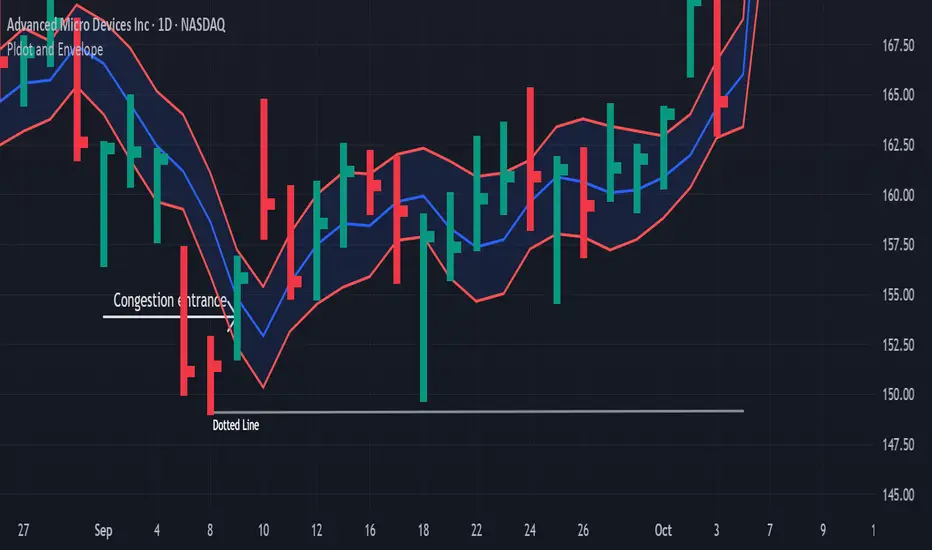
DG -How the Dotted Line Sets Up🔹 Definition
The Dotted Line marks the termination of a prior trend.
It’s drawn at the highest high of an uptrend or the lowest low of a downtrend.
Together with the Block Level , it defines the outer edge of congestion — where trend energy has been spent and the market is preparing to shift direction.
When the dotted line begins to appear, it signals that momentum is fading and buyers or sellers are losing control .
⚙️ How the Dotted Line Sets Up
A dotted line setup develops through a series of termination events — signs that price can no longer advance in the direction of the trend.
Multiple 5-9 terminations begin holding on close.
This clustering shows price repeatedly failing to continue.
After 5-9s, a 5-2 termination starts to hold — often from one or two bars back.
If no 5-2s are visible, a 5-1 termination may take over, often combined with a 1-1 zone for added resistance or support.
A 6-1 termination then confirms the exhaustion phase.
Any existing c-wave (momentum thrust) will stop immediately — energy has run its course.
The envelope confines (top or bottom) begin to hold against the trend. This marks the containment of price movement.
If price reaches a further-out area , it typically converts to a nearby zone on the next bar — energy compresses inward.
The setup is confirmed only when the nearby support or resistance holds .
⚖️ Nearby Support and Resistance
“Nearby” zones are the areas of immediate price engagement — where short-term pressure builds and releases.
They are formed from:
PL Dot or Live PL Dot
1-1 zones
5-9, 5-2, 5-1, 6-1 terminations
Envelope borders and main channel lines
Interpretation Guide :
If Close > Envelope Top → nearby support lies between the Envelope Top and PL Dot.
If Close < Envelope Bottom → nearby resistance lies between the Envelope Bottom and PL Dot.
When price is inside the envelope , the PL Dot serves as the market’s balance point.
🧩 Summary
The Dotted Line marks the end of a move — a termination zone , not a breakout.
When it forms:
Terminations (5-9 → 5-2 → 5-1 → 6-1) appear in sequence.
The c-wave loses strength.
The envelope contains price.
Nearby levels begin to hold.
This is where trend energy fades and the next structure begins —
a pause, reversal, or new congestion phase .
Trade ideas
AMD short term bullish. Price is expected to have sought its SSL and Receiving nice reaction from Previous Bull POI which was that Bullish Breaker and thus Seeking new Price discovery for short term.
Thus it is very good chance that Price will visit that Bearish Breaker first in next few weeks.
DYOR. This isn't a financial advice. This is just educational and speculative idea.
Your gains or losses are your own responsbility.
If you like this idea, please give it a thumbs up.

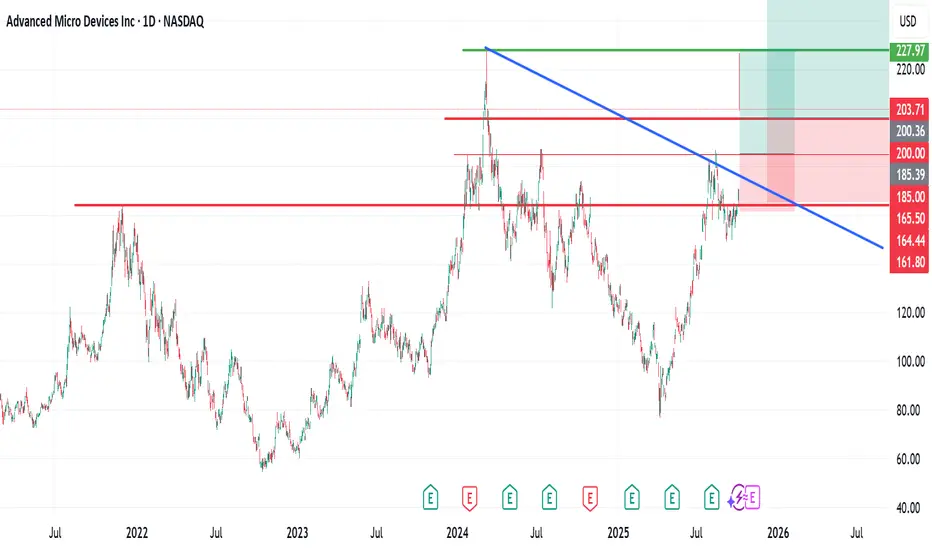
AMD OCT - 2025AMD rejected at the 227–230 supply (“TOP”) after a vertical run, signaling near-term distribution at the highs. First support sits around 205–200; losing it opens a gap-fill path into 192–185 toward the rising trendline. Prior absorption shows around 160s, and a deeper legacy support remains near 122 if momentum fully unwinds.
• Target up: 227–230 retest; above that, 240–245 along the channel.
• Target down: 200 → 192–185 gap fill; extension 160s, then 122 on capitulation.
#AMD #globaltrade #investment #investing #stockmarket #wealth #realestate #markets #economy #finance #money #forex #trading #price #business #currency #blockchain #crypto #cryptocurrency #airdrop #btc #ethereum #ico #altcoin #cryptonews #Bitcoin #ipo

$AMD Pullback DueAMD is tagging the 3SD of Bollinger Band on daily and weekly. Pullback to $213 is possible and it is a good level to sell puts against.

AMD ATH BREAKAMD breaking the all time high right now. Had the open ai news and gapped up 30% Monday with tons of call flow follow through.

Hello trader, last Tuesday, July 10, 2025 AMD 211.51www.tradingview.com
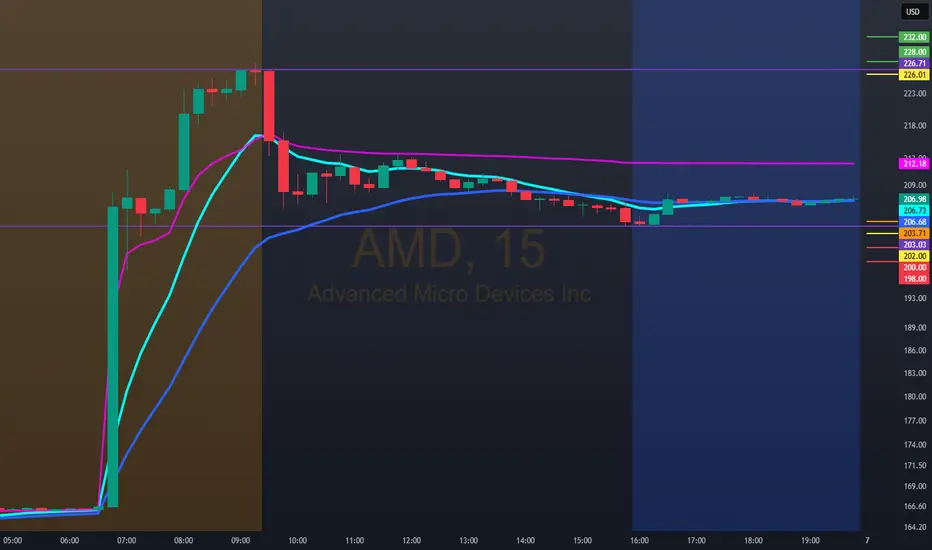
we scheduled a bullish entry in
AMD: Our bullish entry should be above 232.00; our bearish entry should be just below 198.00.
This is what happened today at the open.
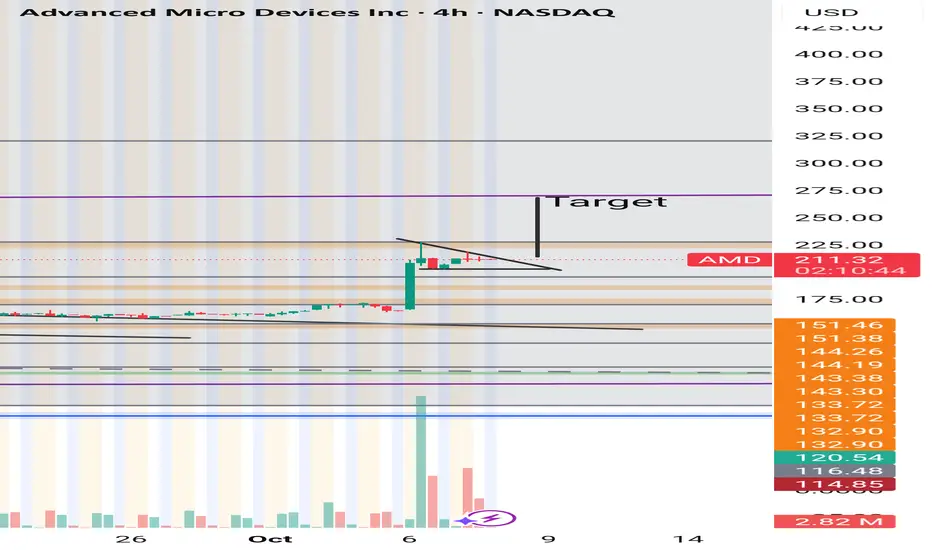
Bullish pennant pattern!Possible bullish pennant pattern forming on this 4hr chart!
- Bullish scenario, needs to break 219 and hold for validation on this trade!
- Bearish scenario, breaks 201 and continues down to support.
-Not financial advice! This is just for entertainment purposes only! This is my personal opinion.
Short - AMDTime period for this play : week to months
Analysis : Elliot wave 12345 ABC. Expect hitting .618 and bounce back up to go higher.
Pattern if wave B completed : Head & Shoulder
Price Target: Wave ABC
ETA Timeline for correction. Please refer to the chart.
Upcoming events:
Tariff active on 8/1/25 - Friday
Earning on 8/5/25 - Tuesday
Top is not in yet, so 2 Possible top-in levels:
Top 1 - $163.45 : Retesting to hit 163.45, rejected, and break $158
Top 2 - $173.94 : Breaking 163.45 and reject at 173.94
=> Overall, It begins trading side way and show some weakness now.
The correction may not pull back to .618, which is the best level. Other scenarios:
- 0.5 fib, where it test wave 3
- 0.328 fib, strong bullish level if it doesn't break & go to the upside faster

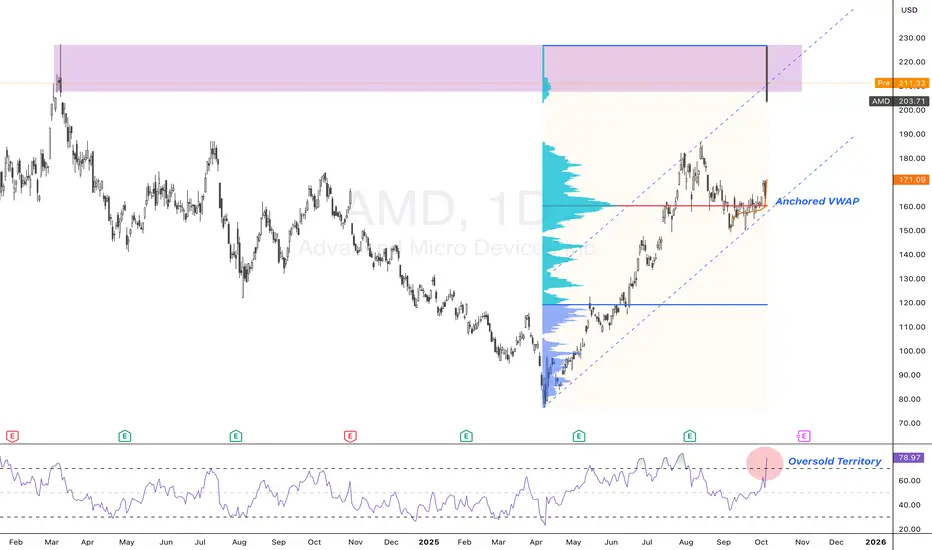
AMD watch $202 below 213 above: Major Golden fibs hold the surgeAMD got a monstrous surge from deal with OpenAI
Touched its ATH and retraced into a double Golden zone.
Expending to consolidate within the range then break.
$ 213.76 is a Golden Genesis above.
$ 202.82 is a Golden Covid fib below.
$ 217.05 is a minor Covid and was ATH.
.
See "Related Publications" for previous plots such a as this recent TOP CALL:
Hit BOOST and FOLLOW for more such PRECISE and TIMELY charts.
We post timely updates with accurate mapping of trade targets.
========================================================
.

AMD: Big AI Deal, Bigger Expectations — But Caution Near HighsAMD ripped +37% after announcing a 6 GW GPU supply deal with OpenAI, including a 10% warrant structure tied to performance and stock price.
Yes, the partnership validates AMD as a serious Nvidia rival — but much of that sentiment is already priced in.
Now we enter the quiet phase:
Revenue from the deal won’t hit until 2H 2026
No near-term earnings catalyst
No immediate follow-through customer (yet)
Price is retesting March 2024 highs. A double top may be forming — or just healthy consolidation. Until real revenue shows up or a new win (Meta, AWS, etc.) breaks the news cycle, this may drift or correct.
Treat the March 2024 resistance as key. Eye the April rally leg for a possible pullback zone. High expectations, but execution is everything now.
AMD Shares Surge After Partnership Announcement with OpenAIAMD Shares Surge After Partnership Announcement with OpenAI
According to media reports:
→ The deal involves AMD supplying processors of various generations to support the deployment of artificial intelligence infrastructure with a total capacity of 6 gigawatts.
→ The partnership is expected to generate billions in revenue for AMD starting in 2026.
→ Barclays analysts have raised their price target for AMD shares from $200 to $300.
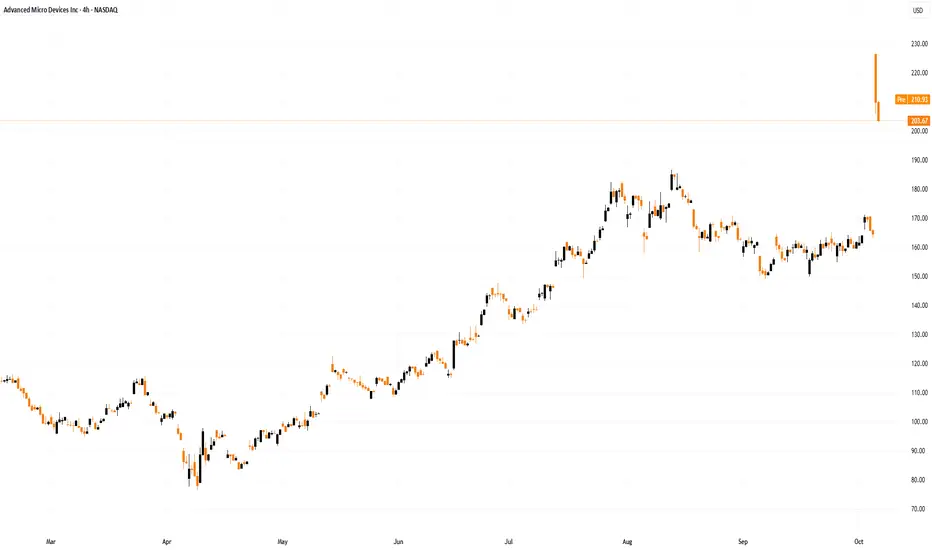
The major announcement fuelled a sharp rally of around 30% in AMD’s share price, though this surge triggered aggressive selling pressure near the historic peak around the $227 level.
Technical Analysis of AMD Stock Chart
Price action analysis shows that:
→ The trading session opened with a wide bullish gap, breaking through the key psychological level of $200.
→ The price also surpassed previous resistance levels at $180 and $190.
→ During the session, the price pulled back, forming two large bearish candles on the four-hour chart.
A reasonable interpretation:
→ The initial reaction was highly emotional, but the optimism is fading quickly.
→ The price movement indicates strong bearish activity following the sharp rise.
Selling pressure is being driven by:
→ Investors locking in substantial profits now, as the deal’s financial impact will unfold gradually over time (creating future opportunities to re-enter at lower prices).
→ Technical signs of an overbought market.
Signs that AMD shares may be overbought include:
→ The RSI indicator, which exceeded 80 yesterday.
→ The price opening significantly above the upper boundary of the ascending channel.
Possible Scenarios for AMD Stock Price
Short-term: Bearish activity could drive a correction towards:
→ The median line of the ascending channel, where demand and supply typically balance.
→ The psychological level of $200, which may influence sentiment among traders reacting to the news.
Long-term: AMD shares remain fundamentally attractive, given that:
→ The AI boom continues to serve as a major growth driver.
→ Market participants expect the Federal Reserve to begin cutting interest rates.
This article represents the opinion of the Companies operating under the FXOpen brand only. It is not to be construed as an offer, solicitation, or recommendation with respect to products and services provided by the Companies operating under the FXOpen brand, nor is it to be considered financial advice.
AMD - Bull Rush IdeaAn idea suggesting a surge in price for AMD
This is made by comparing a previous situation on chart with current (grey rectangles) within the channel in blue
This is the 3 Monthly chart for AMD which is a very long timeframe
RSI also shows a cool pattern of rise and then long stagnation then right now a sharp rise.

AMD woke up from sleep; It was its timesAMD Update and New Outlook.
In my previous forecast, I maintained a bullish stance on AMD, identifying entry zones between $176 – $172 and projecting a potential move toward $200, with a longer-term target near its all-time high of $226.
Following the recent news of OpenAI acquiring a 10% stake in AMD, the asset successfully reached my forecasted targets.
After the subsequent rally, AMD has experienced a natural pullback, presenting fresh long-term opportunities.
I’m currently watching two new buy zones at $200 and $185 for potential long-term positions.
As always, this is not financial advice. Please conduct your own research (DYOR) before making any investment decisions.
Connect with me here on TradingView. Please, like, follow me and connect.
Previous forecast
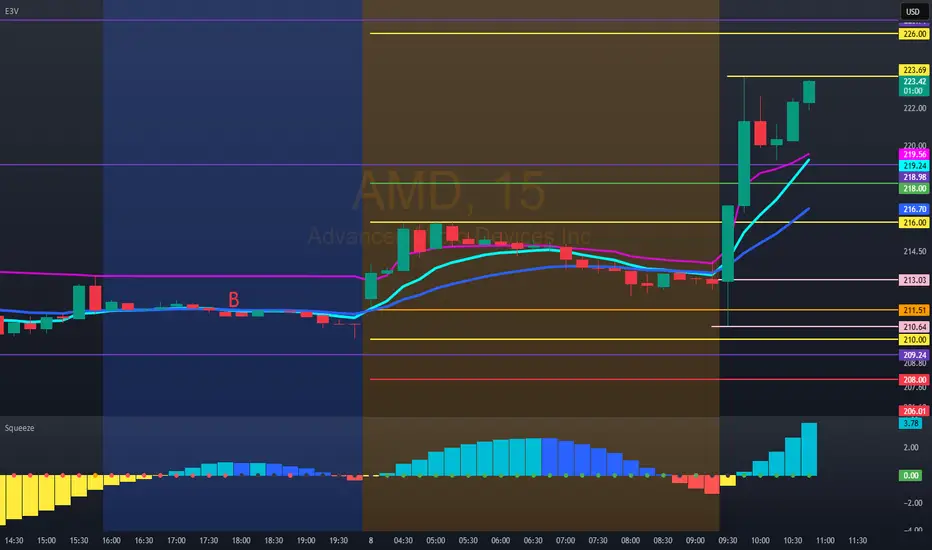
Hello trader, for tomorrow, AMD: 203.71 10/7/25 12:48 amPossible scenario: If the price opens above the previous day's closing price, we could have a quick bullish entry up to 226.00. Scenario #2: Our bullish entry should be above 232.00; our bearish entry should be just below 198.00.
AMD to $250+The AMD chart setup is fantastic. It dropped almost 70% with RSI value 25 during last bearish downtrend. But when it broke out, it went up over 200%! Recently, it also broke out from another bearish downtrend after similar price drop and RSI value. If it mirrors the last move, current uptrend will take it to $250-$320.
The current uptrend is supported by the fundamental development in both the consumer PC and data center markets.
Consumer PC - AMD long won the CPU war against Intel . Now with the Ryzen AI Max+ PC, APU (CPU+GPU on the same chip!), and 128 GB unified memory, it offers a serious alternative to Apple M4 series for local/offline AI workload. Recently Nvidia and Intel are joining forces to create a x86 RTX custom chip. I see it as a huge validation of AMD's APU approach.
Data Center - AMD MI350 is already competing head to head with Nvidia B200 on the chip level. But Nvidia still excels on highly optimized software and rack scale networking. AMD is catching up on both front with recent ROCm 7.0 software releases and next-gen MI400 with integrated networking tech from the previous ZT Systems acquisition.

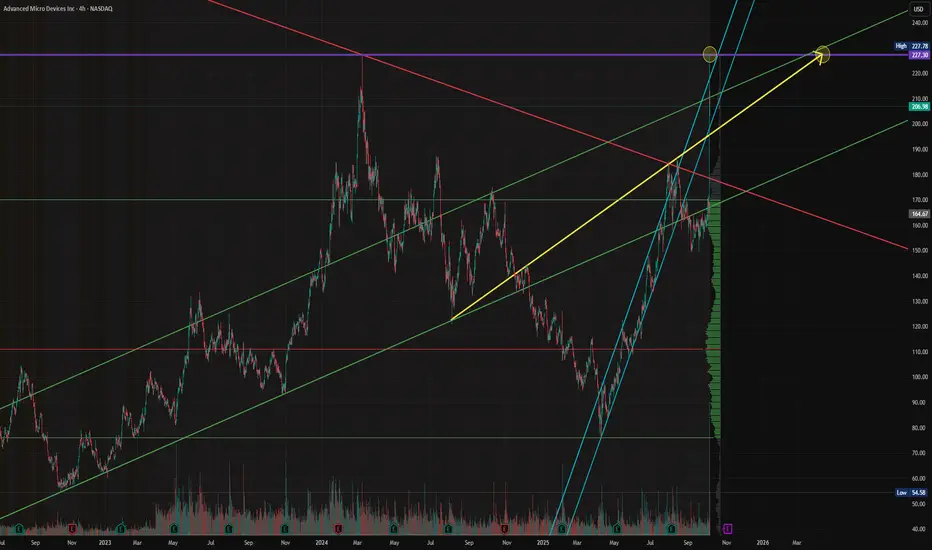
$AMD - Advanced Micro Device - $227.30 RetestNASDAQ:AMD continues its 2025 recovery rally — now clearing $200 and targeting the $227–$240 macro resistance zone.
After reclaiming the $165 structure break, AMD has re-entered its long-term ascending channel and is showing renewed strength in the AI-chip cycle.
Holding above $190 keeps this setup intact for continuation.
#AMD #AIStocks #Semiconductors #NASDAQ #BreakoutTrading #MyMIWallet
AMD Best Level to BUY/HOLD 300% gains SWING TRADE🔸Hello traders, today let's review recent price chart for AMD.
Well defined swings in progress, expecting further downside before
the tide finally turns for AMD bulls. Currently it's recommended to stay out.
🔸AMD is trailing behind NVDA massively, so eventually AMD will to the
mean reversion trade and start to catch up with NVDA, however currently
pullback/correction mode in progress.
🔸Well defined swings - 160 to 58 65% correction, then 58 to 210 280% gains,
210 to 75 represents 65% correction, 75 to 290 is a 280% pump.
🔸Recommended strategy bulls: Bulls wait for correction to complete at/near 75 usd in January 2025 and get ready to BUY/HOLD low, this is a swing trade setup, so will take longer to hit target, patience required. final TP is 290 USD, 280% upside off the expected lows. good luck traders!
🎁Please hit the like button and
🎁Leave a comment to support our team!
RISK DISCLAIMER:
Trading Futures , Forex, CFDs and Stocks involves a risk of loss.
Please consider carefully if such trading is appropriate for you.
Past performance is not indicative of future results.
Always limit your leverage and use tight stop loss.

Will AMD recover and catch up with NVDA? updated/Revised Outlook🔸Hello traders, today let's review 2days/candle price chart for AMD.
Price contained within bullish channel since 2021, however currently
pullback/correction in progress.
🔸65% correction in progress, based on previous swings expected to complete at/near 88/90 USD in Q1 2025. Until then it's recommended to stay out.
🔸Once we bottom out near 90 USD in Q1 2025, expecting bullish swing 265% gains off the lows, so projected high is 310/320 USD.
🔸Recommended strategy bulls: Bulls wait for correction to complete at/near 85 usd in Q1 2025 and get ready to BUY/HOLD. Bullish impulse / reversal off the lows price target based on measured move projection is 310/320 USD. patience required, do not expect miracle/overnight gains in this market. good luck!
🎁Please hit the like button and
🎁Leave a comment to support our team!
RISK DISCLAIMER:
Trading Futures , Forex, CFDs and Stocks involves a risk of loss.
Please consider carefully if such trading is appropriate for you.
Past performance is not indicative of future results.
Always limit your leverage and use tight stop loss.

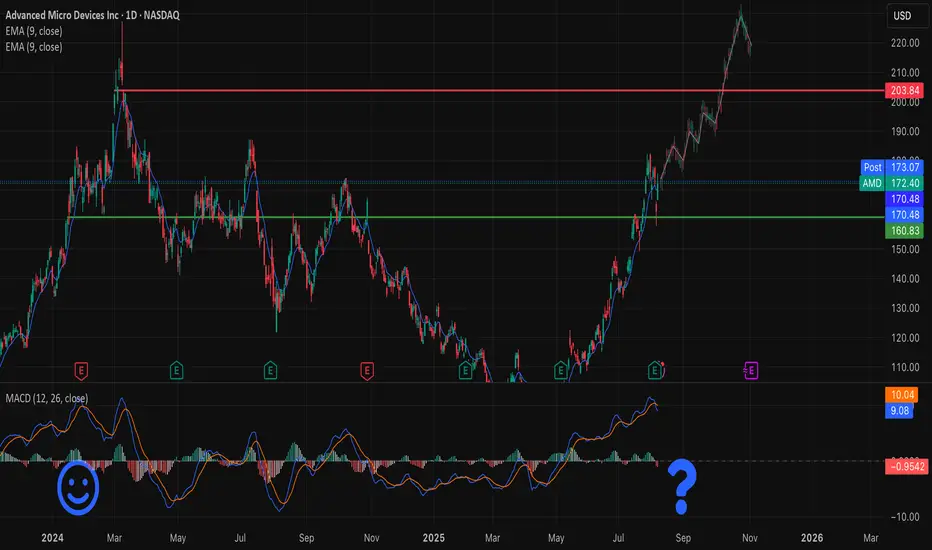
$AMD — Is history repeating itself?NASDAQ:AMD The chart is showing a pattern strikingly similar to previous highs — a strong rally after a long accumulation, followed by a pullback on news.
📰 Q2 2025 Earnings:
• Record revenue: $7.7B (+32% YoY)
• Strong sales in Ryzen CPUs and Radeon GPUs
• Q3 outlook: $8.7B revenue, ~54% margin
What’s holding it back:
• Export restrictions on MI308 to China hit margins and investor sentiment
• Short-term profit taking after a powerful rally
Reasons for optimism:
• Upcoming AI products MI350 and MI400 could be major growth drivers
• Expected demand from data centers and AI infrastructure
Technical view:
• EMA 9 remains above key support levels (170, 160)
• MACD is close to a potential bearish crossover — worth watching
• Past highs show that sharp corrections in AMD often set the stage for the next wave up
AMD: It's A Golden Buying OpportunityHello,
Advanced Micro Devices, Inc engages in the provision of semiconductor businesses. It operates through the following segments: Computing & Graphics, and Enterprise, Embedded and Semi-Custom. The Computing and Graphics segment includes desktop and notebook processors and chipsets, discrete and integrated graphics processing units, data centre and professional GPUs and development services. The Enterprise, Embedded and Semi-Custom segment includes server and embedded processors, semi-custom System-on-Chip products, development services and technology for game consoles.
TECHNICAL ANALYSIS- Checklist
Structure drawing (Trend line drawing on past price chart data)- As shown below
Patterns identification (Naming patterns on past price chart data for future wave)- As shown
Future indication (Reading indicator for future wave)- Awaiting 0 crossover on MACD
Future wave (Drawing on future price chart using future indication from indicator)- As shown below
Future reversal point (Identifying trend reversal point on price chart using structure)- Target as shown $244
AMD shares are currently trading near their 52-week lows after the top reached in March 2024. Just A day after inauguration the Trump administration announced the Stargate AI Infrastructure initiative in collaboration with OpenAI, SoftBank and Oracle. According to Aaron Rakers, a Semiconductor and IT Hardware analyst, the initiative aims to deploy an immediate $100 billion for AI data center construction, starting with an ongoing project in Abilene, Texas, with the potential to scale up to $500 billion over the next four years. While this development is expected to benefit AI infrastructure and semiconductor companies, OpenAI's press release specifically mentioned NVIDIA and ARM as key initial partners, omitting AMD. This raise concerns that AMD may have missed a crucial opportunity in the AI investment boom. While this might be seen as negative there is positive news coming in from the US government, Yesterday 11th February 2025 JD Vance said the administration of President Donald Trump "will ensure that the most powerful AI systems are built in the U.S. with American-designed and manufactured chips.” This gives hope for United States of America AI companies in the coming years.
Recently Deepseek caused ripples in the AI market as well. DeepSeek a Chinese AI startup is challenging the prevailing "bigger is better" mindset in AI model training by delivering high-performance results with fewer GPUs and lower costs. This suggests that innovation in model design and efficiency can rival brute-force training approaches. If hyperscalers begin reassessing the necessity of massive GPU clusters, it could impact long-term demand for training hardware. However, near-term spending on AI infrastructure remains strong, with companies like Meta, Microsoft, Amazon and Google continuing their multi-billion-dollar investments as per their recent Q4 earning updates. While DeepSeek has stirred significant discussion in the semiconductor space, it is yet to showcase any ground-breaking advancements beyond what OpenAI already offers. Having tested the product, we noticed that OpenAI has quickly updated its reasoning capabilities to match DeepSeek's edge over ChatGPT. One of the biggest limitations of generative AI platforms remains their outdated datasets, often capped at 2024. We expect this to disappear with time.
It's still too early to determine the full impact, but if DeepSeek’s approach gains widespread adoption, new AI market leaders could emerge, potentially shifting market dynamics. Moreover, DeepSeek's success disrupts the dominance of U.S. firms and highlights vulnerabilities in the effectiveness of export controls on high-end chips.
Despite missing out on the Stargate initiative, AMD has expanded its AI chip portfolio and achieved a significant milestone by securing a spot in Dell’s new commercial AI PC lineup. The commercial PC market, which accounts for 55% of total PC shipments, remains a crucial battleground for vendors. Dell, holding 15% of the total PC market and 23% of the commercial segment, is the third-largest commercial PC vendor, with over 85% of its unit sales tied to commercial customers.
Following AMD’s recent earnings report, the stock plunged 10% in premarket trading. While the company posted solid Q4 results, weaker-than-expected guidance on data center sales weighed on investor sentiment. Lastly, China represents a significant revenue source for AMD. However, the ongoing trade tensions between the U.S. and China pose a considerable risk to this income stream, adding another layer of uncertainty to AMD’s future outlook.
FINANCIAL HIGHLIGHTS FOR THE YEAR ENDED DECEMBER 28, 2024
Net Revenue: $25,785 million, reflecting a 14% increase from $22,680 million in 2023, driven by strong performance in the Data Center and Client segments.
Gross Profit: $12,725 million, with a gross margin of 49%, up from 46% in 2023, due to a favorable revenue mix shift towards higher-margin segments.
Operating Income: $1,900 million, a significant increase from $401 million in 2023, primarily due to higher revenue and improved gross margins.
Net Income: $1,641 million, compared to $854 million in 2023, driven by increased revenue and operating income.
Diluted EPS: $1.00, up from $0.53 in 2023, reflecting the company's improved profitability.
Revenue Segments: The Data Center segment saw a significant increase in net revenue, driven by higher sales of AMD Instinct GPUs and AMD EPYC CPUs. The Client segment also experienced growth due to increased unit shipments and higher average selling prices of AMD Ryzen processors. However, the Gaming and Embedded segments faced declines in net revenue due to lower semi-custom product revenue and normalized inventory levels, respectively.
New Product Launches: AMD launched several new products, including the 5th Gen AMD EPYC processors, AMD Ryzen AI 300 Series processors, and the Ryzen 9000 series processors. These products are designed to deliver leadership performance in gaming, productivity, and AI capabilities.
New Production Launches: The company expanded its adaptive computing portfolio with the launch of the Versal Series Gen 2 devices, including the Versal AI Edge Series Gen 2 and Versal Prime Series Gen 2 adaptive SoCs, which enhance AI-driven embedded systems.
Future Outlook: AMD plans to continue its focus on AI and enterprise markets, with expectations to complete the acquisition of ZT Systems in the first half of fiscal year 2025. The company also intends to seek a strategic partner for ZT Systems' manufacturing business.
Sales Units: The Client segment reported a 34% increase in unit shipments, reflecting strong demand for AMD mobile and desktop Ryzen processors.
Geographical Performance: International sales accounted for 66% of net revenue in 2024, indicating a strong global presence and continued significance of international markets in AMD's sales strategy.
CHALLENGES AND RISKS
Market and Competitive Risks: The company faces significant economic and strategic risks due to the dominance of Intel and Nvidia in their respective markets, which may limit AMD's ability to compete effectively. The semiconductor industry is highly cyclical, with severe downturns that have historically affected the company.
Operational Risks: The company relies on third-party manufacturers, which poses risks if these suppliers are unable to meet demand or if there are disruptions in the supply chain. Potential security vulnerabilities in products and IT outages or cyberattacks could also disrupt operations.
Legal and Regulatory Risks: Government actions that may limit product exports and evolving expectations regarding corporate responsibility could result in additional costs and reputational harm.
Management Strategies: Management is focusing on timely product introductions and maintaining product quality to provide value to customers. The company is also investing in AI capabilities to meet the growing demand for AI solutions, although the trajectory of AI adoption remains uncertain.
Market Risks: The company is exposed to unfavorable currency exchange rate fluctuations, which could adversely affect profitability and cash flows. Additionally, potential changes in tax regulations and the realization of deferred tax assets could affect financial results.
STRATEGIC INITIATIVES IN 2024
Strategic Initiatives: In 2024, AMD focused on expanding its AI capabilities and data center infrastructure. The company launched multiple leadership products, including the 5th Gen AMD EPYC processors and AMD Ryzen AI 300 Series processors, to enhance its high-performance computing portfolio. AMD also acquired Silo AI Oy to bolster its AI software capabilities and entered into an agreement to acquire ZT Systems to enhance its AI and compute infrastructure offerings.
Capital Management: AMD repaid its 2.95% Senior Notes due 2024, reducing its total debt from $2.5 billion to $1.8 billion. The company returned $862 million to shareholders through the repurchase of 5.9 million shares of common stock. As of December 28, 2024, $4.7 billion remained available for future stock repurchases. AMD maintained a revolving credit facility of $3 billion and a commercial paper program, both of which were undrawn during the year.
Future Outlook: AMD plans to close the acquisition of ZT Systems in the first half of fiscal year 2025, subject to regulatory approvals. The company intends to seek a strategic partner to acquire ZT Systems' manufacturing business. AMD expects to continue leveraging its cash, cash equivalents, and credit facilities to fund operations and strategic initiatives, including potential acquisitions and capital expenditures, over the next 12 months and beyond.
Our recommendation
When it comes to AI beneficiaries and hardware for AI applications, AMD has failed to get the highlight it deserves. This has greatly led to a lot of investors looking at Nvidia vs AMD. However, over the last few weeks, Deepseek caused ripples in the AI market due to its ability to make programs with less powered chips. DeepSeek's V3 a Chinese AI startup is challenging the prevailing "bigger is better" mindset in AI model training by delivering high-performance results with fewer GPUs and lower costs. This suggests that innovation in model design and efficiency can rival brute-force training approaches. As a result of this, we expect more focus to move to alternative companies that are involved in AI infrastructure. AMD remains well positioned to compete with its competitors all round. In November 2024, AMD showcased its ongoing high-performance computing (HPC) leadership at Supercomputing 2024 by powering the world’s fastest supercomputer.
In March 2024, AMD stock reached the all-time high at $227.30. The stock has since retraced by 53.8% to its current price of $110.48. This correction, coupled with the strong fundamentals the company has signals that AMD remains a solid hold in the long term and a great buy from the current levels. AMD continues to focus on expanding its AI capabilities and data centre infrastructure. On 11th February 2024, AMD announced the signing of a Letter of Intent (LOI) with the Commissariat à l'énergie atomique et aux énergies alternatives (CEA) of France to collaborate on the advanced technologies, component and system architectures that will shape the future of AI computing. This effort underscores the AMD commitment to fostering international collaborations that accelerate AI innovation, making AI more inclusive and sustainable, and strengthening cooperation, in particular, between the United States and European research institutions. It also opens up for opportunity for more income from the Europe market. For the full year 2024, AMD reported record revenue of $25.8 billion, gross margin of 49%, operating income of $1.9 billion, net income of $1.6 billion, and diluted earnings per share of $1.00. On a non-GAAP (*) basis, gross margin was a record 53%, operating income was $6.1 billion, net income was $5.4 billion and diluted earnings per share was $3.31.
A key risk for AMD is the trade war between the united states and China. China represents a significant revenue source for AMD and the ongoing trade tensions between the U.S. and China pose a considerable risk to this income stream, adding another layer of uncertainty to AMD’s future outlook.
Our view on Advanced Micro Devices is BUY/HOLD with a target of $244. This is a 120.48% return on the stock from the current price of 110.48.
Sources:
www.tradingview.com
www.tradingview.com
www.tradingview.com

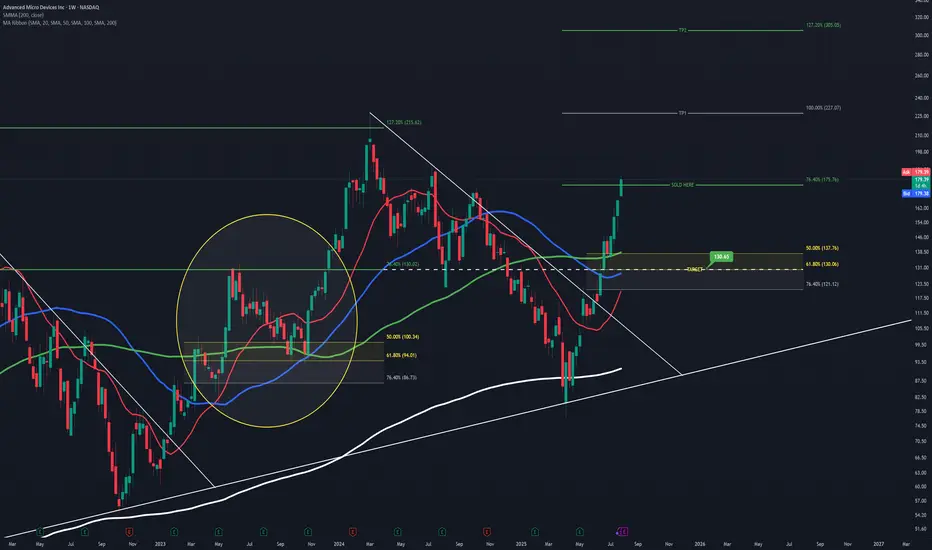
AMD Projection and Entry PointThis is speculation just like before, which played out very well so this is me having another shot at it.
Going off of the prior cycle AMD went through and comparing it to the one it's currently in, you can see a lot of similarities.
Learning from it's past and seeing how it likes to react to certain Fib levels, you can see that the 76.40% has been respected as a major level of resistance which resulted in its short retracement back in June '23 , It also acts as a very strong level of support as shown in August '24.
Assuming AMD rejects at the current 76.40% level again, using the prior 76.40% you can see it aligns perfectly with the golden ratio I have setup as my buy entry.
It all lines up too perfectly that in my mind, I'm certain it will play out. But of course it's all speculation, and the markets do as they please.
Advanced Micro Devices | AMD | Long at $126.00Advanced Micro Devices NASDAQ:AMD may be the sleeping giant in the semiconductor / AI space. While all eyes on NVidia NASDAQ:NVDA , earnings for NASDAQ:AMD grew by 800% over the past year... and are now forecast to grow 40% per year. Any other company would be soaring right now (like NVidia), but that company is getting all the attention. And, to me, this means opportunity for the future. The cashflow is likely to grow tremendously for
NASDAQ:AMD into 2027 and beyond, which may inevitably reward investors with dividends.
From a technical analysis perspective, NASDAQ:AMD just entered my historical simple moving average zone. This area (currently $108-$126) is where I will be gathering shares. Something tremendous would have to change regarding the fundamentals of this company (like a scandal) for the overall thesis to change. There may be some near-term price pains as NVidia gets all the focus, but to meet demand in the semiconductor and AI space, NASDAQ:AMD is poised to fulfill that roll in the future.
Target #1 = $158.00
Target #2 = $175.00
Target #3 = $188.00
Target #4 = $205.00

AMD: conviction buyAlot of things look good here on the weekly: IHS (zoom in on the daily and you can see it better) resolving to the upside over the past month or so, break above the bull flag and a close above the volume shelf. I see this moving to the 180s pretty quickly. Has lagged the market.
