1 HR AMZN Target Area (Green Box)
To the upper right is a green rectangle labeled “TARGET”.
The dotted diagonal green line projects price from the bottom low up into this box.
This represents the bullish target if the reversal continues.
Failed Target Marker
Below the price, far down, there is a dotted yellow label “TARGET FAILED”.
This marks the lower threshold—if price drops there, the bullish pattern is invalid.
Trade ideas

Amazon(NASDAQ: $AMZN) Invests $3B in New Mississippi AI Data HubAmazon.com (NASDAQ: NASDAQ:AMZN ) announced plans to invest at least $3 billion in a new data-center campus located in Warren County, Mississippi. The project will support Amazon Web Services’ expanding AI and cloud-infrastructure needs, reinforcing AWS’s position as the company’s fastest-growing and most profitable segment.
The data-center development is expected to create more than 200 direct jobs at the site and support over 300 additional roles in the surrounding region. Amazon highlighted that the expansion will power next-generation AI workloads, machine-learning services, and global cloud capacity. The investment also deepens Amazon’s long-term footprint in the southeastern U.S., aligning with rising demand for high-compute environments across industries.
This move follows a broader trend of hyperscale cloud providers accelerating infrastructure spending to compete for AI-focused enterprise customers. With AWS already serving as the global leader in cloud services, the investment signals Amazon’s intention to maintain a technological and commercial edge amid intensifying competition from Microsoft Azure and Google Cloud.
Technical analysis:
Price is pulling back from heavy resistance at $258 and correcting toward the ascending trendline support. This level acts as a significant weekly demand area and aligns with the broader structure guiding the uptrend.
A strong bullish reaction from the trendline would likely set up another retest of the $258 highs. A clean break above that zone opens the door toward $280–$300, supported by long-term Fibonacci projections and sustained strength in AWS earnings.
If the trendline level breaks, the next key support sits at the horizontal support that has carried Amazon’s stock since early 2021. Overall, the setup remains bullish as long as price holds above the trendline.
Amazon (AMZN) Shares PlungeAmazon (AMZN) Shares Plunge
As the chart shows, Amazon (AMZN) shares fell to around $222 yesterday, despite trading above $255 at the start of the month.
The price drop is the result of several factors, including:
→ A rating downgrade from Rothschild & Co. Redburn (to “Neutral”). Analysts doubt that Amazon’s massive investments in artificial intelligence will pay off as quickly as its earlier spending on cloud technologies once did.
→ Pressure from the Federal Trade Commission (FTC). A court hearing on accusations that Amazon engaged in anti-competitive practices and overcharged US households (by more than $1bn) has been officially scheduled for February 2027.
Technical Analysis of Amazon (AMZN)
Reviewing the chart from 3 November (when the price climbed above $250 following a strong earnings report), we:
→ used the fluctuations in AMZN’s share price to outline an ascending channel (shown in blue);
→ suggested that the initial reaction to the report might have been overly optimistic and pointed to a potential corrective move.
However, the subsequent decline of more than 13% from the November peak appears too deep to be considered a mere correction – the price is now below where it stood before the report was released. It is reasonable to assume that the surge in AMZN above the psychological $250 level on strong news was used to lock in profits from large long positions, and that market sentiment has since shifted dramatically.
Nevertheless, in the short term, AMZN traders may look for a rebound from the lower boundary of the channel. In the longer run, a bearish breakout from the current channel should not be ruled out – especially if news flow around AI takes a gloomier turn. Today, all eyes are on Nvidia’s (NVDA) earnings report.
This article represents the opinion of the Companies operating under the FXOpen brand only. It is not to be construed as an offer, solicitation, or recommendation with respect to products and services provided by the Companies operating under the FXOpen brand, nor is it to be considered financial advice.

AMZN at a Critical Turning PointThe chart shows a large Cup & Handle formation, with the neckline marked by the black horizontal resistance. Recently, AMZN broke above this neckline but failed to hold, pulling back to retest the breakout zone.
Right now, price is sitting exactly on a major decision area where:
• The neckline
• The rising purple trendline
• And the 50-day moving average
all converge.
This zone will determine whether AMZN resumes its uptrend or confirms a failed breakout.
Bullish Scenario
If AMZN holds above the $220–$225 support and forms a bullish reversal candle, the uptrend can continue.
Upside Targets
1. $240 – Near-term resistance
2. $255 – Classic Cup & Handle target
3. $265–$270 – Full measured move of the pattern
Stop Loss (for bullish setup)
Below $216
(break of the rising trendline + failure of the pattern)
Bearish Scenario
If price closes below $216, it confirms:
• A failed breakout
• A break of the rising trendline
• Start of a deeper correction
Downside Targets
1. $205 – First support
2. $190 – Strong support zone
3. $173–$175 – Major long-term support
Stop Loss (for bearish setup)
Above $230
Summary
AMZN is at a major inflection point.
Holding above the trendline could trigger a strong continuation rally, but losing this level opens the door to a deeper correction.
This is one of the most important zones to watch for Amazon in the coming weeks.

Amazon Raises $15B for AI Expansion — Stock at Key Support ZoneAmazon has launched its first US dollar bond sale since 2022, securing $15 billion to accelerate investments in AI infrastructure. Demand was massive, reaching $80 billion, signaling strong investor confidence in Amazon’s long-term growth story. The funds will support capital expenditures, acquisitions, data-center expansion, and upcoming debt maturities.
This move aligns with a broader trend among tech giants aggressively raising capital to scale AI systems. Meta issued $30 billion earlier, Alphabet raised $25 billion, and Oracle sold $18 billion in September. The surge in funding reflects the rising cost of advanced chips, cloud infrastructure, and high-capacity data centers needed to stay competitive in the AI race.
Amazon, the world’s largest cloud provider through AWS, is increasingly focused on high-performance computing and generative AI models. The new capital gives Amazon more room to expand capacity, boost margins through automation, and strengthen its competitive edge in enterprise AI services.
Amazon’s stock (AMZN) is pulling back from the $258 resistance, forming a corrective move toward a key support area around $232. This level aligns with the structure seen on the weekly chart and acts as a short-term demand zone. A strong bullish reaction here would likely set the stage for a retest of the $258 high, followed by a potential breakout if momentum returns.
If $232 fails to hold, the next major support sits at the ascending trendline zone, which has guided Amazon’s uptrend since early 2023. A deeper correction remains possible, but the broader structure is still bullish as long as price holds above the trendline.
The RSI is cooling off, suggesting the correction is healthy rather than a trend reversal. If Amazon bounces from support, the next major upside target sits between $280 and $300, aligning with long-term Fibonacci extensions.

Stock market will test yearly levels below current supportAs the yearly candle closes and the new one opens, there is an orderflow pattern that is well developed. This will play out again as always 💎

Amzn weekly chartI think we are heading into a tough correction based on my personal view.
Look at this divergence on the RSI indicator on the weekly timeframe.
I believe I’m done with this stock.
Good luck 4all🌷

Short??Being the long term trend is up I wouldn’t short this. I’m being patient for a big correction that will widen this channel for the last wave of the long term trend. $96 area is what I’m looking for. Stay patient and don’t fall for the short term momentum swings.

Sanctions and Their Role in the Global Market1. Understanding Sanctions
Sanctions are restrictions placed by one country or a group of countries on another nation or entity to enforce international laws or influence political or economic decisions. They are often used as alternatives to military intervention, serving as diplomatic or economic pressure tools. Sanctions can be applied for various reasons — to punish aggression, prevent nuclear proliferation, counter terrorism, or respond to human rights violations.
The key players in imposing sanctions are major economic and political blocs such as the United Nations (UN), the European Union (EU), and powerful individual nations like the United States. The U.S., for instance, uses the Office of Foreign Assets Control (OFAC) to design and enforce sanctions globally.
2. Types of Sanctions
Sanctions come in several forms, each targeting different aspects of an economy or government operation. The most common types include:
Economic Sanctions:
These restrict trade and financial transactions. Examples include import and export bans, restrictions on investments, or freezing of assets. Economic sanctions are intended to weaken a nation’s economic stability.
Trade Sanctions:
Trade restrictions can prevent the export of critical goods like oil, technology, or weapons. For instance, sanctions on Iran’s oil exports have significantly limited its main source of revenue.
Financial Sanctions:
These target banking systems, financial institutions, and access to international payment systems like SWIFT. Russia, for example, faced severe financial isolation after its 2022 invasion of Ukraine.
Travel and Visa Sanctions:
These restrict the movement of political leaders, business executives, or individuals associated with illicit activities.
Military Sanctions:
These include arms embargoes that prevent the sale or supply of weapons and military technology.
Sectoral Sanctions:
These are targeted at specific sectors, such as defense, energy, or finance, to maximize economic pressure while minimizing collateral damage.
3. Objectives of Sanctions
The main goal of sanctions is to influence the behavior of governments or organizations without direct conflict. Their objectives include:
Deterring Aggression:
Sanctions can discourage military invasions or aggressive policies by raising the economic costs of conflict.
Promoting Human Rights:
Countries imposing sanctions often aim to pressure regimes accused of human rights abuses to change their policies or release political prisoners.
Preventing Nuclear Proliferation:
Sanctions against nations like North Korea and Iran are designed to stop the development of nuclear weapons programs.
Countering Terrorism:
Sanctions can block financial channels and assets used by terrorist groups.
Maintaining Global Stability:
Sanctions can be part of a coordinated global response to maintain international peace and uphold the rules-based order.
4. Mechanisms and Enforcement
Sanctions are typically implemented through laws, executive orders, or international agreements. Enforcement mechanisms include:
Asset Freezes: Preventing access to money or property held in foreign accounts.
Export Controls: Blocking the sale of critical goods, technology, or services.
Financial Restrictions: Limiting a country's access to international capital markets or payment systems.
Secondary Sanctions: Penalizing third-party countries or companies that do business with the sanctioned nation.
Monitoring compliance is crucial. Organizations such as the Financial Action Task Force (FATF) help track illegal financial activities and ensure that sanctions are effectively enforced.
5. Impact on the Global Market
The effects of sanctions ripple through the global economy, influencing trade balances, currency values, and market confidence. The impact varies based on the size and integration of the targeted country into the global market.
a. Trade and Supply Chains
Sanctions often disrupt global supply chains. For instance, sanctions on Russia and Iran have affected oil and gas supplies, driving up energy prices worldwide. Similarly, export restrictions on high-tech goods to China have reshaped global semiconductor and electronics markets.
b. Energy Markets
Energy is one of the most affected sectors. Russia’s sanctions after the Ukraine conflict caused global oil and gas price surges, forcing Europe to seek alternative energy suppliers. The Organization of the Petroleum Exporting Countries (OPEC) also faces indirect pressure when sanctions alter global energy supply and demand dynamics.
c. Financial Markets
Financial sanctions can restrict global capital flow. When large economies face sanctions, investors often move funds to safer markets, affecting currency exchange rates and global liquidity. For example, the freezing of Russian foreign reserves shook confidence in the global financial system and led to a rethinking of foreign reserve management by other nations.
d. Currency and Inflation
Countries under sanctions often experience currency depreciation due to restricted foreign investment and reduced exports. This leads to inflation and reduced purchasing power. Conversely, global markets can see inflation spikes when critical exports like oil or metals are restricted.
e. Global Business and Investment
Multinational corporations often have to withdraw from sanctioned regions to avoid penalties. For example, Western companies left Russia in 2022, leading to billions in losses. At the same time, other countries—like China, India, and Turkey—sometimes step in to fill trade gaps, reshaping global business networks.
6. Winners and Losers of Sanctions
Sanctions do not impact all players equally.
Losers:
The sanctioned nation’s economy typically suffers severe downturns—loss of exports, unemployment, and financial isolation. Ordinary citizens bear the brunt of inflation and shortages.
Winners:
Competing countries may benefit by capturing markets vacated by the sanctioned nation. For example, when Western countries stopped buying Iranian oil, Asian importers received discounted rates.
Some nations, particularly those with large domestic markets or resource independence, can mitigate sanctions' effects. Russia and Iran, for example, have developed parallel financial systems and strengthened ties with non-Western economies.
7. Geopolitical and Strategic Consequences
Sanctions also alter geopolitical alliances. Countries facing sanctions often form new partnerships to bypass restrictions. The growing trade between Russia, China, and Iran illustrates the emergence of an alternative economic bloc.
Furthermore, sanctions can accelerate de-dollarization—efforts by countries to reduce reliance on the U.S. dollar in international trade. This trend threatens to reshape the structure of global finance in the long term.
8. Criticisms and Limitations
While sanctions aim to promote peace and justice, they often have unintended consequences. Critics argue that:
Humanitarian Impact: Sanctions can lead to shortages of food, medicine, and essentials, harming civilians more than political elites.
Limited Effectiveness: Some regimes adapt through smuggling, black markets, or new alliances, reducing the intended pressure.
Global Economic Distortion: Sanctions can destabilize global markets, raising costs for consumers worldwide.
Political Misuse: At times, sanctions are used to advance national interests rather than collective global welfare.
9. The Future of Sanctions in a Multipolar World
As global power becomes more multipolar, sanctions may evolve from unilateral tools into complex, multilateral strategies. The rise of alternative payment systems, digital currencies, and regional alliances is challenging traditional sanction mechanisms.
Future sanctions are likely to become more targeted, using data analytics and AI to precisely identify and restrict individuals or companies, minimizing collateral damage. Digital finance, blockchain monitoring, and trade transparency will shape how sanctions are enforced.
10. Conclusion
Sanctions are a central instrument of global diplomacy and economic policy. They influence trade routes, investment flows, and geopolitical alignments across the world. While they serve as a non-violent means to uphold international norms, their ripple effects on the global market can be profound—affecting everything from oil prices to inflation and financial stability.
The challenge for the international community is to design sanctions that are strategic, humane, and effective, achieving political goals without destabilizing the world economy. In an era of interconnected markets, the role of sanctions will continue to grow—reflecting not only power politics but also the evolving architecture of the global financial and trade system.
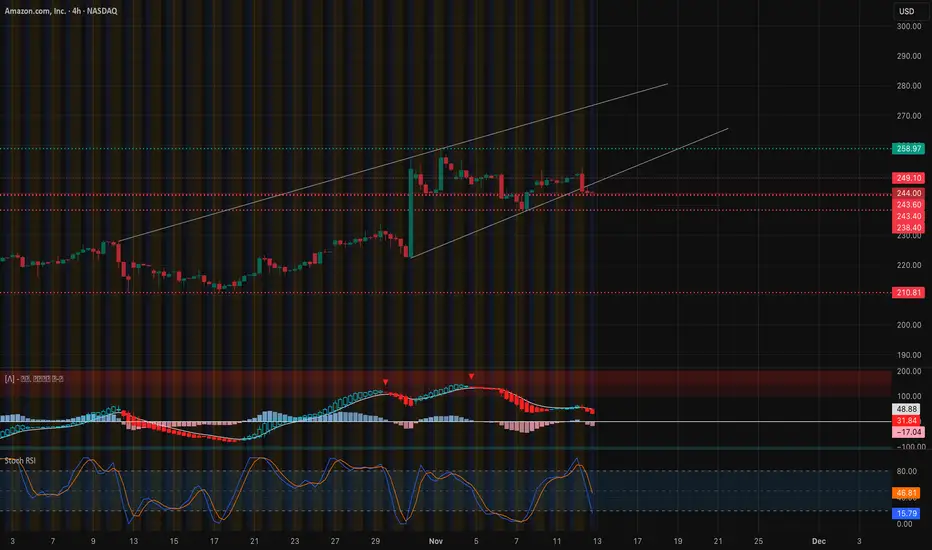
AMZN Hidden Breakout Setup. TA for Nov. 12–15AMZN Hidden Breakout Setup — Gamma Pressure Building Fast
AMZN has spent the past week moving with a strange mix of strength and hesitation — grinding upward but constantly pausing at the same levels. To most traders, it looks like standard consolidation.
But when you overlay the GEX landscape, suddenly the entire picture becomes obvious:
AMZN is sitting right between two major gamma fields — and whichever one it triggers next will unlock a strong directional move.
This is the story the candles can’t tell on their own.
4H Chart — A Rising Channel With Silent Liquidity Defense
AMZN is climbing inside a clean rising channel, respecting every structural point along the way:
* Multiple BOS and CHoCH confirmations
* A tight ascending support line
* Higher lows stacking cleanly
* A strong reaction zone at 244–247
Each time AMZN dips into the rising trendline, the bounce is sharp and controlled — exactly what you expect when buyers are defending a liquidity shelf that sits on top of a positive GEX foundation.
The price action is almost too clean.
This usually means one thing: institutional interest.
1H Chart — Compression Before Resolution
On the 1H timeframe, AMZN is doing something classic:
* Sharp dips get immediately absorbed
* Bounces stall at the same ceiling
* Volume spikes occur at predictable zones
* The range tightens every hour
This isn’t distribution.
This isn’t weakness.
It’s pre-breakout compression, the kind that forms when price is sitting inside a gamma-neutral zone waiting for a catalyst.
Once AMZN escapes this pocket, volatility will return — hard.
GEX Data — The Real Map Behind AMZN’s Behavior
This is where the full picture comes together.
🔹 Massive Call/GEX walls at 250–255
These act like magnetic ceilings.
As AMZN approaches 250+, hedging flows tighten and price stabilizes before making the next attempt.
This is why AMZN repeatedly stalls around 247–250.
🔹 Neutral GEX zone between 242–248
This is the range AMZN is stuck in now.
Neutral pockets = volatility compression
→ controlled candles
→ low momentum
→ accumulation-like behavior
It feels slow, but it’s actually energy building.
🔹 Heavy negative GEX zone at 235–240
This is the danger zone.
If AMZN breaks below 240, hedging pressure flips bearish and price accelerates downward.
Right now, AMZN is hugging the upper half of the neutral pocket — a bullish tilt.
🔥 Trading Suggestions Based on Structure + GEX
📌 Bullish Breakout Play (Higher Probability)
Valid if AMZN reclaims 247–248 with strength.
ENTRY:
246.50–248 breakout (1H confirmation)
TARGETS:
* 250.00 (first GEX magnet)
* 252.50 (second CALL/GEX wall)
* 255.00 (highest positive NET GEX shelf)
STOP-LOSS:
Below 242.50
WHY IT WORKS:
Once above 248, AMZN enters a staircase of positive GEX zones → upside continues in a controlled drift.
📌 Bearish Breakdown Play (Only if 240 Fails)
Valid if price breaks 240 and rejects the retest.
ENTRY:
Break & reject under 239.80
TARGETS:
* 237.50 (first negative GEX shelf)
* 235.00 (major put support)
* 230.00–232.00 (liquidity pocket)
STOP-LOSS:
Above 243
WHY IT WORKS:
Below 240, AMZN falls into a negative GEX environment → hedging accelerates downward moves.
🔥 Options Trading Suggestions (Based on GEX)
📌 Bullish Options Play
If AMZN reclaims 248+:
Buy:
250C or 255C (1–2 weeks out)
Reason:
These contracts sit right in the positive GEX zone where price tends to drift upward.
Safer Spread:
245/255 Call Debit Spread
GEX supports the entire move.
📌 Bearish Options Play
If AMZN breaks 240:
Buy:
240P or 235P
Reason:
Once AMZN drops into negative gamma, puts expand QUICKLY.
Safer Spread:
240/230 Put Debit Spread
Ideal for controlled downside.
📌 Neutral Options Play
If AMZN stays in 242–248:
Sell Premium:
* Iron Condor
* Short Strangle
* Credit Spread
* Calendar
Neutral GEX = volatility compression → ideal for sellers.
My Thought
AMZN is sitting in one of the cleanest gamma-based setups we’ve seen in November. Price is coiling inside a narrow GEX pocket, volatility is suppressed, and the rising channel suggests quiet accumulation.
The roadmap is simple:
* Above 248 → AMZN targets 250–255
* Below 240 → AMZN slides into negative GEX
* Inside 242–248 → quiet chop and time decay
A major move is loading — and GEX already reveals the path.
This outlook is for educational purposes only and not financial advice. Always manage your risk and trade your plan.
AMZN : Bulls Taking a Pause Before the Next Leg Up!Amazon’s recent surge has hit a temporary Pause, forming a healthy pullback phase. If structure remains intact, another bullish wave could follow soon. Key levels to watch: 238–240 for a potential continuation setup.
Disclosure: We are part of Trade Nation's Influencer program and receive a monthly fee for using their TradingView charts in our analysis.

Derivatives Trading in Emerging Markets1. Understanding Derivatives
A derivative is a financial instrument whose value is derived from the price of an underlying asset. The underlying can be stocks, bonds, commodities, interest rates, exchange rates, or market indices. The most common types of derivatives include forwards, futures, options, and swaps.
Forwards are customized contracts traded over the counter (OTC), where two parties agree to buy or sell an asset at a future date at a predetermined price.
Futures are standardized contracts traded on exchanges, reducing counterparty risk through clearing houses.
Options give the holder the right, but not the obligation, to buy or sell an asset at a specified price within a certain period.
Swaps involve the exchange of cash flows or financial instruments between two parties, often to manage exposure to interest rates or currencies.
Derivatives are used for hedging, speculation, and arbitrage, making them vital tools for both risk management and profit generation.
2. Growth of Derivatives in Emerging Markets
Emerging markets such as India, China, Brazil, South Africa, and Indonesia have witnessed rapid growth in derivatives trading over the past two decades. Initially, their financial systems were dominated by cash or spot markets. However, the volatility in exchange rates, commodity prices, and interest rates created demand for instruments that could mitigate these risks.
India’s derivatives market, for example, began in 2000 with index futures on the NSE (National Stock Exchange). Today, it is one of the largest derivatives markets globally in terms of contract volumes.
China launched commodity futures exchanges in the 1990s and gradually introduced financial derivatives, although its government maintains strict control to prevent speculation-driven instability.
Brazil’s BM&FBOVESPA (now B3) is another major hub, offering derivatives on interest rates, currencies, and commodities.
This expansion reflects both the globalization of finance and the increasing sophistication of local investors and institutions.
3. Role and Importance in Emerging Markets
a. Risk Management
Derivatives are crucial for hedging against uncertainties in currency rates, interest rates, and commodity prices. For instance, exporters in India use currency futures to protect themselves from exchange rate fluctuations, while farmers in Brazil hedge their crop prices through commodity futures.
By allowing investors and companies to transfer risk to those willing to bear it, derivatives enhance financial stability.
b. Price Discovery
Futures and options markets help in determining the expected future price of an asset based on market sentiment. For example, futures prices of crude oil or gold on Indian exchanges provide valuable information to producers, traders, and policymakers about expected market conditions.
c. Market Liquidity and Efficiency
Derivatives attract speculators who add liquidity to the market. This increased participation tightens bid-ask spreads and improves overall price efficiency. Furthermore, arbitrage between spot and derivatives markets ensures prices remain aligned, reducing distortions.
d. Financial Deepening
A vibrant derivatives market signals financial maturity. It encourages institutional participation, supports innovation, and contributes to the development of related sectors such as clearing and settlement systems, credit rating agencies, and risk management firms.
4. Challenges Faced by Emerging Markets
While the benefits are clear, emerging markets face several structural and operational challenges in developing robust derivatives markets.
a. Regulatory and Legal Framework
In many countries, the regulatory environment is still evolving. Over-regulation can stifle innovation, while weak supervision can lead to excessive speculation and financial crises. For instance, in some Asian markets, derivatives trading was temporarily banned after being linked to market volatility.
Emerging markets need transparent, consistent, and globally aligned regulations to build investor confidence and attract international participation.
b. Limited Market Depth and Participation
Retail participation in derivatives is often low due to limited awareness and the perception of high risk. Institutional investors, such as pension funds and insurance companies, may face restrictions on using derivatives. As a result, markets may be dominated by a few large players, reducing competition and liquidity.
c. Counterparty and Credit Risk
In OTC derivatives markets, the risk that one party may default on its obligation remains significant. The lack of centralized clearing mechanisms in some markets exacerbates this problem. Developing central counterparty (CCP) systems and improving risk management practices are vital.
d. Infrastructure and Technology
Efficient trading, clearing, and settlement require advanced infrastructure. Some emerging markets still face technological constraints, slow transaction processing, or inadequate risk monitoring systems, limiting the scalability of derivatives trading.
e. Market Manipulation and Speculation
Because derivatives offer high leverage, they can be used for speculative purposes, sometimes leading to market manipulation or bubbles. Regulatory oversight and investor education are essential to prevent misuse.
f. Low Financial Literacy
Many investors in emerging markets lack a full understanding of derivatives. Without proper knowledge, they may engage in speculative trading or misuse derivatives, leading to losses and erosion of trust in the system.
5. Case Studies
India
India’s derivatives market is among the most developed in the emerging world. The NSE and BSE offer a wide range of products, including equity futures and options, currency derivatives, and commodity contracts. The Securities and Exchange Board of India (SEBI) plays a crucial role in regulating the market, ensuring transparency and risk management. India’s introduction of interest rate futures and index options has enhanced hedging opportunities for institutional and retail investors alike.
China
China’s derivatives market has grown rapidly but remains tightly controlled by regulators to avoid excessive speculation. The Shanghai Futures Exchange and Dalian Commodity Exchange are major platforms. China’s government uses derivatives strategically to stabilize commodity and currency markets, reflecting a cautious but steady approach to liberalization.
Brazil
Brazil’s derivatives market, integrated through B3 Exchange, is known for innovation in interest rate and currency products. It supports both domestic and international investors and serves as a model of how derivatives can aid monetary policy and risk management in volatile economies.
6. Future Prospects
The future of derivatives trading in emerging markets is promising, driven by technological innovation, financial integration, and policy reforms.
Digital transformation and algorithmic trading will enhance liquidity and efficiency.
Blockchain and smart contracts could make derivatives trading more transparent and secure.
Cross-border trading and integration with global exchanges will deepen market access.
ESG-linked derivatives may emerge, allowing investors to hedge environmental and sustainability risks.
However, to realize this potential, emerging markets must invest in education, infrastructure, and governance. Collaboration with global institutions such as the International Monetary Fund (IMF) and the World Bank can also provide technical assistance and policy guidance.
7. Conclusion
Derivatives trading has evolved from a sophisticated financial tool to a vital pillar of modern emerging economies. It helps manage risks, enhances liquidity, and strengthens the resilience of financial systems. However, the path to maturity is complex—emerging markets must balance innovation with regulation, speculation with stability, and access with responsibility.
As these economies continue to integrate into the global financial system, the expansion of derivatives markets will play a key role in supporting sustainable growth, attracting foreign investment, and providing the foundation for a more resilient global economy. With prudent regulation, improved market infrastructure, and growing investor sophistication, the future of derivatives trading in emerging markets is both dynamic and promising.
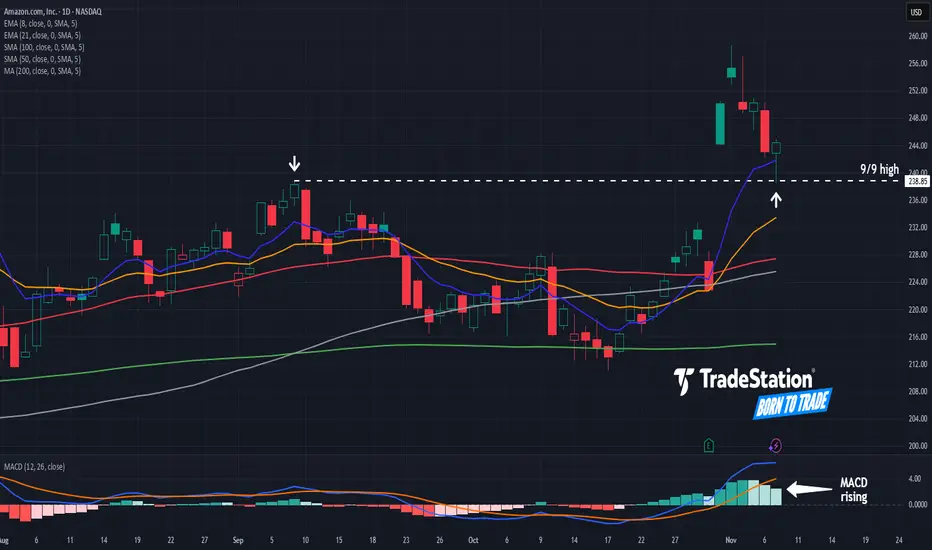
Amazon.com Pulls Back After Earnings BreakoutMomentum from strong earnings propelled Amazon.com to new highs last week, and now it’s pulled back.
The first pattern on today’s chart is the September 9 high of $238.85. The e-commerce and cloud-computing giant tested and held that level last Friday. Has old resistance become new support?
Second, the 8-day exponential moving average (EMA) recently crossed above the 21-day EMA. MACD is also rising. Those signals may reflect short-term bullishness.
Next, AMZN touched its 200-day simple moving average (SMA) less than a month ago. The 50-day SMA and 100-day SMA are also relatively close. Notice how the faster SMAs are above the slower SMAs. That may suggest its long-term trend is getting bullish again.
Last, AMZN is an active underlier in the options market. (Its average daily volume of 977,000 contracts ranked fourth in the S&P 500 last month, according to TradeStation data.) That could help traders take positions with calls and puts.
TradeStation has, for decades, advanced the trading industry, providing access to stocks, options and futures. If you're born to trade, we could be for you. See our Overview for more.
Past performance, whether actual or indicated by historical tests of strategies, is no guarantee of future performance or success. There is a possibility that you may sustain a loss equal to or greater than your entire investment regardless of which asset class you trade (equities, options or futures); therefore, you should not invest or risk money that you cannot afford to lose. Online trading is not suitable for all investors. View the document titled Characteristics and Risks of Standardized Options at www.TradeStation.com . Before trading any asset class, customers must read the relevant risk disclosure statements on www.TradeStation.com . System access and trade placement and execution may be delayed or fail due to market volatility and volume, quote delays, system and software errors, Internet traffic, outages and other factors.
Securities and futures trading is offered to self-directed customers by TradeStation Securities, Inc., a broker-dealer registered with the Securities and Exchange Commission and a futures commission merchant licensed with the Commodity Futures Trading Commission). TradeStation Securities is a member of the Financial Industry Regulatory Authority, the National Futures Association, and a number of exchanges.
Options trading is not suitable for all investors. Your TradeStation Securities’ account application to trade options will be considered and approved or disapproved based on all relevant factors, including your trading experience. See www.TradeStation.com . Visit www.TradeStation.com for full details on the costs and fees associated with options.
Margin trading involves risks, and it is important that you fully understand those risks before trading on margin. The Margin Disclosure Statement outlines many of those risks, including that you can lose more funds than you deposit in your margin account; your brokerage firm can force the sale of securities in your account; your brokerage firm can sell your securities without contacting you; and you are not entitled to an extension of time on a margin call. Review the Margin Disclosure Statement at www.TradeStation.com .
TradeStation Securities, Inc. and TradeStation Technologies, Inc. are each wholly owned subsidiaries of TradeStation Group, Inc., both operating, and providing products and services, under the TradeStation brand and trademark. When applying for, or purchasing, accounts, subscriptions, products and services, it is important that you know which company you will be dealing with. Visit www.TradeStation.com for further important information explaining what this means.
Amazon’s Golden Cup — Ready to Soar or Fall Back?A clear Cup and Handle pattern has formed, signaling a potential bullish continuation. The stock recently broke above key resistance around $244 and is now pulling back to retest that breakout level.
Short-Term View (1–3 weeks):
• If price holds above $244 and shows strength, upside momentum is likely to resume.
• Short-term target: $265–$270
• Stop-loss: below $230
Long-Term View (2–6 months):
• A confirmed breakout of this pattern could lead to a strong upward move.
• Long-term target: $290–$310
• If price loses the $227–$230 support zone, the bullish setup weakens, and a drop toward $200 could follow.
Summary:
AMZN is at a key retest zone after breaking a long-term resistance. Holding above $244 would likely confirm the bullish trend, while failure to sustain that level might trigger a deeper correction.

Emerging Markets vs. Developed Markets1. Definition and Core Characteristics
Developed markets, also known as advanced economies, are countries with high per capita income, diverse industrial bases, mature financial systems, and stable governance. Examples include the United States, Japan, Germany, the United Kingdom, Canada, and Australia. These nations typically exhibit consistent GDP growth, low unemployment, high standards of living, and robust infrastructure.
Emerging markets, on the other hand, refer to nations transitioning from developing to developed status. They possess fast-growing economies, rising income levels, improving infrastructure, and expanding industrial sectors. Examples include India, China, Brazil, South Africa, Indonesia, and Mexico. Although they experience higher growth potential, they also face greater economic and political risks compared to developed economies.
2. Economic Growth and Development Patterns
A defining difference between emerging and developed markets lies in their growth trajectories.
Developed Markets:
Growth in these economies is steady but slower, usually ranging between 1–3% annually. Since they already have established industries and saturated markets, economic expansion is mainly driven by innovation, technology, and services rather than basic infrastructure or manufacturing.
Emerging Markets:
These economies grow at a much faster pace, often 5–8% per year or more. Growth is fueled by industrialization, urbanization, and rising domestic consumption. For instance, India’s growing middle class and digital revolution are major drivers of its economic expansion. However, such rapid growth is often accompanied by volatility, due to political instability, fluctuating currencies, or changes in foreign investment trends.
3. Industrial and Sectoral Composition
Developed economies are service-oriented, with a significant share of GDP coming from finance, healthcare, technology, and education. For example, the U.S. economy is dominated by companies like Apple, Google, and Microsoft that symbolize the knowledge economy. Manufacturing remains important but is often outsourced to lower-cost regions.
Emerging economies, meanwhile, are production-driven, focusing on manufacturing, agriculture, and resource extraction. However, a gradual transition toward services and technology is underway. Countries like China and India are prime examples of economies moving from manufacturing-led growth to innovation-led development, with increasing emphasis on digitalization and sustainability.
4. Income Levels and Living Standards
One of the clearest distinctions between these two market types is per capita income.
Developed Markets:
These countries have high per capita GDP, often exceeding $40,000, accompanied by strong social welfare systems, high literacy rates, and excellent healthcare. The Human Development Index (HDI) is consistently high, reflecting better living standards and longer life expectancy.
Emerging Markets:
Per capita income is significantly lower, ranging between $5,000 and $15,000. However, income levels are rising rapidly due to economic reforms and industrial growth. Although inequality remains a concern, urbanization and globalization are improving access to education, healthcare, and employment opportunities.
5. Financial Markets and Investment Opportunities
Developed markets have deep, liquid, and mature financial systems, with stable currencies, advanced stock exchanges, and well-regulated banking sectors. Investors in developed markets usually enjoy lower risks but modest returns. For example, investing in the U.S. S&P 500 index offers steady long-term growth and low volatility.
Emerging markets, conversely, provide higher risk and higher reward opportunities. Their stock markets are often less efficient, meaning prices may not fully reflect all available information. This creates potential for outsized returns, especially for informed or institutional investors. However, challenges like currency volatility, regulatory unpredictability, and political risk can cause abrupt market swings.
For instance, while investing in Indian or Brazilian equities may yield double-digit returns during expansion phases, sudden policy shifts or inflation spikes can quickly erode gains.
6. Political and Institutional Stability
Developed nations usually maintain stable political systems, transparent legal frameworks, and efficient governance. Investors trust these systems because of predictable policies, strong property rights, and low corruption levels. This stability enhances long-term economic confidence.
In emerging markets, political and institutional environments are often less stable. Corruption, weak legal enforcement, and unpredictable regulations can pose serious risks. Nevertheless, many emerging economies are actively implementing reforms to strengthen democratic institutions, promote transparency, and attract foreign direct investment (FDI).
7. Infrastructure and Technology
Infrastructure is another area of sharp contrast.
Developed Economies:
Have world-class infrastructure — from advanced transport networks and reliable power supply to high-speed internet and digital governance. Technology adoption is widespread, and industries are at the forefront of innovation, artificial intelligence, and green technology.
Emerging Economies:
Often struggle with infrastructure gaps such as inadequate roads, unreliable electricity, or limited internet penetration, though rapid progress is visible. Countries like India and Indonesia are investing heavily in digital public infrastructure, renewable energy, and smart cities, aiming to bridge the gap with developed nations.
8. Demographics and Labor Markets
Emerging markets generally have younger populations with larger labor forces, providing long-term growth potential. This “demographic dividend” can be a major advantage if coupled with education and skill development. India, for example, is expected to have one of the youngest workforces in the world, fueling economic productivity for decades.
In contrast, developed countries face aging populations and shrinking labor pools, which pose challenges for social security systems and economic sustainability. These countries rely increasingly on automation, immigration, and productivity gains to offset demographic decline.
9. Global Trade and Integration
Developed markets dominate global trade, contributing a significant portion of global exports and imports. Their economies are highly integrated through multinational corporations and global supply chains.
Emerging markets are catching up fast, playing an increasingly crucial role in global trade. China’s rise as the “world’s factory” is a prime example. Moreover, emerging economies are forming regional alliances (like BRICS) to promote trade cooperation and reduce dependency on Western markets.
10. Risks and Challenges
While developed markets offer stability, they face slow growth, market saturation, and low interest rates, which limit investment returns. Political populism and high public debt in some regions (like the EU or Japan) also pose long-term challenges.
Emerging markets, on the other hand, face macroeconomic volatility, currency risks, political uncertainty, and dependency on global capital flows. External shocks—such as rising U.S. interest rates or global recessions—can trigger capital flight, weakening their currencies and economies.
11. Opportunities and Future Outlook
The future growth engine of the world economy is expected to come from emerging markets. With young populations, digital transformation, and expanding consumer bases, these nations are set to drive global demand for goods and services. By 2050, emerging economies like India, China, and Indonesia are projected to rank among the world’s largest economies.
However, developed markets will continue to lead in innovation, research, and governance, providing technological leadership and financial stability. The ideal global investment strategy may thus combine the stability of developed markets with the growth potential of emerging ones.
12. Conclusion
In summary, the contrast between emerging and developed markets lies not only in income and infrastructure but also in growth dynamics, risks, and opportunities. Developed markets represent stability, maturity, and innovation, while emerging markets symbolize growth, transformation, and potential. Together, they form a balanced ecosystem in the global economy — one driving advancement through stability, the other through dynamism and change.
For investors and policymakers alike, the key is to understand both sides — to appreciate the security of developed markets while harnessing the growth of emerging ones. In the decades ahead, the synergy between these two worlds will shape the future of global finance, trade, and prosperity.
Climate Change Impact on the Global Market1. Economic Disruptions and Global GDP Impact
Climate change directly affects global economic output through productivity losses, infrastructure damage, agricultural decline, and health impacts. Increasing temperatures reduce labor productivity, especially in agriculture, construction, and manufacturing. Coastal economies face rising costs due to sea-level rise, threatening ports, factories, and tourism hubs.
Studies consistently estimate that unmitigated climate change could reduce global GDP by 10–20% by 2100, with disproportionate impacts on developing regions such as South Asia, Africa, and Southeast Asia. These regions face intensified heatwaves, droughts, and floods that strain food systems and public resources. Conversely, countries with cooler climates may experience temporary benefits, such as longer growing seasons, yet these are overshadowed by global supply-chain disruptions and market volatility.
2. Supply Chain Disruptions and Global Trade
Climate change poses a serious threat to global supply chains that depend on stable transportation networks, predictable weather, and consistent resource availability. Extreme weather events—such as floods in China, heatwaves in Europe, and hurricanes in the US—regularly disrupt manufacturing hubs, ports, and logistics networks.
For example:
Flooding disrupts industrial zones in China, Thailand, and India, impacting electronics, automobiles, and textile production.
Droughts reduce water availability for hydropower and manufacturing, affecting production costs and reliability.
Hurricanes halt shipping lanes and damage ports, slowing global trade flows.
Industry giants are now diversifying suppliers, relocating production, and investing in climate-resilient infrastructure. Companies increasingly factor climate risk into procurement and logistics decisions, making climate resilience a competitive advantage.
3. Agriculture, Food Prices, and Commodity Markets
Agriculture is among the most vulnerable sectors. Shifting rainfall patterns, extreme heat, soil degradation, and water scarcity reduce crop yields for staples like wheat, rice, maize, and soy. These disruptions trigger volatility in global food markets.
Key impacts include:
Reduced yield stability, making long-term pricing unpredictable.
Increased input costs due to water scarcity and changing pest patterns.
Price spikes in commodities such as grains, edible oils, and sugar.
Higher insurance and credit costs for farmers exposed to climate risks.
Livestock and fisheries also suffer, with warming oceans affecting fish stocks and coral reefs. As food prices rise and become more volatile, inflationary pressures build across developing economies, impacting household budgets and political stability.
4. Energy Markets and the Shift to Renewables
Climate change drives a massive transition in global energy systems. Governments and corporations worldwide are shifting from fossil fuels to renewable energy sources like solar, wind, hydropower, hydrogen, and bioenergy. This shift impacts global markets in several ways:
A. Decline of Fossil Fuels
Oil, gas, and coal sectors face decreasing long-term demand due to carbon regulations, electric vehicle growth, and renewable adoption. Major oil companies are diversifying portfolios into green energy and carbon capture technologies.
B. Rise of Renewables
Solar and wind energy markets are rapidly expanding, creating new jobs, lower power costs, and large-scale investment opportunities. Battery storage and grid modernization are also experiencing accelerated growth.
C. Energy Price Volatility
Climate-related events, such as hurricanes shutting down offshore rigs or droughts reducing hydropower output, contribute to unpredictable energy supply and price instability.
The energy transition is reshaping geopolitics: countries with strong renewable potential—such as India, China, and Brazil—gain competitive advantages in green manufacturing and energy security.
5. Financial Markets: Risks, Returns, and Regulations
Climate change increasingly influences financial markets through three major channels:
1. Physical Risks
Damage from natural disasters affects stock valuations, bond risks, and insurance claims. Companies with assets in high-risk regions face declining valuations and higher operating costs.
2. Transition Risks
Sectors slow to shift to low-carbon models face regulatory penalties, higher carbon taxes, and stranded assets (e.g., coal plants, oil fields). Investors increasingly examine decarbonization strategies before allocating capital.
3. ESG and Sustainable Investing
Environmental, Social, and Governance (ESG) investing has grown into a multi-trillion-dollar market. Climate-focused funds, green bonds, carbon-neutral portfolios, and impact investing influence stock market performance. Companies with strong climate policies attract more investment and better credit ratings.
Central banks worldwide now require financial institutions to assess climate risks through stress tests, making climate resilience a core component of global financial stability.
6. Insurance and Risk Management
Climate disasters—wildfires, floods, hurricanes—are more frequent and severe, overwhelming insurance systems. Claims have skyrocketed in recent years, forcing insurers to:
Increase premiums
Limit coverage in high-risk areas
Adjust business models toward risk prevention
Invest in climate analytics and catastrophe modeling
Some regions could become "uninsurable," which directly affects real estate prices, investment decisions, and economic development.
7. Corporate Strategy, Innovation, and Green Technology
Corporations are transforming their business models to cope with climate change. Many industries are embracing innovation to reduce carbon footprints and capture new market opportunities.
Key innovation areas include:
Renewable energy technologies
Electric vehicles (EVs) and charging networks
Smart grids and energy-efficient buildings
Carbon capture, utilization, and storage (CCUS)
Sustainable agriculture and vertical farming
Climate analytics and AI-driven risk modelling
Water-saving technologies and desalination
Companies that adapt quickly gain competitive advantages in regulatory compliance, consumer trust, and long-term profitability.
8. Consumer Behavior and Market Demand
Climate change has shifted consumer preferences toward sustainable products and green lifestyles. Demand is increasing for:
Electric vehicles
Plant-based foods
Eco-friendly packaging
Energy-efficient appliances
Ethical brands with sustainability commitments
Younger consumers, in particular, prefer brands that align with climate responsibility. Businesses that fail to adapt face declining market share.
Conclusion
Climate change is no longer a distant threat—it is a present and powerful force reshaping the global market. It affects everything from GDP growth and supply chains to financial markets, energy systems, and consumer behavior. While the risks are enormous, including economic losses, resource scarcity, and market instability, the transition to a low-carbon economy presents unprecedented opportunities. Companies, investors, and nations that innovate and adapt quickly will lead the next era of sustainable global growth.
$AMZN Massive Call LeapNASDAQ:AMZN has sold off 17% from the highs and just got a massive call leap.
250C @ 13.50 5/15/26 $6.8 million

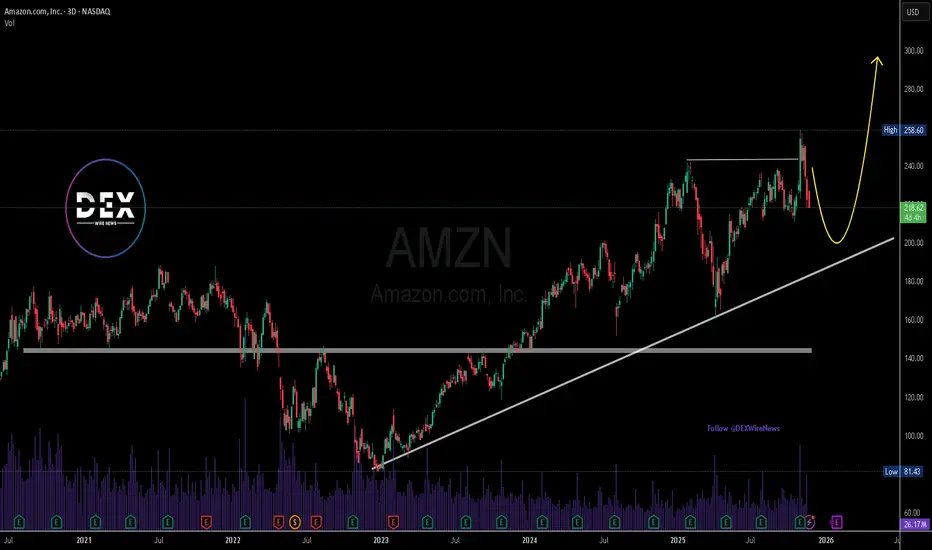
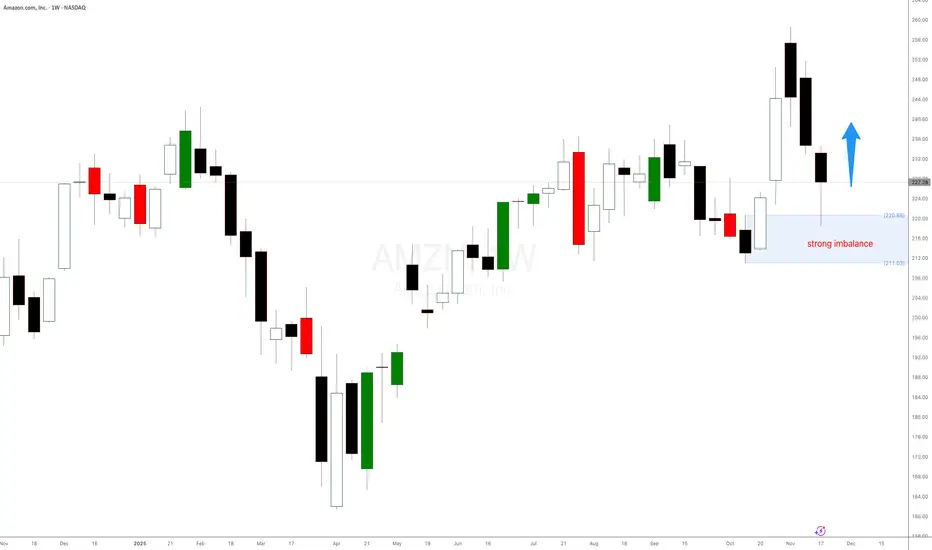
Is Amazon exploding again? New weekly demand in controlIs Amazon exploding again? New weekly demand in control at $224. Expecting a decent rally from here in the following days.
Amazon, Microsoft&the Digital Markets Act: Brussels Sets a RadarAmazon, Microsoft and the Digital Markets Act: Brussels Sets Its Radar on the Cloud
Ion Jauregui – Analyst at ActivTrades
The European Commission has opened three formal investigations into Amazon (NASDAQ: AMZN) and Microsoft (NASDAQ: MSFT) under the regulatory framework of the Digital Markets Act (DMA). The goal is to determine whether their cloud services should be classified as “gatekeepers” and whether their business practices are restricting competition in a sector overwhelmingly dominated by U.S. tech giants.
The investigation comes at a crucial moment. The cloud computing market is growing at double-digit rates and has become a cornerstone of the European digital ecosystem. The Commission argues that the sector is evolving so quickly that the DMA itself may need to be updated to avoid falling behind technologically.
Microsoft has stated it will fully cooperate, while Amazon Web Services warns that excessive regulation could “slow innovation” and raise costs for European businesses. Behind the scenes, the tension also has a political tone: with Trump pushing to protect U.S. Big Tech, Brussels is keen to flex its regulatory muscle. A resolution is expected within 12 months, although deadlines in Brussels often tend to slip.
Fundamental Analysis: Amazon and Microsoft Under Regulatory Scrutiny
Both companies rely heavily on the cloud segment for their growth.
AWS accounts for roughly 60–70% of Amazon’s operating profit, which means any regulatory barriers in Europe—however limited—create market sensitivity.
In Microsoft’s case, Azure continues to expand its market share, driven by the integration of generative AI and enterprise services. The key question is whether Brussels considers that Microsoft’s ecosystem —Windows + Office + Azure— creates a structural advantage that restricts competitors.
Despite rising regulatory risks, fundamentals remain solid: cloud revenue growth, strong operating margins, and structural expansion driven by artificial intelligence.
Technical Analysis of Amazon (AMZN)
On the daily chart, AMZN is trading sideways following the correction seen in November. Wednesday’s session closed at $222.69, a level aligned with the volume Point of Control (POC), which serves as a structural reference for the current range.
For much of the year, price action has fluctuated between $234 and $216, with a notable annual high reached on 3 November at $258.60, and an annual low at $178.85 recorded in May. At present, the price remains below the 50- and 100-day moving averages, while finding initial support above the 200-day moving average, which acts as an important dynamic support zone.
Technical indicators also reflect the corrective phase:
The RSI stands at 40.63, close to its support area, leaving room for a potential technical rebound if demand appears.
The MACD maintains a downward slope, confirming the short-term bearish momentum.
A sustained close above the 50- and 100-day moving averages would be the first technical sign of recovery, opening the door for a move back toward the $234 area and eventually another attempt to retest the annual highs around $258.
On the downside, if bearish pressure continues, the price could move again toward $216, a key support within the six-month range. A clear break below this level would expose the $202 zone, which aligns with the last major bullish impulse of the semester.
According to the ActivTrades US Market Pulse, overall market risk remains neutral following recent corrections. If Amazon continues to deliver strong results in cloud revenue and growth, it is reasonable to expect that—despite EU regulatory pressure—the stock could continue developing a positive organic trend as long as the key levels of the current range hold.
*******************************************************************************************
The information provided does not constitute investment research. The material has not been prepared in accordance with the legal requirements designed to promote the independence of investment research and such should be considered a marketing communication.
All information has been prepared by ActivTrades ("AT"). The information does not contain a record of AT's prices, or an offer of or solicitation for a transaction in any financial instrument. No representation or warranty is given as to the accuracy or completeness of this information.
Any material provided does not have regard to the specific investment objective and financial situation of any person who may receive it. Past performance and forecasting are not a synonym of a reliable indicator of future performance. AT provides an execution-only service. Consequently, any person acting on the information provided does so at their own risk. Political risk is unpredictable. Central bank actions can vary. Platform tools do not guarantee success.

Global Market Insights1. The Macro Landscape: What Drives Global Markets?
At the foundation of global market behavior lies macroeconomics—GDP growth, inflation, interest rates, employment, and institutional policies. Central banks like the Federal Reserve, ECB, Bank of England, Bank of Japan, and RBI are the most influential actors. When central banks raise interest rates, borrowing costs rise, slowing economic activity but controlling inflation. When they cut rates, markets usually react with optimism as liquidity increases and risk-taking becomes cheaper.
In recent years, inflation has re-emerged as a major theme worldwide. High energy prices, supply bottlenecks, and increased government spending pushed inflation to multi-decade highs in several countries. As a reaction, central banks tightened aggressively, influencing bond yields, stock valuations, and currency movements. For example, a strong U.S. dollar caused emerging market currencies to weaken, affecting capital flows and import costs in developing economies.
Meanwhile, GDP growth patterns are shifting. Mature economies such as the U.S. and Europe are growing slower, while emerging markets like India, Vietnam, Indonesia, and parts of Africa are becoming growth engines. This shift impacts global trade trends, investment decisions, and multinational strategies.
2. Geopolitics: The Hidden Force Behind Market Volatility
Geopolitical tensions have always influenced global markets, but in recent years these tensions have intensified. The world is moving toward a multipolar balance of power, with the U.S., China, India, Europe, and regional blocs shaping trade and diplomacy.
Key Geopolitical Themes Affecting Markets Today
US–China strategic rivalry: This impacts technology, semiconductors, trade regulation, and the global supply chain structure.
The Russia–Ukraine conflict: Triggered energy shocks, affected grain supplies, and forced Europe into an energy transition faster than planned.
Middle East tensions: Influence crude oil pricing, shipping routes, and insurance costs for global trade.
Indo-Pacific militarization: Affects shipping security and trade routes, especially the South China Sea.
Geopolitics doesn't just cause wars; it shapes regulation, technology access, investment flows, and commodity markets. Whenever geopolitical risk spikes, investors typically shift toward safe-haven assets such as gold, U.S. Treasuries, and the Swiss franc.
3. Global Trade and Supply Chains: Rebuilding After a Shock
The pandemic exposed vulnerabilities in global supply chains, leading companies and countries to rethink their dependency on single-source suppliers. As a result, the world is witnessing a shift from globalization to “selective globalization” or “friendshoring.”
New Supply Chain Trends
Companies are moving manufacturing closer to home or to politically aligned nations.
India, Mexico, Vietnam, and Eastern Europe are becoming new manufacturing hubs.
The semiconductor industry is decentralizing, with new plants in the U.S., Japan, India, and Europe.
Even though global trade volumes are recovering, structural changes are underway. Transportation costs, freight capacity, digital logistics, and sustainability regulations will define the future of the supply chain.
4. Technology: The Most Powerful Market Driver
Technology is transforming markets at every level—from stock exchange infrastructure to consumer purchasing behavior.
Key Technological Drivers
AI and Automation
AI is enhancing decision-making, trading, risk management, supply chain optimization, and consumer analytics. Algorithmic trading and AI-driven market forecasting are becoming mainstream.
Fintech and Digital Assets
Digital payments, blockchain-based systems, tokenization of assets, and CBDCs (central bank digital currencies) are reshaping global finance. While cryptocurrencies remain volatile, blockchain technology is being adopted for cross-border settlements and trade documentation.
Clean Energy Technologies
The shift toward renewable energy, EVs, hydrogen, battery storage, and smart grids is creating new investment cycles globally. Governments are incentivizing decarbonization, making green assets a major sector of focus for long-term investors.
5. Commodity Markets: The Lifeblood of Global Trade
Commodities are central to global market movements. They influence inflation, national budgets, trade balances, and sectoral performance.
Major Commodity Themes
Crude Oil: Prices fluctuate based on OPEC decisions, geopolitical tensions, and global demand. Oil remains the most influential commodity.
Natural Gas: Europe’s energy crisis made LNG shipping and pricing central to global trade stability.
Gold: Acts as a hedge against inflation, market volatility, and geopolitical uncertainty.
Food Grains: Weather patterns, wars, and export restrictions directly affect food inflation.
Industrial Metals: Copper, lithium, nickel, and rare earth minerals are crucial for electric vehicles and renewable technologies.
The world is entering a phase where clean energy metals may drive commodity markets as strongly as oil did in the 20th century.
6. Currency Markets: The Barometer of Global Strength
Currency markets determine competitiveness, trade flows, and investment allocations. The U.S. dollar continues to be the global reserve currency, meaning changes in USD strength ripple across the world.
Key Currency Insights
A strong dollar hurts emerging markets by making imports expensive and increasing debt burdens.
A weak dollar boosts global liquidity and reduces commodity costs.
Digital currencies and CBDCs are emerging as new currency formats that could challenge traditional cross-border payment structures.
Currency convertibility and stability remain critical for global confidence and investment.
7. Global Equity Markets: From Wall Street to Emerging Markets
Equity markets reflect economic expectations. Today, the world is seeing a bifurcation:
US markets are driven by technology giants, AI advancements, and strong consumption.
European markets face slow growth but benefit from strong industrial and luxury sectors.
Asian markets (India, Japan, South Korea) are gaining momentum due to manufacturing expansion, demographic advantages, and digital adoption.
India has emerged as a standout performer with strong domestic demand, stable policy frameworks, and increasing global investor attention.
Sector-wise, global markets are currently driven by:
Technology (AI, cloud, semiconductors)
Renewables and clean energy
Financial services and fintech
Pharmaceuticals and biotech
Infrastructure and defence
8. Future Trends Shaping Global Markets
Looking ahead, several mega-trends will influence global financial direction:
1. AI and robotics integration into daily life
Massive productivity gains but significant job reskilling needs.
2. Green transition
Trillions of dollars flowing into clean technologies.
3. Geopolitical realignment
New alliances, trade blocks, and emerging multipolarity.
4. Digital economy dominance
Data becoming the world’s most powerful economic resource.
5. Rising importance of emerging markets
Asia and Africa driving global consumption.
6. Climate disruption
Impacting agriculture, manufacturing, insurance, and global mobility.
Conclusion
Global markets are no longer driven by a single factor—they are shaped by an intricate network of economics, geopolitics, supply chain shifts, currency movements, commodity cycles, and rapid technological innovation. For traders, investors, policymakers, and businesses, the key to navigating global markets lies in understanding these interconnected forces and recognizing how change in one corner of the world can create a ripple across all markets.

Lucky FOREX Analysis (November 17th-21st 2025)In this week i talked bout EUR/USD AUD/NZD BTC AUD/USD S&P500 AMZN MSFT
Welcome to our weekly market breakdown — get ready for actionable forex insights to guide you through the week ahead. In this episode we cover:
🔍 Major currency pairs and key support/resistance levels
🧲 Trend analysis: where the momentum is shifting and what may be driving it
📆 Economic events to watch (interest rate decisions, inflation releases, central-bank commentary)
🛠️ Trade setups: potential entries, stop-loss zones & profit targets
🎯 Risk management tips: how to approach the week with discipline
Whether you’re a day trader, swing trader or simply keen to stay ahead of the curve, you’ll find value in this edition.
🔔 Remember:
Markets move fast. Use this analysis as one part of your trading decision process—not the whole. Always perform your own due diligence and manage your risk carefully.

Green Energy Trading🔋 1. What is Green Energy Trading?
Green energy trading involves a system where renewable electricity is produced, tracked, valued, and sold. Unlike traditional energy trading, green energy trading requires verifying that the electricity comes from renewable sources. This is done through certificates, audits, and digital tracking systems.
In simple terms:
A solar or wind plant generates electricity.
That electricity is sent into the grid.
A certificate is issued verifying that this electricity came from renewable resources.
Traders, companies, or utilities buy this certificate or the actual power to meet sustainability goals or sell further in the market.
This creates a transparent pipeline where clean power can be monetized and traded like any commodity.
🔄 2. Key Components of Green Energy Trading
(A) Renewable Energy Certificates (RECs)
One of the most important trading instruments.
A REC represents proof that 1 megawatt-hour (MWh) of electricity was produced from a renewable source.
There are two main types of RECs:
Solar RECs (S-RECs) – generated from solar projects
Non-Solar RECs (N-SRECs) – generated from wind, hydro, biomass, etc.
Corporates and institutions buy RECs to meet renewable purchase obligations (RPOs) or sustainability targets.
(B) Green Power Exchanges
Countries now have dedicated trading markets for renewable energy. For example:
India operates green energy segments on IEX and PXIL.
Europe trades green power on EPEX, Nord Pool, and others.
At these exchanges, renewable energy is bought and sold through:
Day-ahead markets
Term-ahead markets
Real-time markets
Green day-ahead markets (GDAM)
Green term-ahead markets (GTAM)
This ensures transparent price discovery and fair competition.
(C) Power Purchase Agreements (PPAs)
A PPA is a long-term contract between a green power generator and a buyer.
Large companies like Google, Amazon, Meta, Reliance, and Tata Steel use PPAs to directly procure renewable energy at fixed prices for many years.
This helps companies reduce electricity cost volatility and carbon footprint.
(D) Carbon Credits & Emission Trading
Although not the same as green energy trading, carbon credit trading supports the green energy ecosystem.
Every ton of CO₂ emission reduced can be converted into a credit and sold to polluting industries.
This system incentivizes renewable projects financially.
⚙️ 3. How Green Energy Trading Works (Step-by-Step)
Step 1: Generation
A renewable energy plant (solar park, wind farm, hydro station) produces electricity and injects it into the power grid.
Step 2: Certification
An agency verifies the energy source and issues RECs or other green certificates.
Step 3: Listing on Exchanges
Producers list their green power or certificates on:
Indian Energy Exchange (IEX)
Power Exchange India Limited (PXIL)
European or American energy markets
Step 4: Bidding & Trading
Buyers such as:
Utility companies
Industries
Corporates
Traders
Distribution companies (DISCOMs)
place bids to purchase renewable energy or certificates.
Step 5: Settlement
Traded units are delivered based on contract type — real-time, day-ahead, or long-term.
🧩 4. Why Green Energy Trading Is Growing
(A) Climate Change Awareness
Countries have committed to reducing carbon emissions under the Paris Agreement.
Green energy trading supports clean energy targets.
(B) Corporate Sustainability (ESG Goals)
Companies now have strict Environmental, Social, and Governance reporting mandates.
Purchasing green energy helps them meet ESG scores.
(C) Falling Renewable Energy Costs
Solar and wind generation costs have dropped drastically in the past decade.
This makes green energy competitive with fossil-based electricity.
(D) Government Regulations
Governments worldwide mandate renewable purchase obligations (RPOs).
Industries must buy a certain percentage of energy from renewable sources.
📉 5. Price Dynamics in Green Energy Trading
Green energy prices depend on:
Seasonal variations (wind peaks in monsoon, solar peaks in summer)
Grid congestion
Demand–supply imbalances
Policy changes
REC market demand
Fuel costs for backup systems
In markets like India, green prices sometimes fall below conventional electricity prices due to oversupply during peak renewable generation hours.
📈 6. Opportunities for Traders
Green energy markets offer multiple trading opportunities:
(A) Volatility-Based Trading
Prices fluctuate across day-ahead, real-time, and intraday markets.
(B) Arbitrage Opportunities
Traders capitalize on:
Time-based price difference
Region-based differences
Certificate value fluctuations
(C) PPA Trading
Some economies allow secondary trading of PPAs.
(D) REC Speculation
RECs can be bought low and sold high as demand increases.
🏭 7. Opportunities for Businesses
Industries Benefit Through:
Lower energy costs
Reduced carbon footprint
Compliance with RPO
Long-term price stability via PPAs
Improved corporate sustainability ratings
Many companies adopt green energy to reduce electricity bills by 20–40%.
🌍 8. Global Growth of Green Energy Trading
Countries leading the growth are:
India
Germany
USA
China
UK
Nordic countries
India’s green day-ahead market (GDAM) and green term-ahead market (GTAM) are among the fastest-growing segments in the energy space.
🤖 9. Digital Transformation in Green Energy Trading
Modern green energy trading uses:
AI-based forecasting
Blockchain for energy certificates
IoT-based smart meters
Cloud-based energy management systems
Virtual power plants (VPPs)
Blockchain ensures transparency, preventing fraud in RECs and PPAs.
🔮 10. Future of Green Energy Trading
(A) Green Hydrogen Trading
Hydrogen produced using renewable energy will form a major trading market.
(B) Battery Energy Storage (BESS) Integration
Stored renewable energy will be traded during peak demand.
(C) Peer-to-Peer Energy Trading
Consumers will directly buy and sell energy through digital platforms.
(D) Carbon-Free 24/7 Markets
Companies will match energy consumption with renewable generation every hour.
🧠 Conclusion
Green energy trading is transforming the global energy landscape. It enables renewable energy producers to monetize their power, provides companies a way to meet sustainability goals, and offers traders new opportunities through certificates, markets, and contracts. As renewable energy grows, green energy trading will continue to expand, becoming one of the most important components of the future energy economy.

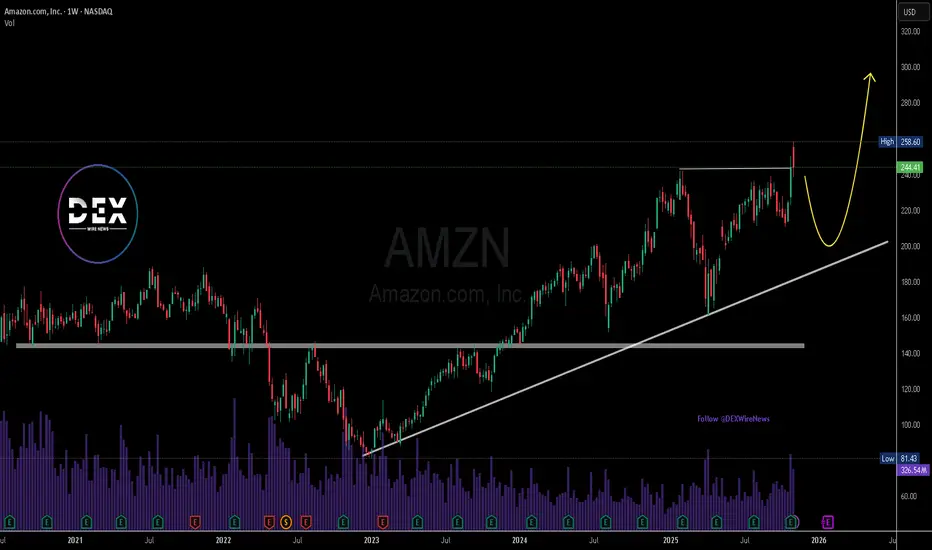
Amazon.com, Inc. ($AMZN) Expands Low-Cost Bazaar ServiceAmazon.com, Inc. (Nasdaq: NASDAQ:AMZN ) is making a bold move into the global low-cost e-commerce space. The retail giant announced the expansion of its Amazon Bazaar service — known as “Haul” in the U.S. — to 14 new international markets, intensifying competition with Shein and PDD Holdings’ Temu.
The service targets value-driven shoppers by offering ultra-cheap goods like $10 dresses, $5 accessories, and $2 home items, with a focus on emerging markets such as Nigeria, the Philippines, Hong Kong, Saudi Arabia, and Taiwan. The expansion builds on Bazaar’s earlier success in Mexico and the UAE, signaling Amazon’s strategy to tap into the fast-growing global demand for low-cost online retail amid weaker consumer sentiment.
This move comes as U.S. import tariffs under the Trump administration pressure household budgets, particularly for low-income groups. By diversifying into affordable goods, Amazon aims to defend its e-commerce dominance against Chinese platforms that have captured younger, price-sensitive consumers through viral marketing and social commerce. Analysts note that this pivot could enhance Amazon’s total addressable market and bolster revenue from international operations in 2026.
Technically, Amazon’s stock remains in a strong uptrend, trading near $244.41, slightly below its recent high of $258.60 market this week. The weekly chart shows consistent higher lows supported by a long-term ascending trendline from early 2023. The $220–$225 zone now serves as key support, with potential for a short-term pullback before resuming the rally toward the $300 level.
Momentum remains positive, with volume strength confirming investor interest following strong Q3 earnings. A sustained move above $260 could trigger a fresh bullish leg, extending Amazon’s dominant run as both a tech and retail powerhouse.