Understanding the Global Stock MarketStructure of Global Stock Markets
The global stock market is not a single entity but a network of exchanges operating in different countries. Some of the most prominent exchanges include the New York Stock Exchange (NYSE) and Nasdaq in the United States, London Stock Exchange (LSE) in the United Kingdom, Tokyo Stock Exchange (TSE) in Japan, Shanghai Stock Exchange (SSE) in China, and Bombay Stock Exchange (BSE) and National Stock Exchange (NSE) in India. These exchanges provide the infrastructure for buying and selling shares, listing companies, and ensuring market transparency.
Each stock exchange has its own regulatory framework, trading hours, and listing requirements. However, they are interconnected through global capital flows. Investors increasingly have access to foreign markets through exchange-traded funds (ETFs), American Depositary Receipts (ADRs), and international brokerage accounts, making the stock market a global arena rather than a purely domestic one.
Market Participants
The global stock market comprises various participants, each with unique objectives and strategies:
Retail Investors: Individual investors who buy and sell stocks for personal investment purposes. They often follow market trends, financial news, and analysts’ recommendations.
Institutional Investors: Entities such as mutual funds, pension funds, hedge funds, and insurance companies that manage large pools of capital. Their decisions often have a significant impact on market movements due to the size of their trades.
Market Makers and Brokers: Professionals who facilitate the buying and selling of shares, ensuring liquidity and smooth functioning of the markets.
Speculators: Traders who seek to profit from short-term price fluctuations, often using leverage, derivatives, and technical analysis to make decisions.
Regulatory Bodies: Organizations such as the Securities and Exchange Commission (SEC) in the US or the Financial Conduct Authority (FCA) in the UK oversee market operations to ensure fairness, transparency, and investor protection.
Functions of the Global Stock Market
The global stock market serves multiple essential functions:
Capital Formation: Companies raise funds by issuing shares to the public. This capital is used for expansion, research, development, and operational improvements.
Liquidity: Stock markets provide liquidity, allowing investors to quickly buy or sell shares at prevailing market prices. This enhances investor confidence and encourages participation.
Price Discovery: Stock prices reflect the collective assessment of a company’s value based on supply and demand, economic conditions, industry trends, and investor sentiment.
Wealth Creation: Long-term investment in equities has historically provided higher returns compared to other asset classes such as bonds or savings accounts.
Economic Indicator: Stock market trends often serve as leading indicators of economic health. Rising markets can signal economic optimism, while declining markets may indicate economic challenges.
Factors Influencing the Global Stock Market
Several factors drive the performance and volatility of global stock markets:
Economic Data: GDP growth, unemployment rates, inflation, and consumer spending influence investor expectations. Strong economic indicators often boost market confidence.
Corporate Earnings: Companies’ profitability and growth prospects directly affect their stock prices. Positive earnings reports can drive stock prices up, while disappointing results can trigger declines.
Monetary Policy: Central banks’ interest rate decisions and quantitative easing programs impact stock markets. Low-interest rates often encourage investment in equities, while rate hikes can reduce market liquidity.
Geopolitical Events: Wars, conflicts, trade disputes, and political instability create uncertainty, leading to market volatility. For instance, the US-China trade tensions in recent years impacted global markets significantly.
Technological Advancements: Technology has transformed trading through algorithmic trading, high-frequency trading, and online platforms, making markets more efficient but also more volatile.
Global Capital Flows: Investment trends in one region can influence markets elsewhere. For example, large inflows of capital into US equities can impact emerging markets by changing currency values and liquidity conditions.
Market Indices
Stock indices serve as barometers for the overall market or specific sectors. Some key global indices include:
S&P 500 (US): Represents the 500 largest US companies and is widely used as a benchmark for the US market.
Dow Jones Industrial Average (US): Tracks 30 major industrial companies and is often cited in financial news.
NASDAQ Composite (US): Heavy on technology and growth stocks.
FTSE 100 (UK): Comprises the 100 largest companies listed on the London Stock Exchange.
Nikkei 225 (Japan): Reflects the performance of major Japanese companies.
Sensex and Nifty 50 (India): Represent the performance of leading Indian companies on BSE and NSE.
These indices help investors track market trends, compare performance, and make informed investment decisions.
Global Interconnectivity
Global stock markets are highly interconnected due to globalization, trade, and technology. Economic developments in one country can ripple across the world. For example, a slowdown in China’s economy can impact commodity-exporting countries and influence stock markets globally. Similarly, changes in US monetary policy can affect capital flows and stock valuations in emerging markets. This interconnectivity enhances investment opportunities but also increases systemic risk.
Risks in Global Stock Markets
Investing in global equities carries several risks:
Market Risk: Prices can fluctuate due to economic, political, or social factors.
Currency Risk: Investments in foreign stocks are exposed to exchange rate fluctuations.
Liquidity Risk: Some markets or stocks may have low trading volumes, making it harder to buy or sell.
Regulatory Risk: Changes in laws, taxes, or market rules can affect returns.
Geopolitical Risk: Political instability, wars, and sanctions can disrupt markets.
Emerging Trends
The global stock market continues to evolve with trends such as:
Sustainable Investing: ESG (Environmental, Social, Governance) factors are increasingly shaping investment decisions.
Digital Assets: Cryptocurrencies and blockchain technology are creating new investment opportunities and challenges.
Automation and AI: Algorithmic trading and artificial intelligence are transforming market analysis and execution.
Global Diversification: Investors are increasingly seeking exposure to multiple markets to spread risk.
Conclusion
The global stock market is a dynamic ecosystem that connects investors, companies, and economies worldwide. It serves as a vital engine for capital allocation, economic growth, and wealth creation. While offering substantial opportunities, it is also subject to volatility and risk driven by economic cycles, geopolitical events, and investor sentiment. Understanding its structure, functions, and influencing factors is essential for anyone looking to participate effectively in global finance. As globalization deepens and technology evolves, the stock market will continue to expand, offering both challenges and opportunities for investors across the world.
Amazon.com, Inc.
No trades
Trade ideas
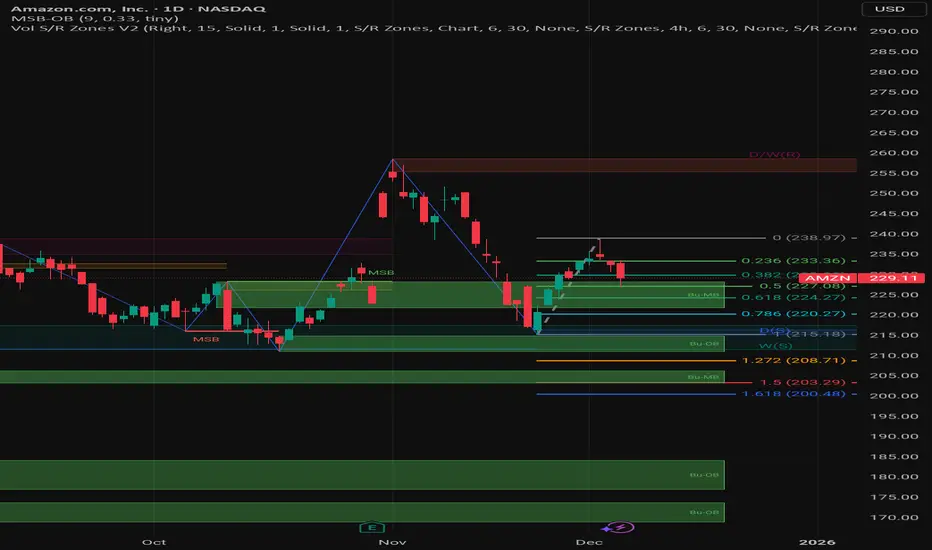
AB=CD pattern formationCurrent Price: 229.11 (Down -1.41% for the day).
Trend: Short-term bearish. The stock recently peaked at Point C (~239.00) and is currently rejecting that level, moving downwards to test immediate support zones.
Key Technical Elements
1. The ABC Structure
Leg A to B:** A significant drop from the high of ~255 down to ~215.
Leg B to C:** A corrective rally (retracement) that pushed price back up to ~239. This failed to make a higher high, creating a "Lower High" at Point C, which is a bearish signal.
Current Leg (C to D): The price is now dropping from C. The chart annotations suggest a target (PRZ) significantly lower, anticipating that this leg will extend downward.
2. Fibonacci Retracement Levels
The chart displays Fibonacci levels drawn from the low (Point B) to the high (Point C) to measure support during this pullback:
0.382 Level (229.90): The price is currently battling this level. A close below here opens the door to lower supports.
0.5 Level (227.08): The mid-point of the previous rally.
0.618 "Golden Pocket" (224.27): This is the most critical immediate support. It aligns perfectly with the green Bullish Order Block (Bu-OB).
3. Order Blocks (Support Zones)
Upper Green Zone (220.00 - 227.00): This is a strong demand zone ("Bu-OB"). This area previously acted as a base for the rally to Point C. If price enters this box, technical traders often look for a bounce.
Lower Green Zones:** There are deeper support blocks around 180.00 and 170.00, but these are far away from current price action.
Projected Scenarios
Bearish Scenario (The Chart's Primary Bias)
The chart labels a "PRZ: AB=CD 3" (Potential Reversal Zone) much lower, around the 195.00 - 200.00 area.
For this to happen, price must break the 0.618 Fib support (224.27) and the previous low at Point B (215.18).
If Point B breaks, the pattern implies a 1:1 extension (where the C-D leg equals the length of the A-B leg), targeting that ~200 zone.
Bullish Scenario
* The bulls need to defend the **0.5 (227.08) or the **0.618 (224.27) Fibonacci levels.
* A bounce from the green box (220-227) would form a "Higher Low" compared to Point B, potentially setting up a trend reversal to the upside.
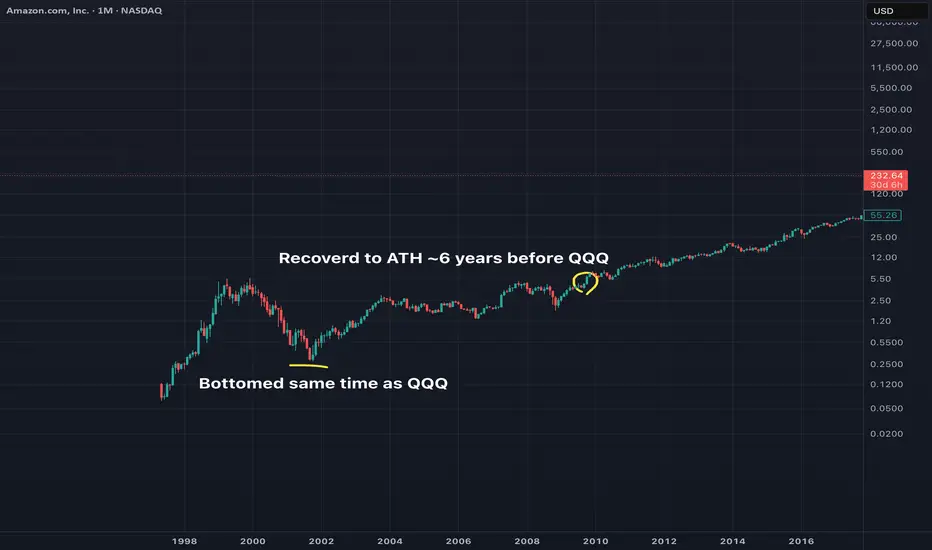
Amazon in the dotcomsHere's a chart of amazon during the dotcom crash. I think it's a useful case study especially now for the DeFi Crash
Currency Wars and Forex TradingIntroduction
The global financial system is interconnected in complex ways, and one of the most crucial aspects of this system is the movement of currencies. Currency values are not just numbers on a screen; they represent national economic strength, political stability, and global competitiveness. Two concepts that are closely tied to this reality are currency wars and forex trading. Understanding them is essential for policymakers, investors, and traders who navigate the volatile world of international finance.
What are Currency Wars?
Currency wars, sometimes referred to as “competitive devaluations,” occur when countries deliberately devalue their own currencies to gain an advantage in international trade. The primary goal is to make exports cheaper and imports more expensive, stimulating domestic economic growth. For example, if Country A devalues its currency against the US dollar, its goods become cheaper for foreign buyers, potentially boosting exports. Conversely, imports from other countries become more expensive for domestic consumers, which can encourage consumption of locally produced goods.
Historically, currency wars are often associated with periods of global economic stress. The Great Depression of the 1930s and the financial crisis of 2008 both saw nations engaging in strategies to weaken their currencies to protect domestic industries. Currency wars can also arise from competitive monetary policies, where central banks use tools like interest rate cuts or quantitative easing to influence their currency’s value.
Causes of Currency Wars
Trade Imbalances: Countries with persistent trade deficits may attempt to devalue their currency to make exports more competitive and reduce the deficit.
Economic Stimulus Needs: During recessions, weaker currencies can boost domestic growth by encouraging exports.
Monetary Policy Differences: Central banks may adopt divergent policies—like lowering interest rates or engaging in quantitative easing—to influence their currency’s strength.
Global Political Tensions: Geopolitical rivalries can prompt countries to manipulate their currencies to protect economic interests.
While currency devaluation can stimulate exports, it also has risks. It can trigger inflation, erode consumer purchasing power, and provoke retaliatory measures from trading partners. If multiple nations engage in competitive devaluation simultaneously, a currency war emerges, potentially destabilizing the global economy.
Forex Trading: The Global Currency Market
Forex trading, or foreign exchange trading, is the act of buying and selling currencies in a decentralized global market. The forex market is the largest financial market in the world, with daily trading volumes exceeding $7 trillion as of 2023. Traders, investors, corporations, and governments participate to hedge risks, speculate on currency movements, or conduct international transactions.
The forex market operates 24 hours a day across different time zones, spanning financial centers in London, New York, Tokyo, and Sydney. Trading occurs in currency pairs, such as EUR/USD, USD/JPY, and GBP/USD. The value of a currency pair represents how much of the quote currency (the second currency) is needed to purchase one unit of the base currency (the first currency).
How Currency Wars Impact Forex Trading
Currency wars have a profound influence on forex markets. Since forex trading revolves around the relative value of currencies, any deliberate move by a government or central bank to weaken its currency creates volatility and trading opportunities.
Volatility and Speculation: Traders often capitalize on expected devaluations by short-selling the currency of a country engaging in competitive devaluation. Increased volatility can lead to both higher profits and greater risks.
Interest Rate Differentials: Central banks may cut interest rates to weaken their currency, affecting forex markets. Investors seek higher yields, leading to capital flows that influence currency values.
Safe-Haven Currencies: During currency wars, investors often flock to stable currencies like the US dollar, Swiss franc, or Japanese yen, affecting global liquidity and forex pricing.
Market Sentiment: Perceptions of a country’s economic health and political stability, influenced by currency policies, directly affect trading decisions in forex markets.
For instance, during the 2010s, when Japan aggressively pursued monetary easing to combat deflation, the Japanese yen experienced periods of significant depreciation. Forex traders who anticipated these moves were able to profit from yen carry trades and other strategies.
Trading Strategies in a Currency War
Currency wars create unique opportunities and risks for forex traders. Common strategies include:
Carry Trades: Traders borrow a low-interest-rate currency and invest in a high-interest-rate currency. In times of currency wars, the low-interest-rate currency may weaken, amplifying gains.
Technical Analysis: Traders analyze historical price movements, support/resistance levels, and technical indicators to predict currency movements in volatile markets.
Fundamental Analysis: Economic indicators such as GDP growth, trade balances, inflation, and central bank policies are closely monitored to anticipate currency devaluations.
Hedging: Corporations and investors may hedge their exposure to currency fluctuations using options, forwards, and futures contracts to manage risk during competitive devaluations.
However, currency war-induced volatility also carries risks of sudden market reversals. Traders must balance potential gains with the risk of unexpected policy changes or geopolitical developments.
Examples of Currency Wars in History
The 1930s Great Depression: Many countries devalued their currencies to boost exports, leading to trade tensions and global economic instability.
2008 Financial Crisis: Central banks in the US, Japan, and Europe implemented aggressive monetary easing, prompting fears of competitive devaluations.
US-China Trade Tensions (2010s–2020s): Both nations took measures affecting their currency values, impacting global trade flows and forex markets.
These examples show that currency wars are not only about short-term profit but also involve broader geopolitical and economic consequences.
Implications of Currency Wars
Global Trade Disruption: Competitive devaluations can distort trade balances and create uncertainty for exporters and importers.
Inflation Risks: Weaker currencies can increase import costs, driving domestic inflation.
Capital Flow Volatility: Investors may rapidly shift funds to perceived safe-haven currencies, affecting emerging markets.
Policy Retaliation: Countries may impose tariffs, quotas, or other trade barriers, exacerbating tensions.
Thus, currency wars have a dual impact: they influence both macroeconomic stability and micro-level trading opportunities.
Conclusion
Currency wars and forex trading are deeply intertwined. While currency wars involve deliberate attempts by nations to manipulate exchange rates for competitive advantage, forex trading represents the arena where these policies manifest in tangible price movements. Traders who understand the dynamics of currency wars can profit from volatility, but they must also navigate the risks of sudden policy shifts, global economic pressures, and geopolitical events.
In today’s interconnected world, the study of currency wars and forex trading is more relevant than ever. Central banks’ policies, global trade imbalances, and political developments can all cause rapid fluctuations in currency markets, influencing everything from international trade to individual investment portfolios. For policymakers, understanding the consequences of currency devaluation is critical to maintaining economic stability. For traders, monitoring these developments is essential for navigating the high-stakes, fast-moving world of forex markets.
Global Finance and Central Control1. The Architecture of Global Finance
The modern global financial system is built on several interconnected layers:
a) International Financial Markets
These include:
Foreign exchange (Forex) markets where currencies are traded.
Global bond markets where governments and corporations borrow.
Equity markets where companies raise capital.
Derivatives markets where risk is traded through futures, options, and swaps.
These markets operate almost 24/7 and link every financial center—New York, London, Tokyo, Singapore, Dubai, Frankfurt.
b) Cross-Border Capital Flows
Capital moves across borders in the form of:
Foreign direct investment (FDI)
Portfolio investments in stocks and bonds
Bank lending
Remittances
Trade financing
These flows allow nations to grow, but they also expose countries to global shocks.
c) Financial Institutions
The key pillars include:
Global banks (JPMorgan, HSBC, Citi, Standard Chartered)
Multinational corporations
Pension funds and sovereign wealth funds
Hedge funds and private equity
Central banks and regulatory bodies
Together, these institutions shape how money circulates globally.
2. The Rise of Central Control in Global Finance
Although global finance appears “free-flowing,” it is not without central oversight. Control is exerted in three broad ways:
A. Central Banks: The Nerve Centers of Financial Power
Central banks are the most powerful financial institutions within countries, but their influence spills into global markets.
Key Functions
Set interest rates that influence global borrowing.
Control money supply and liquidity.
Stabilize inflation and currency value.
Act as lenders of last resort during crises.
Global Impact
When the Federal Reserve (US) raises or cuts rates, the effects cascade worldwide:
Global investors shift capital.
Emerging-market currencies rise or fall.
Commodity prices fluctuate.
Debt burdens in dollar-dependent nations increase or ease.
Similarly, the European Central Bank (ECB), Bank of England, and Bank of Japan impact global liquidity and yield curves.
In this sense, global finance is not only shaped by markets but by centralized monetary decisions from a handful of powerful institutions.
B. International Financial Institutions (IFIs)
These include:
International Monetary Fund (IMF)
World Bank
Bank for International Settlements (BIS)
Financial Stability Board (FSB)
Their Role in Central Control
1. The IMF
Provides emergency loans, sets macroeconomic rules, and monitors global financial stability. Countries receiving IMF support must often adopt conditions such as:
Fiscal tightening
Structural reforms
Currency adjustments
This creates a form of policy influence over sovereign nations.
2. The World Bank
Finances development projects and shapes the economic policies of emerging markets through program design and conditional funding.
3. The BIS
Known as the “central bank of central banks,” the BIS sets global banking norms through the Basel accords:
Basel I: Capital requirements
Basel II: Risk management
Basel III: Liquidity and leverage rules
These rules unify how banks operate across the world.
4. Financial Stability Board (FSB)
Coordinates global regulators and sets standards for the world’s largest banks and financial institutions.
C. Regulatory and Political Control
Global finance is also influenced by:
Government fiscal policies
Trade agreements
Sanctions and geopolitical decisions
Financial regulations (AML, KYC, FATF rules)
The Power of Sanctions
The U.S., EU, and UN often use financial sanctions to control, punish, or pressure countries.
Sanctions affect:
Banking access (SWIFT restrictions)
Global payments
Trade receipts
Ability to borrow internationally
This highlights how finance becomes a tool of geopolitical influence.
3. The USD-Centric Financial Order
The U.S. dollar is the anchor of global finance:
60% of global reserves
88% of all FX transactions
50%+ of global trade invoicing
This dominance gives the U.S. unparalleled financial power:
It influences global liquidity via Fed policy.
It controls access to dollar clearing.
It sets global borrowing costs.
It can impose financial sanctions with global impact.
In short, the dollar system is a centralized backbone of global finance.
4. Technology and the Future Centralization of Finance
Digital innovation is transforming financial control.
A. Central Bank Digital Currencies (CBDCs)
Many countries—including China, India, the EU, and the U.S.—are researching or piloting CBDCs.
Implications
Real-time monetary policy tools
Greater surveillance of transactions
More control over taxation and fiscal distribution
Potential reduction in cash usage
Cross-border settlement improvements
CBDCs strengthen central authority and expand the scope of financial oversight.
B. Digital Payments & Fintech Networks
Platforms like:
UPI (India)
PayPal
SWIFT gpi
Visa/Mastercard
RippleNet
Crypto exchanges
These networks process billions of transactions daily. While they make finance efficient, they also consolidate control within digital ecosystems.
C. Cryptocurrencies and Decentralized Finance (DeFi)
Crypto represents the opposite of central control:
No central intermediary
Blockchain-based transparency
Peer-to-peer value transfer
However, regulators are increasing oversight on:
Exchanges
Stablecoins
DeFi protocols
On- and off-ramps
This means even decentralized systems are gradually being integrated back into the centrally regulated financial order.
5. The Tension Between Free Markets and Central Control
Global finance operates under constant tension:
Free Market Forces
Capital flows to high-return markets.
Traders respond to price signals.
Currency values fluctuate.
Central Controls
Interest rate decisions
Capital controls
Sanctions
Regulatory requirements
Monetary interventions
The global system depends on maintaining a balance between these forces.
Too much freedom leads to speculative bubbles and crises.
Too much central control restricts innovation and creates financial rigidity.
6. Crises and the Need for Central Coordination
Major financial crises have shown why central coordination is essential:
1997 Asian Financial Crisis
Massive capital flight destabilized multiple economies.
2008 Global Financial Crisis
The collapse of U.S. mortgage markets triggered global recession.
2020 Pandemic Shock
Central banks injected unprecedented liquidity to prevent collapse.
During crises, free markets alone cannot stabilize the system—central intervention becomes indispensable.
7. The Direction of Global Finance Going Forward
The future will be shaped by three trends:
1. Increasing Centralization
CBDCs
Stronger regulatory norms
Coordinated global oversight
Tighter cross-border monitoring
2. Multipolar Financial Power
Rise of China’s yuan
India’s rapid economic growth
Regional currency arrangements
Asian, Middle Eastern, and African financial alliances
3. Hybrid Financial Models
Mix of centralized control (CBDCs, regulations) and decentralized innovation (blockchain, tokenized assets).
Conclusion
Global finance is a vast, interconnected system shaped by markets, institutions, and powerful central actors. Central banks, the IMF, World Bank, BIS, and regulatory bodies exercise significant control over capital movement, banking standards, and financial stability. At the same time, digital transformation—from CBDCs to fintech—will increase central oversight while creating new tensions with decentralized technologies like crypto.
In essence, global finance is both free-flowing and centrally influenced, a system where market dynamics meet institutional power. Understanding this balance is essential to understanding how the world’s economic engine truly works.
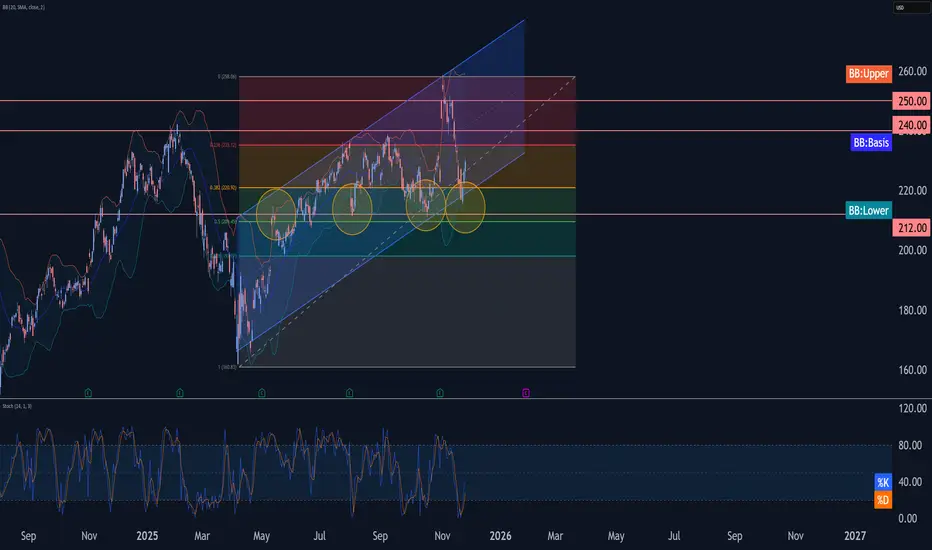
Amazon Wave Analysis – 25 November 2025- Amazon reversed from support area
- Likely to rise to resistance level 240.00
Amazon recently reversed from support area between the pivotal support level 212.00 (which has been reversing the price from May), lower daily Bollinger Band and the 50% Fibonacci correction of the upward impulse 1 from April.
The upward reversal from this support area stopped the previous sharp downward correction 2.
Given the clear daily uptrend, Amazon can be expected to rise further to the next resistance level 240.00.
RSI Bearish DivergenceAs we can see, there is a hidden RSI Divergence.
A HIDDEN RSI Divergence occur when we see lower highs for the price, and higher highs for the RSI.
The reason it is considered hidden is because the indicator refers to a momentum continuation, while the price is actually achieving lower highs.
This is confirmed by the last bearish candle we see.
...Please note, this is a 2 Hours Chart...
If the price breaks above and RSI continued to make higher higher along with the price, it might not divert.
On another note:
-We can notice a STRONG RSI Divergence, starting from the last candle in 30 October.
The reason it is strong is because the we see a strong price hike, and the momentum is decreased.

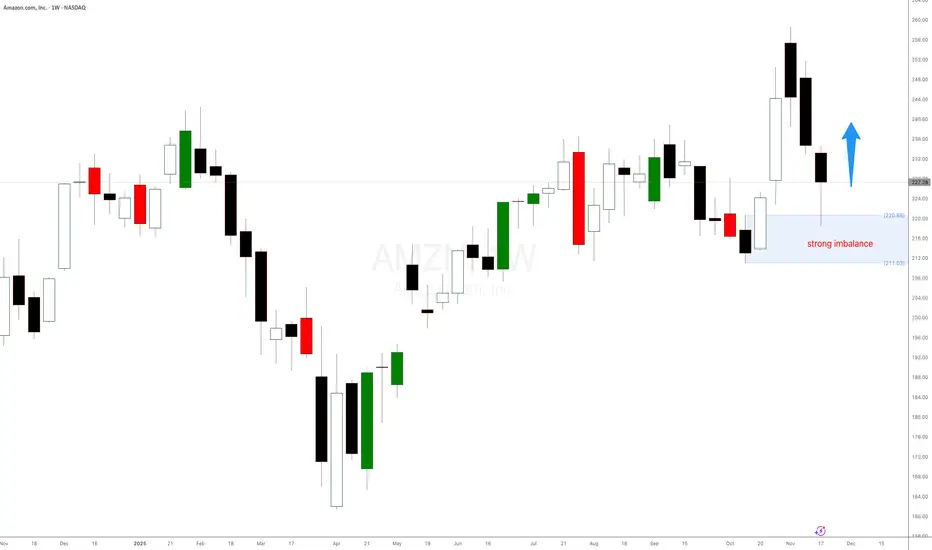
Why os Amazon $AMZN rallying?Why os Amazon NASDAQ:AMZN rallying? Amazon st. The strong weekly demand level at $231 per share is still in control. Rallying as expected. Long positions should be managed.
Hopefully, Amazon stock will continue to rally. These imbalances are great for stock swing trading, bullish stock option strategies and intraday stock trading once the imbalance gains control.

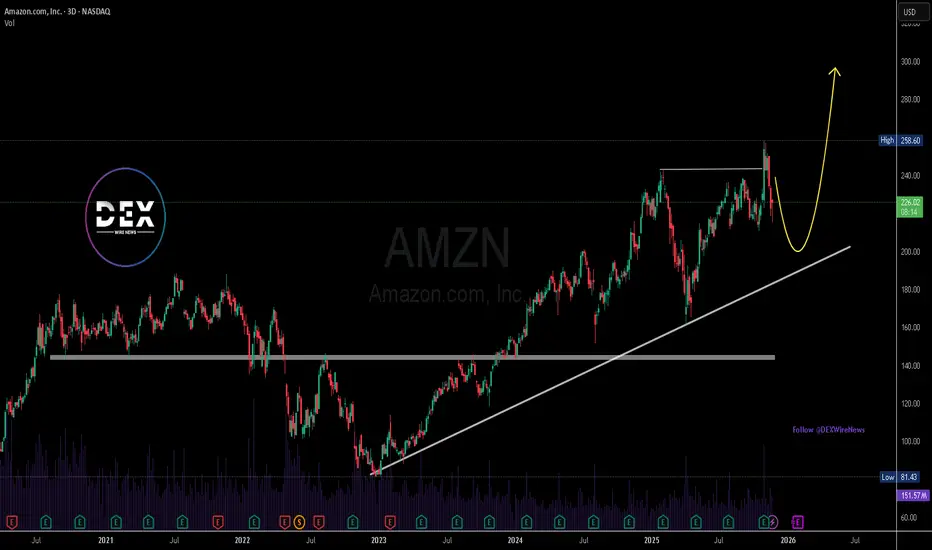
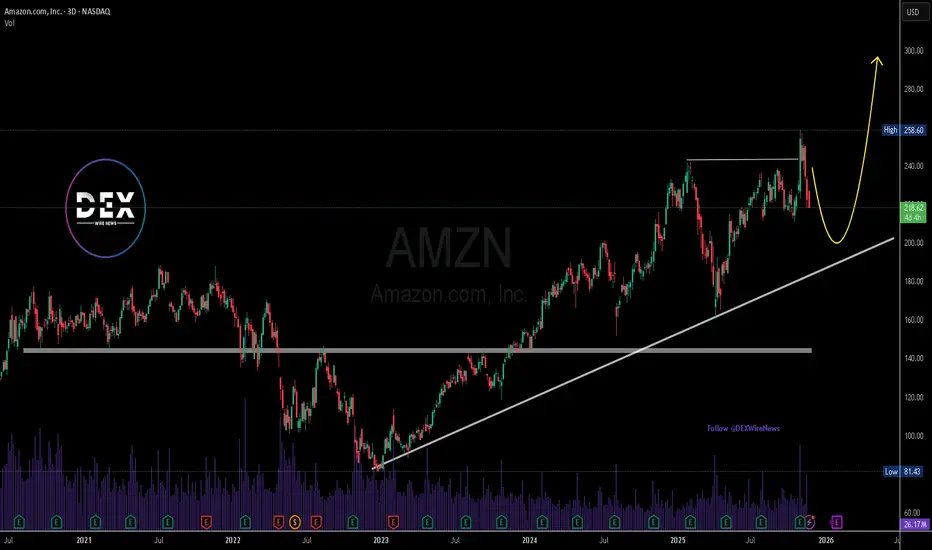
Amazon (NASDAQ: $AMZN) Expands AI Power With $50B GovCloud PushAmazon (NASDAQ: NASDAQ:AMZN ) is strengthening its position in the AI and cloud infrastructure race with a massive pledge of up to $50 billion to expand supercomputing capacity for U.S. government agencies. The investment focuses on building advanced AWS data centers across Top Secret, Secret, and GovCloud regions starting in 2026, adding nearly 1.3 gigawatts of AI and high-performance computing power. With more than 11,000 government customers, AWS aims to widen its lead as AI competition intensifies across cloud providers.
Industry analysts note that Amazon has lost some ground in AI-specific cloud growth to rivals like Google and Oracle. As companies such as Microsoft, OpenAI, and Alphabet pour billions into AI infrastructure, Amazon’s scale-driven investment is a strategic move to ensure AWS remains the backbone of government AI systems.
The new capacity will support federal agencies with a full stack of AI tools—including Amazon SageMaker, Amazon Bedrock, and foundation models like Amazon Nova and Anthropic Claude—allowing them to build customized AI solutions at scale. Analysts expect the U.S. government to accelerate AI adoption as part of its race to maintain technological leadership over China.
Technical Outlook
AMZN is currently pulling back from the $258 resistance, forming a healthy correction toward the $232 support zone, which aligns with a weekly demand level. Bulls will look for a strong reaction here to retest the $258 high and potentially break above it.
A failure at $232 exposes the ascending trendline support that has guided Amazon’s uptrend since early 2023. The RSI cooling off suggests this is a normal correction rather than a trend reversal. If support holds, upside targets between $280–$300 remain valid, matching long-term Fibonacci projections.
Possible Amazon BounceAmazon fill the earnings gap. I'm bullish on Amazon but not too strongly beacause of pressure on whole stock market. I don't know where the stock will open today but if it gave me a favarable enty, I plan to go long.
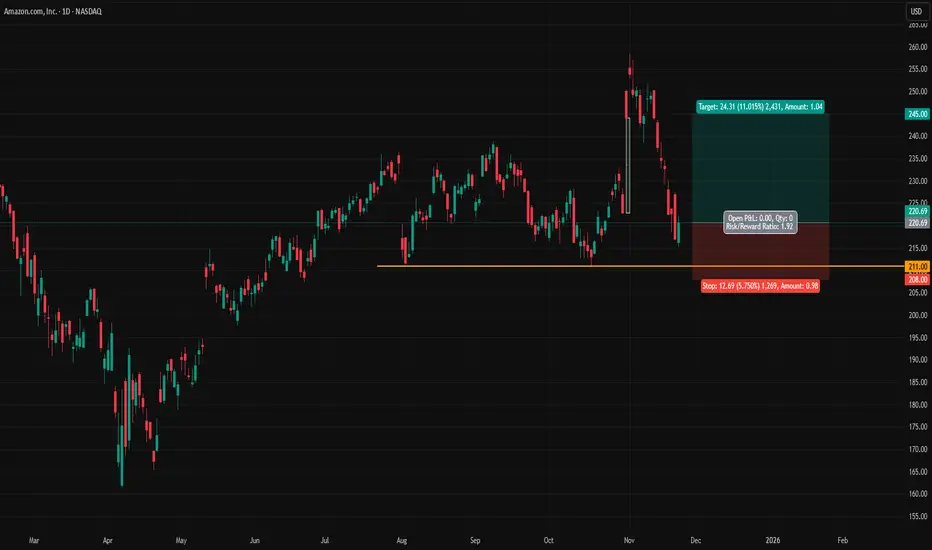
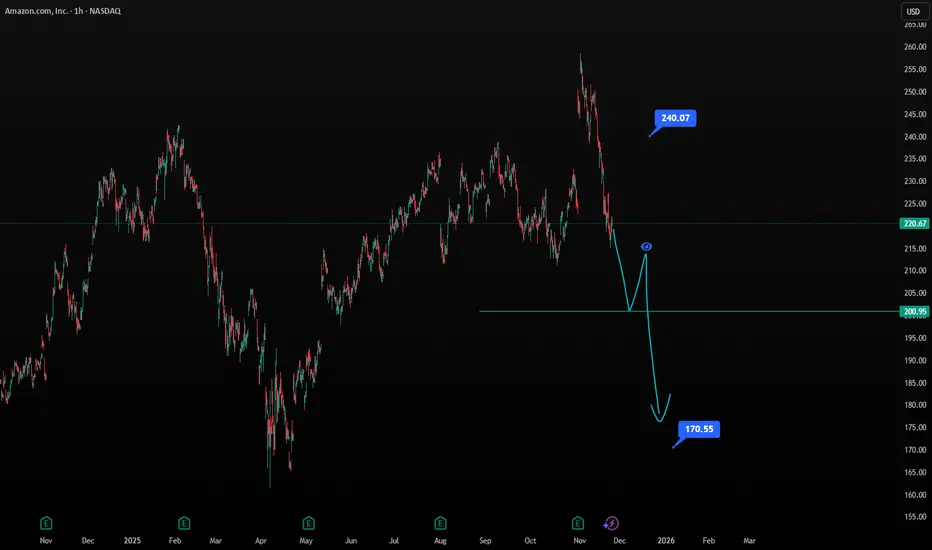
Midterm Stock Forecast for AmazonNASDAQ:AMZN At 220, Amazon sits at a pivotal midterm level. Holding $200 keeps bullish structure intact with upside potential toward $244. A breakdown below $200, however, exposes $170 as a downside target. Fundamentally, AWS growth and retail margin improvements support the bull case, but macro softness could trigger deeper corrections.
Global Currency Adventure in the Trade Market1. The Foundation of the Global Currency System
At the heart of global trade lies the exchange of currencies. When a country imports goods, it must purchase the exporter’s currency. Similarly, when firms invest across borders, they need to convert money into the host country’s currency. This constant exchanging gives value to each currency based on supply and demand.
Today’s global currency system operates under floating exchange rates, meaning currencies move freely based on market forces. Unlike the earlier gold-standard era or the post–World War II Bretton Woods system, most currencies now fluctuate day-to-day. This flexibility has increased financial freedom but also created higher volatility—making currency markets more adventurous and risky.
2. Major Players in the Currency Adventure
The global currency journey is shaped by several participants:
Central Banks
Institutions like the Federal Reserve (USA), European Central Bank, Reserve Bank of India, and Bank of Japan influence currency values through interest rate policies, inflation control, and monetary interventions. Their announcements often create dramatic market moves.
Commercial Banks
These banks facilitate currency conversion for businesses, governments, and individuals. Their massive transactions give them significant power in the forex market.
Multinational Corporations
Global companies like Apple, Toyota, and Samsung hedge currency risks because their revenues come from multiple countries. Their transactions often shift supply and demand for specific currencies.
Investors and Traders
Speculators search for profit by predicting currency movements. Their rapid trades increase market liquidity and volatility.
Governments
Policies like trade tariffs, sanctions, or foreign investment regulations can strengthen or weaken a currency.
Together, these players create a vibrant, never-ending cycle of currency flows that keeps the global trade market alive.
3. Currency Value: What Makes It Rise or Fall?
Currency movements are driven by a combination of economic, political, and psychological factors:
a. Interest Rates
Higher interest rates attract foreign investors seeking better returns. This increases currency demand and strengthens it. Lower rates often weaken currencies.
b. Inflation
Low inflation makes a currency more valuable because purchasing power is preserved. High inflation erodes value.
c. Economic Data
GDP growth, unemployment rates, retail sales, manufacturing output, and trade balance reports influence how strong a country’s economy appears—impacting its currency.
d. Political Stability
Countries with stable governments attract investment and boost currency strength. Political uncertainty weakens confidence and triggers currency sell-offs.
e. Global Market Sentiment
Fear or optimism fuels speculative behavior. During global crises, safe-haven currencies like the U.S. dollar, Swiss franc, and Japanese yen strengthen.
Understanding these factors is crucial for navigating the adventure of currency markets.
4. Currency Wars: When Nations Compete to Devalue
A notable chapter in the global currency adventure involves currency wars—situations where nations try to intentionally weaken their own currencies to make exports cheaper. A weaker currency helps domestic industries by increasing their global competitiveness.
However, currency wars can lead to:
Trade tensions
Retaliatory responses
Inflation challenges
Global market instability
Examples include Japan’s attempt to weaken the yen in the 2010s, China’s devaluation strategies, and emerging market interventions to protect exports.
5. Currency and Global Trade: A Symbiotic Relationship
The strength of a currency directly affects trade.
Strong Currency Effects
Imported goods become cheaper
Exports become expensive
Trade deficits may widen
For example, a strong U.S. dollar makes imported electronics cheaper for Americans but makes American agricultural exports costly for foreign buyers.
Weak Currency Effects
Exports become cheaper
Imports become costlier
Domestic industries benefit
Trade surplus may improve
Countries like China have historically benefited from controlled currency management to boost exports.
The balance between export competitiveness and import affordability is a delicate dance that shapes trade policies worldwide.
6. The Technological Revolution in Currency Trading
Advancements in technology have transformed the forex market:
Algorithmic Trading
Computer-driven strategies execute millions of trades within milliseconds. Algorithms detect patterns, news events, and price anomalies faster than humans.
Blockchain and Digital Currencies
Cryptocurrencies like Bitcoin have introduced decentralized finance into global markets. Central banks are also developing CBDCs (Central Bank Digital Currencies) to modernize monetary systems.
AI & Machine Learning
AI predicts price movements, analyzes sentiment, and automates risk management.
These innovations add new layers to the currency adventure, making markets more accessible yet more complex.
7. Currency Hedging: Managing Risks in International Trade
Since currency values fluctuate continuously, businesses face the risk of losing money if rates move unfavorably. To protect themselves, they use:
Forward Contracts – agreements to exchange currencies at a future date at a fixed rate.
Futures Contracts – exchange-traded versions of forward contracts.
Options – the right (but not obligation) to buy or sell at a predetermined rate.
Swaps – exchanging currencies and interest payments over time.
Hedging ensures stable profits and predictable costs, especially for exporters and importers.
8. Currency Crises: When the Adventure Turns Dangerous
History shows that currencies can collapse dramatically:
Asian Financial Crisis (1997)
Argentine Peso Crash (2001)
Russian Ruble Crisis (2014)
Turkish Lira Hyper-Inflation (2018-2022)
These crises often involve:
Excessive foreign debt
Weak economic fundamentals
Political instability
Market panic
When a currency collapses, inflation skyrockets, imports become unaffordable, and economies suffer deep recessions.
9. The Future of Global Currency Adventure
The currency landscape is evolving rapidly. Trends shaping the future include:
Digitalization of Money
CBDCs will modernize cross-border transactions, reduce settlement time, and bring transparency.
De-Dollarization Efforts
Many nations are reducing dependency on the U.S. dollar to avoid geopolitical risks.
Rise of Regional Currency Alliances
Groups like BRICS are exploring unified digital payment systems and currency baskets.
Greater Speculation and Liquidity
With technology connecting global traders 24/7, volatility and opportunities will continue to grow.
Conclusion
The global currency adventure in the trade market is a complex, thrilling journey filled with risk, opportunity, and constant change. Currencies are the heartbeat of global trade; they influence prices, profits, investments, and economic power. As nations develop, technologies advance, and geopolitical dynamics evolve, currency markets will remain one of the most fascinating and essential components of global finance.

RSI DivergenceHello fellas,
This is a very classic textbook RSI divergence scenario where we see that rising price tops with lower RSI tops.
It means that even though price increased, the momentum has decreased.
When you see rising price + decreasing momentum = it usually means buyers are exhausted.
Buyers exhausted = weak buying = strong selling = price down.
Thank you,
-not a buy or sell recommendation. just sharing my idea regarding a very classic RSI divergence pattern and how did it look like.
Don't over complicate, don't think of ideas out of place. If there is confusion, it means you don't know what's happening. If it is clear as day light, it means it is clear as day light.
The market is the market, you can't control it. However, you can control your actions and learn from yourself. Though preferably not the hard way.
Easy to learn new things, but 10x harder to unlearn wrong things.

Climate Change Impact on the Global Market1. Economic Disruptions and Global GDP Impact
Climate change directly affects global economic output through productivity losses, infrastructure damage, agricultural decline, and health impacts. Increasing temperatures reduce labor productivity, especially in agriculture, construction, and manufacturing. Coastal economies face rising costs due to sea-level rise, threatening ports, factories, and tourism hubs.
Studies consistently estimate that unmitigated climate change could reduce global GDP by 10–20% by 2100, with disproportionate impacts on developing regions such as South Asia, Africa, and Southeast Asia. These regions face intensified heatwaves, droughts, and floods that strain food systems and public resources. Conversely, countries with cooler climates may experience temporary benefits, such as longer growing seasons, yet these are overshadowed by global supply-chain disruptions and market volatility.
2. Supply Chain Disruptions and Global Trade
Climate change poses a serious threat to global supply chains that depend on stable transportation networks, predictable weather, and consistent resource availability. Extreme weather events—such as floods in China, heatwaves in Europe, and hurricanes in the US—regularly disrupt manufacturing hubs, ports, and logistics networks.
For example:
Flooding disrupts industrial zones in China, Thailand, and India, impacting electronics, automobiles, and textile production.
Droughts reduce water availability for hydropower and manufacturing, affecting production costs and reliability.
Hurricanes halt shipping lanes and damage ports, slowing global trade flows.
Industry giants are now diversifying suppliers, relocating production, and investing in climate-resilient infrastructure. Companies increasingly factor climate risk into procurement and logistics decisions, making climate resilience a competitive advantage.
3. Agriculture, Food Prices, and Commodity Markets
Agriculture is among the most vulnerable sectors. Shifting rainfall patterns, extreme heat, soil degradation, and water scarcity reduce crop yields for staples like wheat, rice, maize, and soy. These disruptions trigger volatility in global food markets.
Key impacts include:
Reduced yield stability, making long-term pricing unpredictable.
Increased input costs due to water scarcity and changing pest patterns.
Price spikes in commodities such as grains, edible oils, and sugar.
Higher insurance and credit costs for farmers exposed to climate risks.
Livestock and fisheries also suffer, with warming oceans affecting fish stocks and coral reefs. As food prices rise and become more volatile, inflationary pressures build across developing economies, impacting household budgets and political stability.
4. Energy Markets and the Shift to Renewables
Climate change drives a massive transition in global energy systems. Governments and corporations worldwide are shifting from fossil fuels to renewable energy sources like solar, wind, hydropower, hydrogen, and bioenergy. This shift impacts global markets in several ways:
A. Decline of Fossil Fuels
Oil, gas, and coal sectors face decreasing long-term demand due to carbon regulations, electric vehicle growth, and renewable adoption. Major oil companies are diversifying portfolios into green energy and carbon capture technologies.
B. Rise of Renewables
Solar and wind energy markets are rapidly expanding, creating new jobs, lower power costs, and large-scale investment opportunities. Battery storage and grid modernization are also experiencing accelerated growth.
C. Energy Price Volatility
Climate-related events, such as hurricanes shutting down offshore rigs or droughts reducing hydropower output, contribute to unpredictable energy supply and price instability.
The energy transition is reshaping geopolitics: countries with strong renewable potential—such as India, China, and Brazil—gain competitive advantages in green manufacturing and energy security.
5. Financial Markets: Risks, Returns, and Regulations
Climate change increasingly influences financial markets through three major channels:
1. Physical Risks
Damage from natural disasters affects stock valuations, bond risks, and insurance claims. Companies with assets in high-risk regions face declining valuations and higher operating costs.
2. Transition Risks
Sectors slow to shift to low-carbon models face regulatory penalties, higher carbon taxes, and stranded assets (e.g., coal plants, oil fields). Investors increasingly examine decarbonization strategies before allocating capital.
3. ESG and Sustainable Investing
Environmental, Social, and Governance (ESG) investing has grown into a multi-trillion-dollar market. Climate-focused funds, green bonds, carbon-neutral portfolios, and impact investing influence stock market performance. Companies with strong climate policies attract more investment and better credit ratings.
Central banks worldwide now require financial institutions to assess climate risks through stress tests, making climate resilience a core component of global financial stability.
6. Insurance and Risk Management
Climate disasters—wildfires, floods, hurricanes—are more frequent and severe, overwhelming insurance systems. Claims have skyrocketed in recent years, forcing insurers to:
Increase premiums
Limit coverage in high-risk areas
Adjust business models toward risk prevention
Invest in climate analytics and catastrophe modeling
Some regions could become "uninsurable," which directly affects real estate prices, investment decisions, and economic development.
7. Corporate Strategy, Innovation, and Green Technology
Corporations are transforming their business models to cope with climate change. Many industries are embracing innovation to reduce carbon footprints and capture new market opportunities.
Key innovation areas include:
Renewable energy technologies
Electric vehicles (EVs) and charging networks
Smart grids and energy-efficient buildings
Carbon capture, utilization, and storage (CCUS)
Sustainable agriculture and vertical farming
Climate analytics and AI-driven risk modelling
Water-saving technologies and desalination
Companies that adapt quickly gain competitive advantages in regulatory compliance, consumer trust, and long-term profitability.
8. Consumer Behavior and Market Demand
Climate change has shifted consumer preferences toward sustainable products and green lifestyles. Demand is increasing for:
Electric vehicles
Plant-based foods
Eco-friendly packaging
Energy-efficient appliances
Ethical brands with sustainability commitments
Younger consumers, in particular, prefer brands that align with climate responsibility. Businesses that fail to adapt face declining market share.
Conclusion
Climate change is no longer a distant threat—it is a present and powerful force reshaping the global market. It affects everything from GDP growth and supply chains to financial markets, energy systems, and consumer behavior. While the risks are enormous, including economic losses, resource scarcity, and market instability, the transition to a low-carbon economy presents unprecedented opportunities. Companies, investors, and nations that innovate and adapt quickly will lead the next era of sustainable global growth.
Stock market will test yearly levels below current supportAs the yearly candle closes and the new one opens, there is an orderflow pattern that is well developed. This will play out again as always 💎

$AMZN Massive Call LeapNASDAQ:AMZN has sold off 17% from the highs and just got a massive call leap.
250C @ 13.50 5/15/26 $6.8 million

Amazon(NASDAQ: $AMZN) Invests $3B in New Mississippi AI Data HubAmazon.com (NASDAQ: NASDAQ:AMZN ) announced plans to invest at least $3 billion in a new data-center campus located in Warren County, Mississippi. The project will support Amazon Web Services’ expanding AI and cloud-infrastructure needs, reinforcing AWS’s position as the company’s fastest-growing and most profitable segment.
The data-center development is expected to create more than 200 direct jobs at the site and support over 300 additional roles in the surrounding region. Amazon highlighted that the expansion will power next-generation AI workloads, machine-learning services, and global cloud capacity. The investment also deepens Amazon’s long-term footprint in the southeastern U.S., aligning with rising demand for high-compute environments across industries.
This move follows a broader trend of hyperscale cloud providers accelerating infrastructure spending to compete for AI-focused enterprise customers. With AWS already serving as the global leader in cloud services, the investment signals Amazon’s intention to maintain a technological and commercial edge amid intensifying competition from Microsoft Azure and Google Cloud.
Technical analysis:
Price is pulling back from heavy resistance at $258 and correcting toward the ascending trendline support. This level acts as a significant weekly demand area and aligns with the broader structure guiding the uptrend.
A strong bullish reaction from the trendline would likely set up another retest of the $258 highs. A clean break above that zone opens the door toward $280–$300, supported by long-term Fibonacci projections and sustained strength in AWS earnings.
If the trendline level breaks, the next key support sits at the horizontal support that has carried Amazon’s stock since early 2021. Overall, the setup remains bullish as long as price holds above the trendline.
Is Amazon exploding again? New weekly demand in controlIs Amazon exploding again? New weekly demand in control at $224. Expecting a decent rally from here in the following days.
Amazon, Microsoft&the Digital Markets Act: Brussels Sets a RadarAmazon, Microsoft and the Digital Markets Act: Brussels Sets Its Radar on the Cloud
Ion Jauregui – Analyst at ActivTrades
The European Commission has opened three formal investigations into Amazon (NASDAQ: AMZN) and Microsoft (NASDAQ: MSFT) under the regulatory framework of the Digital Markets Act (DMA). The goal is to determine whether their cloud services should be classified as “gatekeepers” and whether their business practices are restricting competition in a sector overwhelmingly dominated by U.S. tech giants.
The investigation comes at a crucial moment. The cloud computing market is growing at double-digit rates and has become a cornerstone of the European digital ecosystem. The Commission argues that the sector is evolving so quickly that the DMA itself may need to be updated to avoid falling behind technologically.
Microsoft has stated it will fully cooperate, while Amazon Web Services warns that excessive regulation could “slow innovation” and raise costs for European businesses. Behind the scenes, the tension also has a political tone: with Trump pushing to protect U.S. Big Tech, Brussels is keen to flex its regulatory muscle. A resolution is expected within 12 months, although deadlines in Brussels often tend to slip.
Fundamental Analysis: Amazon and Microsoft Under Regulatory Scrutiny
Both companies rely heavily on the cloud segment for their growth.
AWS accounts for roughly 60–70% of Amazon’s operating profit, which means any regulatory barriers in Europe—however limited—create market sensitivity.
In Microsoft’s case, Azure continues to expand its market share, driven by the integration of generative AI and enterprise services. The key question is whether Brussels considers that Microsoft’s ecosystem —Windows + Office + Azure— creates a structural advantage that restricts competitors.
Despite rising regulatory risks, fundamentals remain solid: cloud revenue growth, strong operating margins, and structural expansion driven by artificial intelligence.
Technical Analysis of Amazon (AMZN)
On the daily chart, AMZN is trading sideways following the correction seen in November. Wednesday’s session closed at $222.69, a level aligned with the volume Point of Control (POC), which serves as a structural reference for the current range.
For much of the year, price action has fluctuated between $234 and $216, with a notable annual high reached on 3 November at $258.60, and an annual low at $178.85 recorded in May. At present, the price remains below the 50- and 100-day moving averages, while finding initial support above the 200-day moving average, which acts as an important dynamic support zone.
Technical indicators also reflect the corrective phase:
The RSI stands at 40.63, close to its support area, leaving room for a potential technical rebound if demand appears.
The MACD maintains a downward slope, confirming the short-term bearish momentum.
A sustained close above the 50- and 100-day moving averages would be the first technical sign of recovery, opening the door for a move back toward the $234 area and eventually another attempt to retest the annual highs around $258.
On the downside, if bearish pressure continues, the price could move again toward $216, a key support within the six-month range. A clear break below this level would expose the $202 zone, which aligns with the last major bullish impulse of the semester.
According to the ActivTrades US Market Pulse, overall market risk remains neutral following recent corrections. If Amazon continues to deliver strong results in cloud revenue and growth, it is reasonable to expect that—despite EU regulatory pressure—the stock could continue developing a positive organic trend as long as the key levels of the current range hold.
*******************************************************************************************
The information provided does not constitute investment research. The material has not been prepared in accordance with the legal requirements designed to promote the independence of investment research and such should be considered a marketing communication.
All information has been prepared by ActivTrades ("AT"). The information does not contain a record of AT's prices, or an offer of or solicitation for a transaction in any financial instrument. No representation or warranty is given as to the accuracy or completeness of this information.
Any material provided does not have regard to the specific investment objective and financial situation of any person who may receive it. Past performance and forecasting are not a synonym of a reliable indicator of future performance. AT provides an execution-only service. Consequently, any person acting on the information provided does so at their own risk. Political risk is unpredictable. Central bank actions can vary. Platform tools do not guarantee success.

Amazon (AMZN) Shares PlungeAmazon (AMZN) Shares Plunge
As the chart shows, Amazon (AMZN) shares fell to around $222 yesterday, despite trading above $255 at the start of the month.
The price drop is the result of several factors, including:
→ A rating downgrade from Rothschild & Co. Redburn (to “Neutral”). Analysts doubt that Amazon’s massive investments in artificial intelligence will pay off as quickly as its earlier spending on cloud technologies once did.
→ Pressure from the Federal Trade Commission (FTC). A court hearing on accusations that Amazon engaged in anti-competitive practices and overcharged US households (by more than $1bn) has been officially scheduled for February 2027.
Technical Analysis of Amazon (AMZN)
Reviewing the chart from 3 November (when the price climbed above $250 following a strong earnings report), we:
→ used the fluctuations in AMZN’s share price to outline an ascending channel (shown in blue);
→ suggested that the initial reaction to the report might have been overly optimistic and pointed to a potential corrective move.
However, the subsequent decline of more than 13% from the November peak appears too deep to be considered a mere correction – the price is now below where it stood before the report was released. It is reasonable to assume that the surge in AMZN above the psychological $250 level on strong news was used to lock in profits from large long positions, and that market sentiment has since shifted dramatically.
Nevertheless, in the short term, AMZN traders may look for a rebound from the lower boundary of the channel. In the longer run, a bearish breakout from the current channel should not be ruled out – especially if news flow around AI takes a gloomier turn. Today, all eyes are on Nvidia’s (NVDA) earnings report.
This article represents the opinion of the Companies operating under the FXOpen brand only. It is not to be construed as an offer, solicitation, or recommendation with respect to products and services provided by the Companies operating under the FXOpen brand, nor is it to be considered financial advice.

AMZN at a Critical Turning PointThe chart shows a large Cup & Handle formation, with the neckline marked by the black horizontal resistance. Recently, AMZN broke above this neckline but failed to hold, pulling back to retest the breakout zone.
Right now, price is sitting exactly on a major decision area where:
• The neckline
• The rising purple trendline
• And the 50-day moving average
all converge.
This zone will determine whether AMZN resumes its uptrend or confirms a failed breakout.
Bullish Scenario
If AMZN holds above the $220–$225 support and forms a bullish reversal candle, the uptrend can continue.
Upside Targets
1. $240 – Near-term resistance
2. $255 – Classic Cup & Handle target
3. $265–$270 – Full measured move of the pattern
Stop Loss (for bullish setup)
Below $216
(break of the rising trendline + failure of the pattern)
Bearish Scenario
If price closes below $216, it confirms:
• A failed breakout
• A break of the rising trendline
• Start of a deeper correction
Downside Targets
1. $205 – First support
2. $190 – Strong support zone
3. $173–$175 – Major long-term support
Stop Loss (for bearish setup)
Above $230
Summary
AMZN is at a major inflection point.
Holding above the trendline could trigger a strong continuation rally, but losing this level opens the door to a deeper correction.
This is one of the most important zones to watch for Amazon in the coming weeks.

1 HR AMZN Target Area (Green Box)
To the upper right is a green rectangle labeled “TARGET”.
The dotted diagonal green line projects price from the bottom low up into this box.
This represents the bullish target if the reversal continues.
Failed Target Marker
Below the price, far down, there is a dotted yellow label “TARGET FAILED”.
This marks the lower threshold—if price drops there, the bullish pattern is invalid.

Amazon Raises $15B for AI Expansion — Stock at Key Support ZoneAmazon has launched its first US dollar bond sale since 2022, securing $15 billion to accelerate investments in AI infrastructure. Demand was massive, reaching $80 billion, signaling strong investor confidence in Amazon’s long-term growth story. The funds will support capital expenditures, acquisitions, data-center expansion, and upcoming debt maturities.
This move aligns with a broader trend among tech giants aggressively raising capital to scale AI systems. Meta issued $30 billion earlier, Alphabet raised $25 billion, and Oracle sold $18 billion in September. The surge in funding reflects the rising cost of advanced chips, cloud infrastructure, and high-capacity data centers needed to stay competitive in the AI race.
Amazon, the world’s largest cloud provider through AWS, is increasingly focused on high-performance computing and generative AI models. The new capital gives Amazon more room to expand capacity, boost margins through automation, and strengthen its competitive edge in enterprise AI services.
Amazon’s stock (AMZN) is pulling back from the $258 resistance, forming a corrective move toward a key support area around $232. This level aligns with the structure seen on the weekly chart and acts as a short-term demand zone. A strong bullish reaction here would likely set the stage for a retest of the $258 high, followed by a potential breakout if momentum returns.
If $232 fails to hold, the next major support sits at the ascending trendline zone, which has guided Amazon’s uptrend since early 2023. A deeper correction remains possible, but the broader structure is still bullish as long as price holds above the trendline.
The RSI is cooling off, suggesting the correction is healthy rather than a trend reversal. If Amazon bounces from support, the next major upside target sits between $280 and $300, aligning with long-term Fibonacci extensions.
