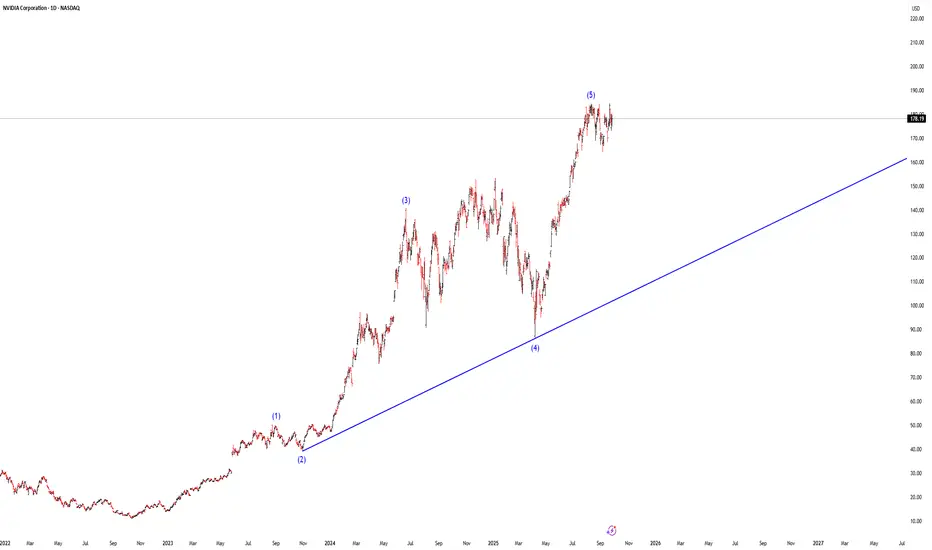
Nvidia - The next rally of +33% started!🚀Nvidia ( NASDAQ:NVDA ) just broke out:
🔎Analysis summary:
Over the past couple of months, Nvidia has been rallying an expected +100%. However, just objectively looking at the chart, this rally is not over yet. After the confirmed all time high breakout, Nvidia can rally another +33% until it will retest a substantial resistance level.
📝Levels to watch:
$250
SwingTraderPhil
SwingTrading.Simplified. | Investing.Simplified. | #LONGTERMVISION
NVDA trade ideas

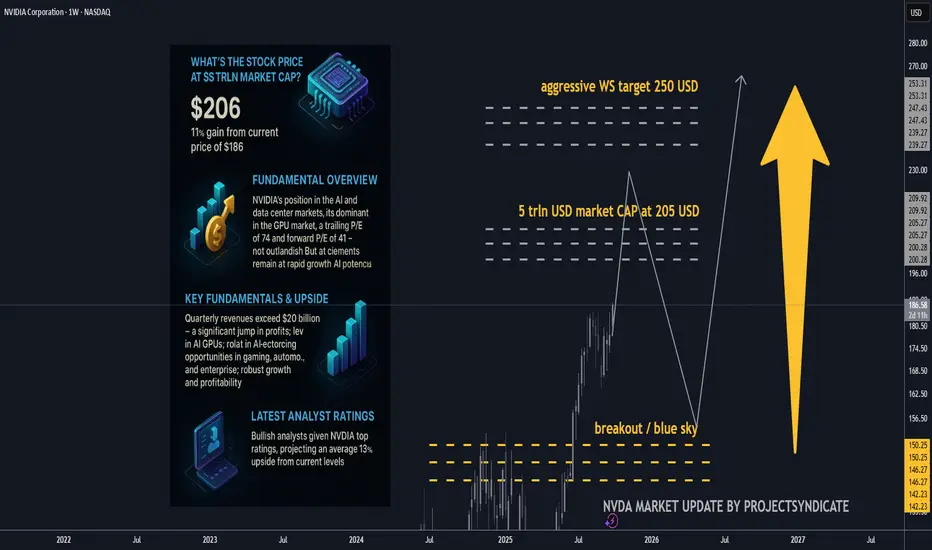
NVDA 5 trln USD market cap up next? Key fundamentals and upside.Is $5T reasonable for NVDA?
• Mechanically, yes: The market only needs ~10% near-term appreciation from today’s levels to print $5T. That’s within one strong quarter or a guidance beat.
• Fundamentally, the math works if (a) FY26–27 revenue tracks the guide/Street trajectory (TTM already $165B with Q3 guide $54B), (b) non-GAAP GMs hover low-to-mid-70s, and (c) opex discipline holds. Under those, forward EPS path supports ~35× at $5T, a premium but not outlandish for a category-defining compute platform.
• Free-cash optionality: With ~$48B net cash and massive FCF, NVDA can keep funding buybacks (already $60B fresh authorization) and capacity, smoothing cycles.
________________________________________
• Stock price at $5T market cap: ≈ $205.8 per share (on ~24.3B shares).
• Gain needed from $186.6: +$19.2 (~+10.3%).
The quick math (market cap ⇒ price)
• Shares outstanding (basic): ~24.3 B (as of Aug 22, 2025, per 10-Q).
• Stock @ $5T market cap: $5,000,000,000,000 ÷ 24.3B ≈ $205.8/share.
• From today’s price $186.6: needs +$19.2 or ~+10.3%.
That also implies P/E (TTM) at $5T of roughly ~56× (using TTM EPS ~3.68). Today’s trailing P/E is ~50–53× depending on feed.
________________________________________
Core fundamentals snapshot 🧩
Latest quarter (Q2 FY26, reported Aug 27, 2025)
• Revenue: $46.7B (+56% y/y; +6% q/q).
• Data Center revenue: $41.1B (+56% y/y).
• GAAP gross margin: 72.4%; non-GAAP 72.7%; Q3 guide ~73.3–73.5%.
• GAAP EPS: $1.08 (non-GAAP: $1.05; excl. $180M inventory release: $1.04).
TTM scale & profitability
• Revenue (TTM): ~$165.2B.
• Net income (TTM): ~$86.6B.
• Diluted EPS (TTM): ~$3.5–3.7.
• Cash & marketable securities: $56.8B; debt: ~$8.5–10.6B ⇒ net cash ≈ $48B.
Capital returns
• $24.3B returned in 1H FY26; new $60B buyback authorization (no expiration). Remaining buyback capacity ~$71B as of Aug 26.
________________________________________
Valuation read (today vs. $5T)
Using widely watched metrics:
• P/E (TTM): ~50–53× today; at $5T it rises to ~56× (assuming flat TTM EPS).
• Forward P/E: Street FY27 EPS ≈ $5.91 → ~31–33× today; ~35× at $5T — still below many AI hyper-growth narratives that trade at 40–50× forward when growth visibility is high.
• EV/EBITDA (TTM): EV ≈ market cap – net cash. Today EV ~$4.45T; EBITDA TTM ≈ $98–103B ⇒ EV/EBITDA ~43–45×; at $5T EV/EBITDA drifts to ~48–50×.
• P/S (TTM): ~27× today (at $4.5T) and ~30× at $5T on $165.2B TTM revenue.
• FCF yield: TTM FCF range $60.9–72.0B ⇒ ~1.35–1.60% today; ~1.22–1.44% at $5T.
Takeaway: $5T doesn’t require a heroic repricing — it’s ~10% above spot and implies ~35× forward earnings if consensus holds. That’s rich vs. the S&P (~22.5× forward) but arguably reasonable given NVDA’s growth, margins, and quasi-platform status in AI compute.
________________________________________
What must be true to justify $5T (and beyond) ✅
1. AI capex “supercycle” persists/expands. Citi now models $490B hyperscaler AI capex in 2026 (up from $420B) and trillions through 2029–30. A sustained 40–50% NVDA wallet share across compute+networking underwrites revenue momentum and margin sustainment.
2. Annual product cadence holds. Blackwell today → Rubin in 2026 with higher power & bandwidth, widening the perf gap vs. AMD MI450 — supports pricing power and mix.
3. Margins stay “mid-70s” non-GAAP. Company guides ~73.3–73.5% near term; sustaining 70%+ through transitions offsets any unit price compression.
4. Networking, software & systems scale. NVLink/Spectrum, NVL systems and CUDA/Enterprise subscriptions deepen the moat and smooth cyclicality; attach expands TAM (improves EV/EBITDA vs. pure-GPU lens).
5. China/export workarounds do not derail mix. Q2 had no H20 China sales; guidance and commentary frame this as manageable with non-China demand and limited H20 redirection.
________________________________________
A contrarian check (where the model could break) 🧨
• Power & grid bottlenecks. Even bulls (Citi) note AI buildouts imply tens of GW of incremental power; slippage in datacenter electrification can defer GPU racks, elongating deployments (and revenue recognition).
• Debt-funded AI spend. Rising share of AI DC capex is being levered (Oracle’s $18B bonds; neoclouds borrowing against NVDA GPUs). If credit windows tighten, orders could wobble.
• Customer consolidation & vertical ASICs. Hyperscalers iterating custom silicon could cap NVDA’s mix/price in some workloads; edge inference may fragment.
• China policy volatility. Export rules already forced product pivots; rebounds are uncertain and not fully in NVDA’s control.
• Multiple risk. At ~50× TTM and >40× EV/EBITDA, any growth decel (unit or pricing) can de-rate the multiple faster than earnings make up the gap.
Bottom line of the bear case: If AI capex normalizes faster (say +10–15% CAGR instead of +25–35%), forward EPS still grows, but the stock would likely need multiple compression (toward ~25–30× forward), making $5T less sticky near-term.
________________________________________
Street positioning (latest bullish calls) 📣
• KeyBanc: $250 (Overweight) — Rubin cycle deepens moat → ~+34% implied upside.
• Barclays: $240 (Overweight) — AI infra wave; higher multiple to 35×. ~+29% upside.
• Bank of America: $235 (Buy). ~+26% upside.
• Bernstein: $225 (Outperform). ~+21% upside.
• Citi: $210 (Buy) — reiterates annual cadence & rising AI capex.
• Morgan Stanley: $206–210 (Overweight). ~+11–13% upside; 33× CY25 EPS framework.
• Consensus: Avg 12-mo PT ~$211, ~+13% from here.
________________________________________
________________________________________
Extra color you can trade on 🎯
• Where bulls may be too conservative:
o Networking/NVLink attach could outgrow GPUs as Blackwell/Rubin systems standardize on NVIDIA fabric, defending blended margins longer.
o Software monetization (CUDA ecosystem, NIMs, enterprise inference toolchains) is still under-modeled in many sell-side DCFs.
• Where bulls may be too aggressive:
o China rebound timing & magnitude.
o Power/real-estate constraints delaying deployments into 2026.
o Credit-driven AI capex — watch for any signs of tightening in private credit / neocloud financing that uses GPUs as collateral.
________________________________________
________________________________________
Sources: NVIDIA IR & 10-Q; Yahoo Finance stats; StockAnalysis (TTM financials); company Q2 FY26 press release and CFO commentary; recent analyst notes from KeyBanc, Citi, Barclays, BofA, Morgan Stanley; financial media coverage (WSJ/FT).
NVDA: Potential Long Opportunity at Key Support LevelHello, fellow traders.
This analysis looks at a potential bullish setup on the 15-minute chart for NVIDIA (NVDA).
A key horizontal level has been identified around the $175.24 mark. As seen on the chart, this price has acted as a significant area of both support and resistance in recent trading sessions, indicating its importance to the market.
The price has recently pulled back to this level and appears to be holding, suggesting that it is currently acting as strong support. This bounce from a critical level could present a potential buying opportunity.
Here is a breakdown of the trade idea illustrated on the chart:
Entry: A long position is considered around the current price of $178.19.
Stop Loss: The stop loss is placed at approximately $172.22. This is set below the key support line and the recent swing lows, aiming to protect against a false breakout to the downside.
Take Profit: The target for this trade is set at $191.00, aiming for a significant move higher.
This setup offers a favorable risk-to-reward ratio. The trade thesis is valid as long as the price remains above the key support zone around $175.24. A firm break below this level would invalidate this bullish idea.
Disclaimer: This is a technical analysis idea for educational and discussion purposes only. It does not constitute financial or investment advice. Always conduct your own research and risk management before entering any trade.

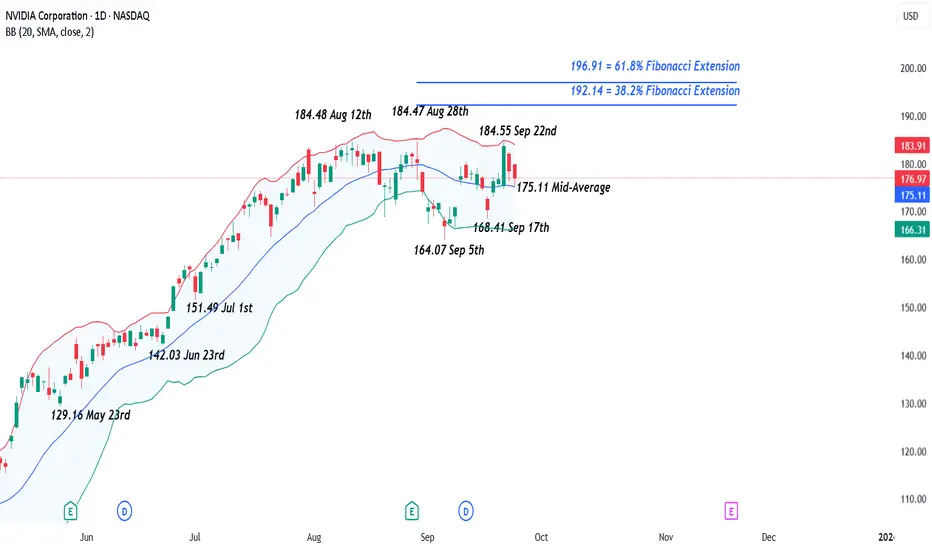
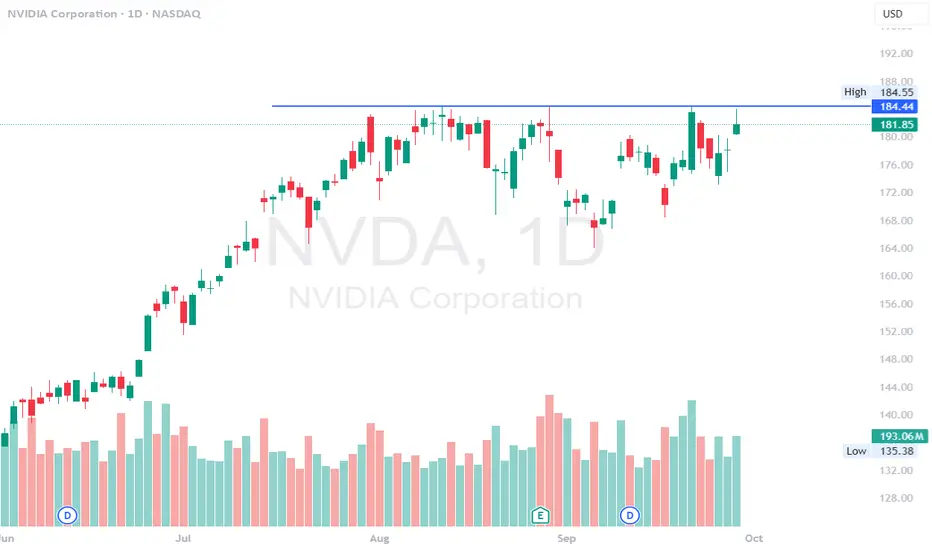
NVIDIA – Bumping Up Against Record HighsNVIDIA’s share price is experiencing an interesting run into the end of September as traders try and work out whether it can extend its run of gains through all time highs sitting just above the 184 level (184.55 Sept 22nd), a line in the sand that has capped the upside since the start of August (more on this in the technical update below).
With NVIDIA being the biggest company in the world by market capitalisation, currently sitting at a huge $4.34 trillion (No.2 Microsoft, $3.79 trillion), and it being the bellwether for AI performance, it’s not short of news flow to create periods of volatility.
Only on Monday, the company announced a $100 billion link up with Open AI to build new data centres and expand AI infrastructure together, which sent its stock price up 4% towards that 184 resistance, only for Federal Reserve Chairman Jerome Powell in a speech on Tuesday to send it back lower again as investors banked profits, when he offered a more cautious outlook towards future Fed rate cuts into the end of the year.
Looking into the end of the week, the focus may be on US economic data again, with the release of the final US Q2 GDP reading at 1330 BST today, and perhaps more importantly, the PCE index, which is the Fed’s preferred inflation gauge, due tomorrow at 1330 BST. Traders seem to be very sensitive to these inflation readings, given that they could determine whether the Fed is able to cut interest rates again before the end of 2025. Any deviation from expectations, to the up or downside could have an outsized impact on sentiment towards the NVIDIA stock price into the Friday close.
Technical Update: Watching Record Highs
Since reaching its 184.48 high on August 12th, NVIDIA has twice attempted to break and close above this resistance, on August 28th and September 22nd. The latest attempt did set a new intraday high of 184.55, but as the chart below shows, resistance held again by the close, triggering another sell-off from that level.
This price action confirms the 184.48/184.55 range as a potentially key resistance area. A successful close above it could lead to a further phase of price strength.
While not a guarantee of continued upside, a closing break above 184.48/184.55 could open the path to 192.14, a level equal to the 38.2% Fibonacci extension. If this level were to also give way on a closing basis, the next resistance may prove to be 196.91, which is the higher 61.8% extension.
Of course, with resistance at 184.48/184.55 still capping price strength, there's also the risk that support levels could give way, possibly suggesting further downside in price activity.
Initial support may now be marked by 175.11, the Bollinger mid-average, which is currently containing the latest pullback in price. While a close below here may not confirm extended price weakness, it might open the door to test lower supports at 168.41, which is the September 17th low, possibly even 164.07, a level equal to the September 5th extreme.
The material provided here has not been prepared accordance with legal requirements designed to promote the independence of investment research and as such is considered to be a marketing communication. Whilst it is not subject to any prohibition on dealing ahead of the dissemination of investment research, we will not seek to take any advantage before providing it to our clients.
Pepperstone doesn’t represent that the material provided here is accurate, current or complete, and therefore shouldn’t be relied upon as such. The information, whether from a third party or not, isn’t to be considered as a recommendation; or an offer to buy or sell; or the solicitation of an offer to buy or sell any security, financial product or instrument; or to participate in any particular trading strategy. It does not take into account readers’ financial situation or investment objectives. We advise any readers of this content to seek their own advice. Without the approval of Pepperstone, reproduction or redistribution of this information isn’t permitted.
Bullish Momentum Builds as Nvidia Exits Consolidation Phase🚀 Nvidia Nears Breakout: Strong uptrend with volume profile support. Consolidation phase close to completion. Entry $172.95 | SL $167 | TP $255.65 → Attractive risk/reward setup for continuation higher. Let the bulls do their work — update to follow.
⚠️ Not financial advice.
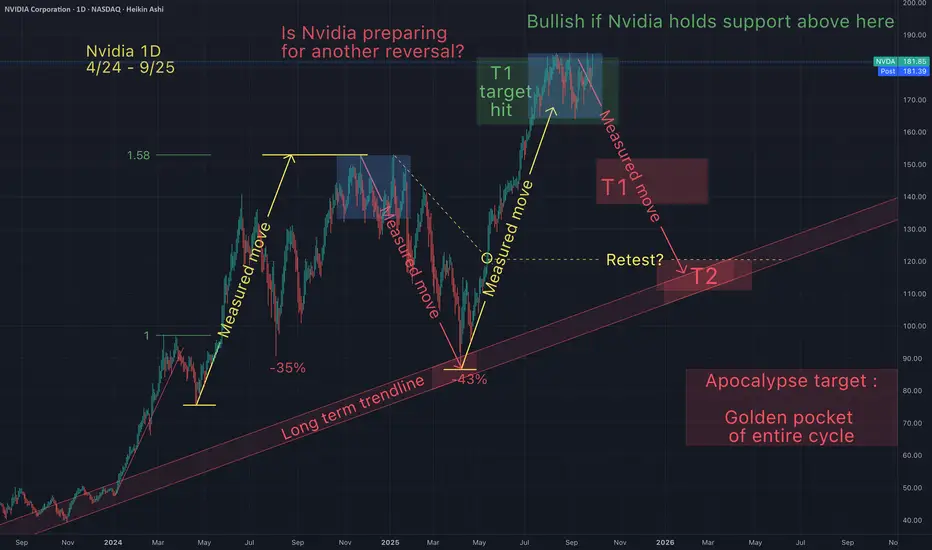
Is Nvidia preparing for another reversal?Is Nvidia preparing for another reversal? It would makes sense at this level. Could it continue up from here? Of course! But I only buy when it's red and retracing. I never jump on a moving train, so lets hope this train slows down so we can jump back in.
May the trends be with you.
NVDA Is Setup to Break New All-time Highs2025-09-26: NVDA Bullish Setup is Ready
1). Higher Lows Thursday ($173.13), Friday ($174.93). Will be perfect setup if next Monday close higher than $174.93.
2). Today vs Startup date Volume 23% Decrease 09-18: 191.76M vs 09-26 148.47M
3). Support Doji (Lower wig longer)
4). Close above all Moving Averages
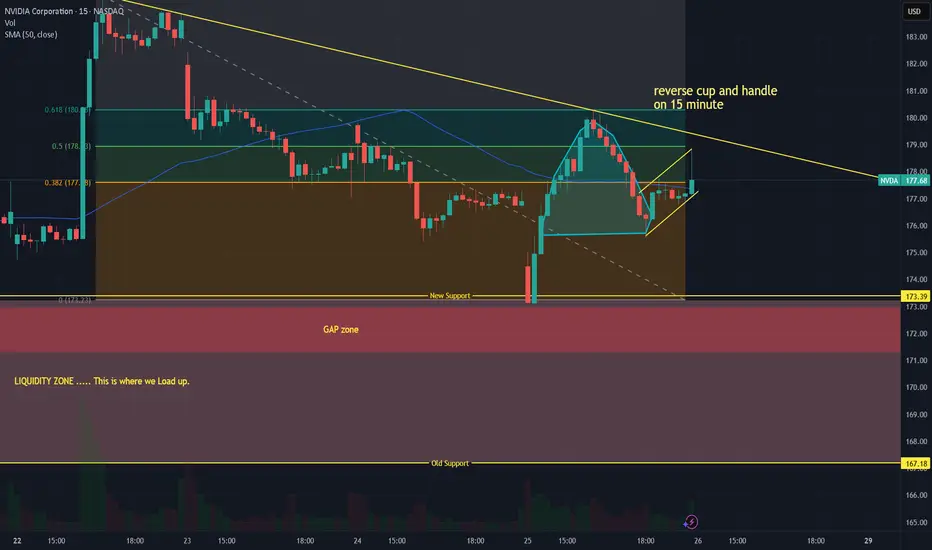
$NVDA Reverse cup and handle on 15 & 45 m...After a brutal day today in the Market. I am seeing a reverse cup and handle form on the 15- and 45-minute frames. There is huge Gap that has yet to be filled in the Liquidity zone at 172 & 171.
It would need to touch or break below $171 in order to close the Gap.
Personally, I would wait for that Gap to close and load up on Call options in Call Debit Spread for those who can't afford call premiums. THIS IS NOT FINANCIAL ADVICE.
I think if closes red tomorrow we could potentially see a Gap down next week Monday. Fib Retracement shows that it will duck down below. Potentially will see another red day tomorrow into next week.
AS ALWAYS THIS IS NOT FINANCIAL ADVICE, I AM A SELF-TAUGHT MARKET ANALYST THIS IS MY OPINION. GODBLESS YOU ALL, JESUS LOVES YOU.
NVDA NVIDIA Corporation Options Ahead of EarningsIf you haven`t bought NVDA before the previous earnings:
Now analyzing the options chain and the chart patterns of NVDA NVIDIA Corporation prior to the earnings report this week,
I would consider purchasing the 150usd strike price Calls with
an expiration date of 2025-9-19,
for a premium of approximately $13.35.
If these options prove to be profitable prior to the earnings release, I would sell at least half of them.

Nvidia - Starting a clear +20% rally!🧲Nvidia ( NASDAQ:NVDA ) rallies higher now:
🔎Analysis summary:
About one decade ago, Nvidia broke out of a major bullish triangle pattern. Following this remarkable breakout, Nvidia continued with a rally of about +35.000%. But looking at all these previous cycles, Nvidia remains bullish with another potential +20% move towards the upside.
📝Levels to watch:
$200, $250
SwingTraderPhil
SwingTrading.Simplified. | Investing.Simplified. | #LONGTERMVISION

$NVDA - $200 incoming if $185 breaksNVDA - Stock making another failed attempt to break all time highs. Stock could hit possible $200 if that level breaks. calls above $185 looking good here. Stock is decent at the indicator level.
NVDA Ready for Takeoff: $200 Target in Sight!
Based on the daily chart of NVIDIA (NVDA) on NASDAQ, here’s a breakdown:
🔎 Technical Analysis
Overall Trend
The stock is in a strong uptrend (rallying from around $120 to the current $186).
Higher lows are forming, and price is pressing against the 185–187 resistance zone, showing strong buying pressure.
Key Resistance
185–187 USD is a critical resistance zone tested multiple times.
Given the strong daily candle and volume, the probability of a breakout is high.
Short-Term Support
Uptrend line provides support around 176–178 USD.
Next key support sits near 170 USD.
🎯 Short-Term Outlook (1–4 Weeks)
Entry Trigger: After a confirmed breakout above $187
Target 1: $195
Target 2: $200
Stop-Loss: Close below $178
🌐 Long-Term Outlook (3–6 Months)
Sustained breakout above $187 could lead to a new bullish phase.
Target 1: $210
Target 2: $225
Stop-Loss: Break below $170
✅ Summary
NVIDIA is on the verge of breaking a major resistance level. A cautious entry above $187 may offer attractive upside potential. Risk of a false breakout exists, so stop-loss discipline is crucial.

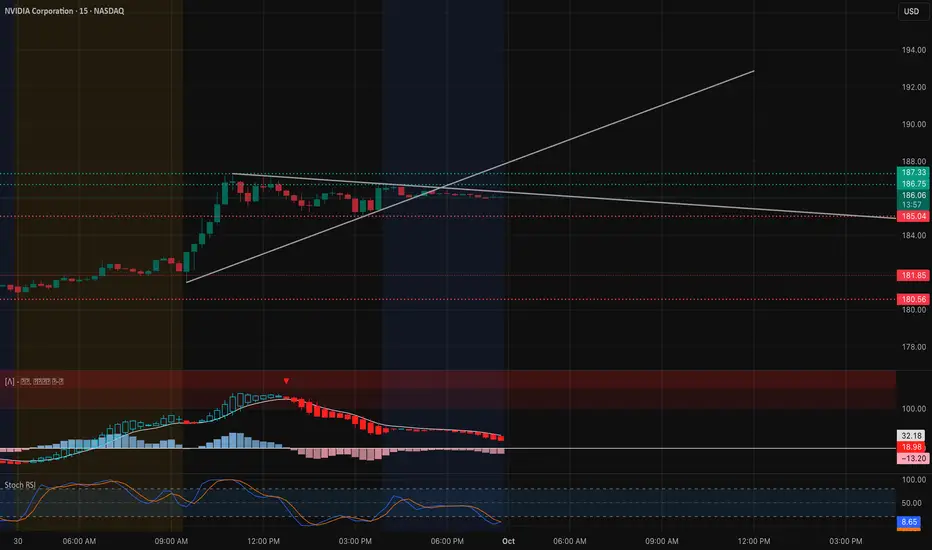
NVDA Oct. 1 – Knocking on the Door of a Breakout! Intraday View (15-Min Chart)
NVDA ripped higher early but is consolidating around $186 into the close. Price is riding the intraday trendline, though momentum is fading.
* Support Levels: $185.00, $181.85, $180.56
* Resistance Levels: $186.75, $187.33, $188.00
* Indicators: MACD is losing steam with red bars extending. Stoch RSI is buried at lows, showing possible oversold conditions.
📌 Intraday Thought (Oct. 1): If $185 holds, NVDA could bounce back toward $187–$188. A break below $185 risks a flush to $182 and possibly $181.5. Scalpers can lean long on $185 support with tight risk, or fade near $187.5 if momentum stalls.
Options & Swing View (1H + GEX)
Gamma positioning shows a clear setup:
* Call walls: Big resistance at $187.5–$190, with stacked GEX above.
* Put support: Clustered near $175–$170, with a hard floor around $170.
This implies NVDA is pinned between $185–$190 short term. A confirmed break over $187.5 opens upside momentum toward $190–$195, while losing $185 risks a retrace back to $182 → $175 zone.
* Bullish Play (Oct. 1): Calls or debit spreads targeting $190–$195 if $187.5 breaks on volume.
* Bearish Hedge: Short puts toward $182 → $175 if $185 fails.
* Neutral Play: Iron condor between $175–$190 for premium capture while NVDA consolidates.
My Thoughts (Oct. 1)
NVDA is pressing right into a breakout zone. The tape favors bulls as long as $185 holds, but momentum is clearly cooling on intraday charts. I’d treat $187.5 as the trigger line: over it, we could squeeze to $190+ quickly. Below $185, downside opens fast toward $182. Flexibility is key here—trade the levels, not the noise.
Disclaimer: This analysis is for educational purposes only and does not constitute financial advice. Always do your own research and manage risk before trading.
H&S on NVDA pullback immenentShort post:
Drawdown to 124$ levels is most likely and probably happens by end of Oct.

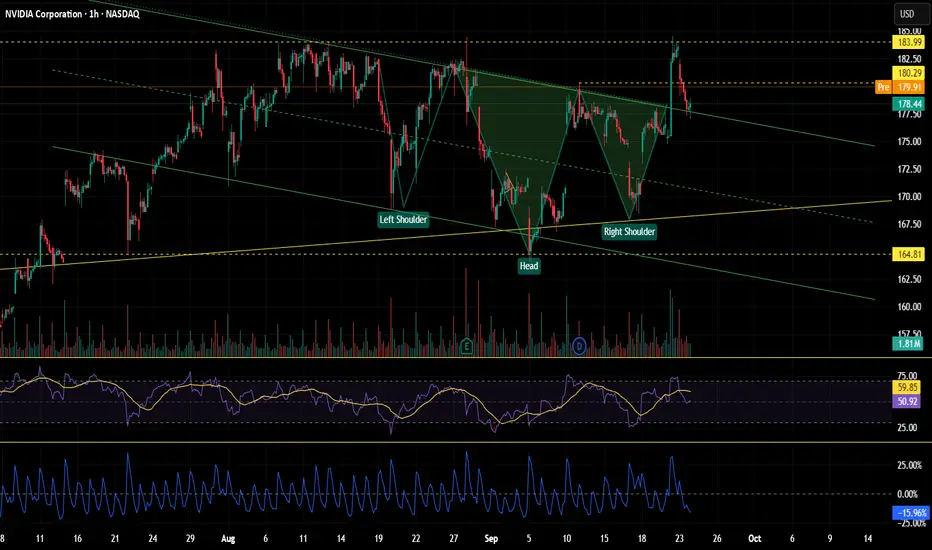
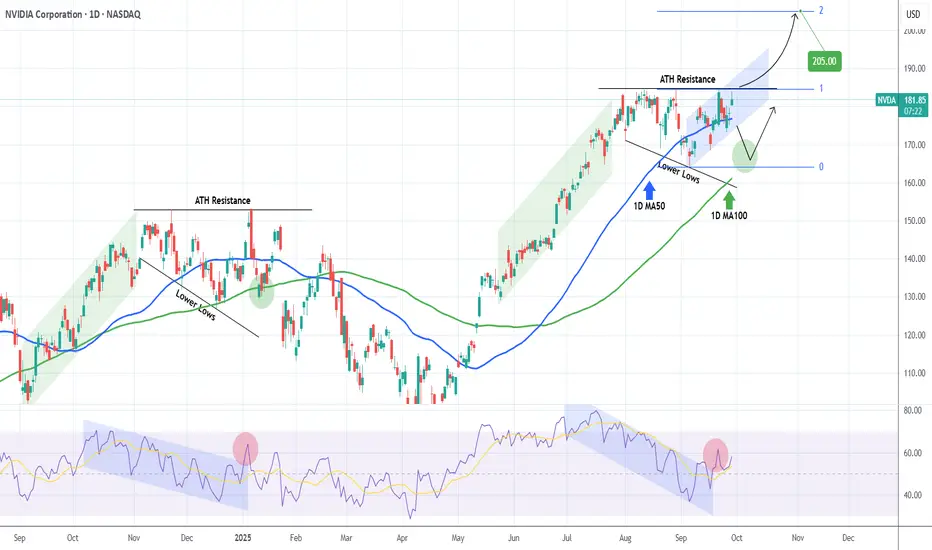
NVIDIA Will it finally make a new ATH?NVIDIA Corporation (NVDA) almost hit today its All Time High (ATH), which is currently its Resistance level. That is technically the top of a Descending Triangle pattern that the stock has been trading in since the start of August.
The last time we saw a similar pattern was during NVDA's previous ATH formation in November 2024 - January 2025. Identical price actions as well as 1D RSI sequences among the two fractals.
Based on that, we should be past a January 07 2025 ATH Resistance rejection, which targeted the 1D MA100 (green trend-line) before the next bounce. As a result, until the current ATH Resistance breaks, we should technically see a pull-back towards $166/67.
This time however, there is a strong case for a ATH break-out as the price is trading within a short-term (blue) Channel Up. As long as this holds, it can keep making Higher Highs, with the next one technically aiming above the ATH Resistance.
In any case, if that level breaks, we expect the price to target the 2.0 Fibonacci extension at just above $200.
-------------------------------------------------------------------------------
** Please LIKE 👍, FOLLOW ✅, SHARE 🙌 and COMMENT ✍ if you enjoy this idea! Also share your ideas and charts in the comments section below! This is best way to keep it relevant, support us, keep the content here free and allow the idea to reach as many people as possible. **
-------------------------------------------------------------------------------
💸💸💸💸💸💸
👇 👇 👇 👇 👇 👇
NVDA weekly chart reverse head and shouldersNVDA weekly chart reverse head and shoulders is clearly forming. Looks very bullish. Important to check confirmation of the green candle next Friday. Than a close look to day chart for getting prediction on how far it goes up.
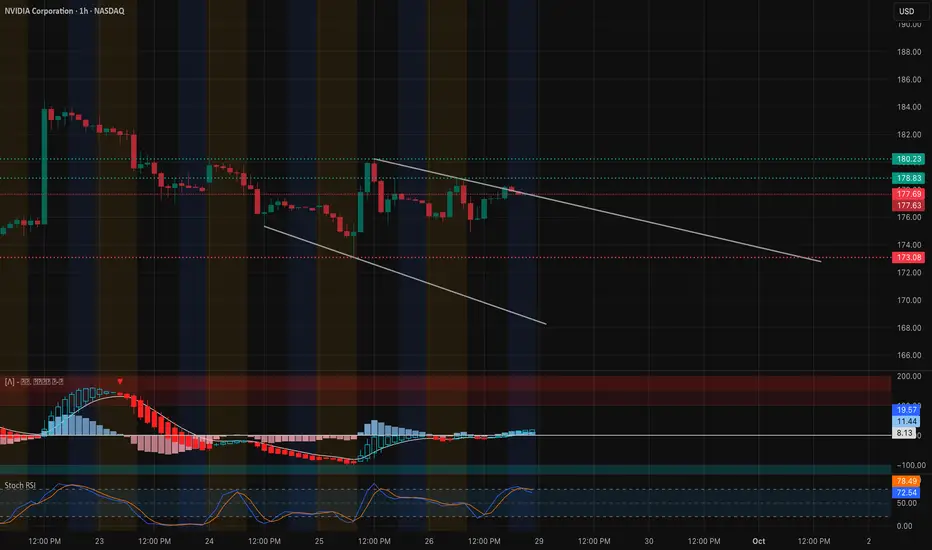
NVDA – Coiling Tight for a Big Move on Gamma Levels . Sep 29NVDA – Coiling Tight for a Big Move as Gamma Levels Draw the Battle Lines ⚡️
1-Hour Technical Outlook
NVIDIA has been grinding inside a narrowing descending channel after its recent selloff, with intraday price now stabilizing around $177–$178. A series of higher lows over the last two sessions hint at basing, but the short-term downtrend line from the $185 zone still caps upside. MACD histogram just turned positive and the Stoch RSI is pointing higher, signaling an early shift in momentum.
Immediate resistance sits at $180.2, followed by the heavy supply zone between $182.5 and $185. Key support levels are $175 (short-term pivot) and $172–$170 (structural demand).
Gamma Exposure (GEX) Confirmation
The options landscape reinforces these technical pivots:
* Major Call Wall / Max positive GEX is stacked at $185, with ~45% of call positioning concentrated there.
* Secondary call concentration: $182.5 (~39% call wall).
* Strong put support: $172.5 and $170, matching the lower trend channel and recent lows.
This setup suggests a gamma squeeze could ignite if NVDA breaks and holds above $180.2, where dealer hedging may accelerate upside toward $182.5–$185. Conversely, a loss of $175 would expose $172 and potentially $170 as downside magnets.
Trade Ideas & Option Plays for This Week
* Bullish Setup: Long above $180.2 with targets at $182.5 and $185. Ideal options: 1-week 180 or 182.5 calls, or 180/185 debit spreads to lower premium.
* Bearish Scenario: Breakdown below $175 opens room to $172 and $170. Traders can look at short-dated puts or vertical spreads such as 175/170.
* With IVR around 5.3 and IVx near 39, premiums are still modest—an advantage for debit spreads.
My Take:
NVDA is in a classic coiling pattern. Momentum oscillators are leaning bullish, but price must clear $180.2 to validate a trend reversal. The gamma map perfectly matches these breakout levels, giving confidence to the setup. Keep a tight stop below $175 if going long, and be ready to flip short if sellers reclaim control.
Disclaimer: This analysis is for educational purposes only and does not constitute financial advice. Always do your own research and manage risk before trading.
NVDA: Undervalued AI Chip Leader Amid #YoungInvestorPortfolio?NVDA: Undervalued AI Chip Leader Amid #YoungInvestorPortfolio? $209 Target in Sight? 🚀
NVDA trades at $178.19 (+1.45%), undervalued with dominant AI GPU demand tying into Reddit young investor buzz on portfolios—analysts forecast average $209 target, 17% upside from robust data center growth, questioning if Blackwell rollout sparks breakout. 📈
**Fundamental Analysis**
EPS $3.51 ttm with revenue $165.218B and 71.55% YoY growth; P/E 52.56 reflects relative undervaluation in high-growth tech, DCF models indicate 15-20% intrinsic premium on AI expansions.
- **Positive:** Leading AI market share; strong cash flow generation.
- **Negative:** High capex demands; supply chain vulnerabilities.
**SWOT Analysis**
**Strengths:** Innovative GPU technology; data center dominance.
**Weaknesses:** Valuation sensitivity to growth slowdowns.
**Opportunities:** Expanding AI adoption; strategic partnerships.
**Threats:** Regulatory scrutiny; intensifying competition.
**Technical Analysis**
Chart in uptrend with strong volume support. Price: $178.19, VWAP $177.
Key indicators:
- RSI: 53 (neutral, upside potential).
- MACD: Positive signal line.
- Moving Averages: Above 50-day $170, 200-day $150 (bullish).
Support/Resistance: $170/$185. Patterns/Momentum: Ascending triangle targeting $200. 📈 Bullish.
**Scenarios and Risk Management**
- **Bullish:** AI demand surge to $200; DCA on pullbacks below $175 for averaged gains.
- **Bearish:** Chip shortages drop to $160.
- **Neutral:** Consolidates at $180 awaiting earnings.
Risk Tips: Stops at 5% below entry, limit to 2% portfolio, diversify tech exposure, DCA to handle volatility. ⚠️
**Conclusion/Outlook**
Bullish if AI trends accelerate. Watch Q3 earnings. Fits tech theme with #YoungInvestorPortfolio upside. Take? Comment!

NVDA buy order
Price sold off at 178.04 the broke out showing that price is bullish the next time price is above 178.04
We see bullish structure (higher highs higher lows)
We see the textbook price action
Indication
Correction
Continuation
Good RR (1:3)
We also have Nvidia wanting to invest $100B into Chatgpt (Bit of fundamentals for ya)

Tops in? or 1 more high left...Yea I think this may have topped or it squeezes out one more cheeky high - regardless it's going to correct hard and fast - expect it to -50% gl.
NVDA HAGIA SOPHIA!The Hagia Sophia pattern has now fully formed; it just needs the crack! and the Hook!
No matter what your vague hunches and feelings are about AI, the charts will always win.
You can't "buy the dip" unless you know when to "Sell the Rip"!
If you can't see this resistance area, I don't know what to tell you.
Everyone is bullish at the top of a bubbliotious market without exception!
Click boost, Like, Subscribe! Let's get to 5,000 followers. ))
NVIDIA – Enormous Pressure After Reaching the Stretch LevelBetween July 31 and August 13, price kept nagging at the white U-MLH,
but there wasn’t enough strength to break through.
From there, price began to drift lower, pressing against the red U-MLH.
The close last Friday failed to break below the red U-MLH –
a clear sign of weakness!
If the green mini-trendline gives way and the white ¼-Line moves above price as well,
NVDA could be ripe for a short setup.
Let’s stalk the trade.
bull flag and inverse head and shoulder breakout retestOn monday 22sept we broke the bullflag/ descending channel and also inverse head and shoulders on the 4hour chart with high volume.
Yesterday we went for a retest of the breakout as expected to 177.6
the 4hours candle closed as a bullish hammer candle.
Todays expectation is nvidia to retest or break its ATH at 184.
If we break 184 today we are lookig at the target of the inverse head and shoulder by end of week wich is 195.
if you look at the rsi ,the rsi is not overbought anymore and made a higher high so no signs of the bears.