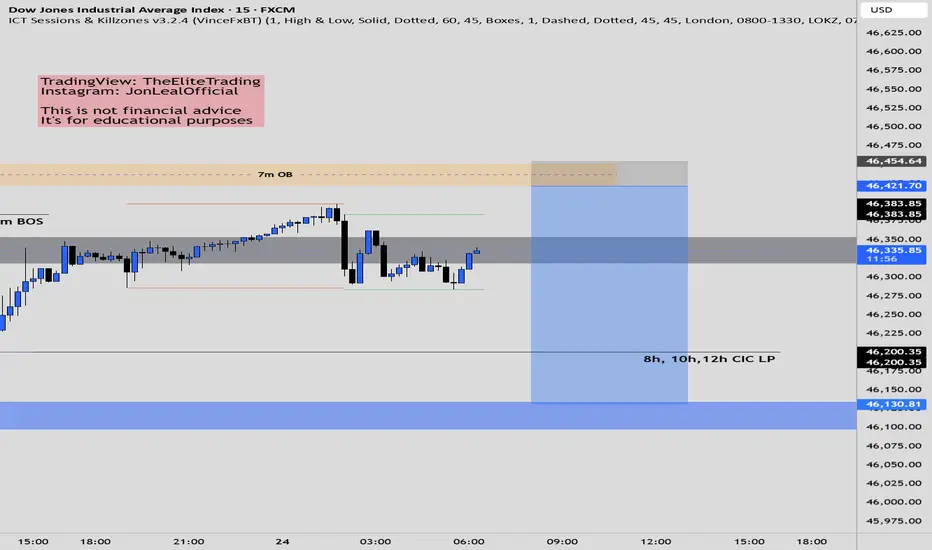
US30 ShortElite Strategy
Waiting price to come tap OB twice to confirm OB to TOB
Execute in smaller time frame
Targeting lower liquidity pools
Main target Structural liquidity
US30 trade ideas
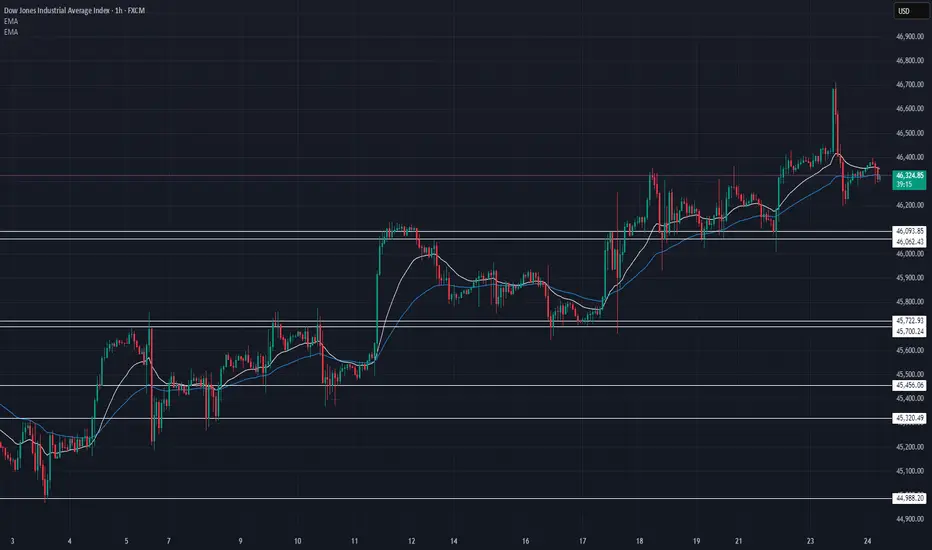
US30 Technical Breakdown – 09/24/2025📍 US30 Technical Breakdown – 09/24/2025
US30 holding steady around 46,320 after yesterday’s push into the 46,700s before pulling back. Market is consolidating but still above key supports, showing buyers remain in control ✅.
📊 Current Market Behavior:
📈 Retest after breakout — healthy pullback
⚡ Buyers defending 46,000 zone strongly
🔄 Consolidation above support → bullish continuation possible
📌 Key Levels:
🔹 Resistance Zones:
46,430 → Immediate resistance
46,700 → Major upside target
47,000 → Next extension if momentum continues
🔹 Support Zones:
46,093 → First key support
45,722 → Strong demand zone
45,456 → Last line of defense for bulls
🧠 Bias:
Bullish ✅
Above 46,000 keeps momentum alive
Break below 45,700 = bearish shift
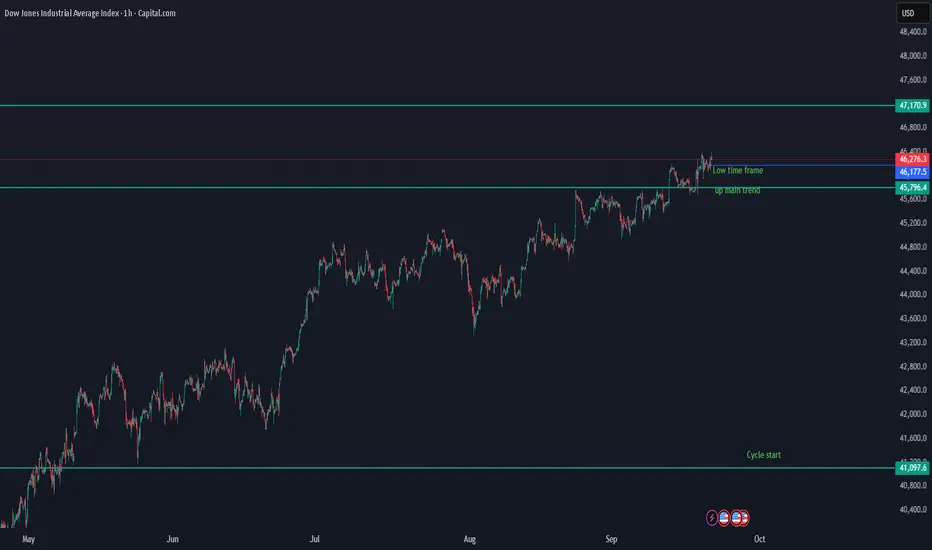
US30 Update On the low time frame, US30 is consolidating aroundUS30 Update
On the low time frame, US30 is consolidating around 46,351 – 46,398 after testing the breakout zone.
Key levels:
46,398 – 46,351 → short-term decision zone. A breakout above this area could confirm bullish continuation toward 47,170.
46,177 – 45,796 → support zone for the main uptrend. As long as price holds above this, the bullish cycle remains intact.
Upside scenario: If price reclaims and holds above 46,398, momentum strengthens for another push higher, with 47,170 as the next major resistance.
Downside risk: If price fails to hold above 46,177, deeper correction could follow, with 45,796 as first support.
Cycle level: 41,097 is the cycle start and a critical must-hold area for the long-term bullish structure.
📌 Summary
Above 46,398 → bullish continuation toward 47,170.
Hold above 46,177 – 45,796 → main uptrend safe.
Break below 45,796 → correction risk, broader weakness possible.
41,097 → cycle start and major long-term support.

23 sep 2025 -day one- results 2SL, 1 BEToday I started journaling my trades and emotions again after a 6-month or much more break. I wasn't in my best mood and couldn't think as well as I usually do.
First entry was a sell on a very bullish market, and I took it because I had patterns for it in my strategy, but usually in strong bull or bearish markets, I trust the market momentum for the first 30 minutes, but today my mind wasn't free enough or strong enough to do it on time, and gave me at least 1 reward.
The second trade was a buy, which gave me a break-even result, and there was nothing wrong with that.
On the third trade, I got emotional and didn't hesitate that for this kind of bull market we may start ranging, and I just entered a buy, but unfortunately, I got stopped out.
And I called it a day with minest 2 reward, and I hope I get it all back. I'm thinking about just trading from Wednesday to Friday, because usually I face losses on the first two days of the week, and maybe I will just trade on Wednesday and Friday. I will make the final decision after two more weeks of journaling.

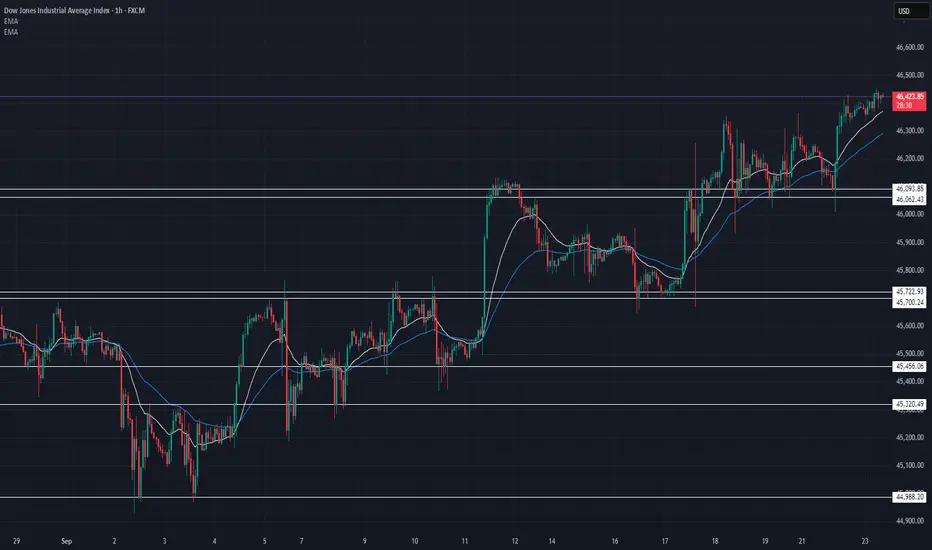
US30 Technical Breakdown – 09/23/2025📍 US30 Technical Breakdown – 09/23/2025
US30 pushing higher again 🚀 Now trading around 46,420, holding strong after reclaiming the 46,000 key level. Buyers are in control as momentum builds.
EMA structure is bullish — dips are being bought, and price is trending upward toward new highs.
📊 Current Market Behavior:
📈 Strong breakout past 46,000
⚡ Higher lows & higher highs forming
🔄 Consolidation breaks leading to expansion
🔥 Momentum still favoring the bulls
📌 Key Levels:
🔹 Resistance Zones:
46,430 → Immediate intraday resistance
46,600 → Next upside target
46,800 → Extension level
🔹 Support Zones:
46,093 → First line of support
45,722 → Strong demand zone
45,456 → Major support floor
🧠 Bias:
Bullish ✅
Above 46,000 = buyers in full control
Only a break below 45,700 shifts bias
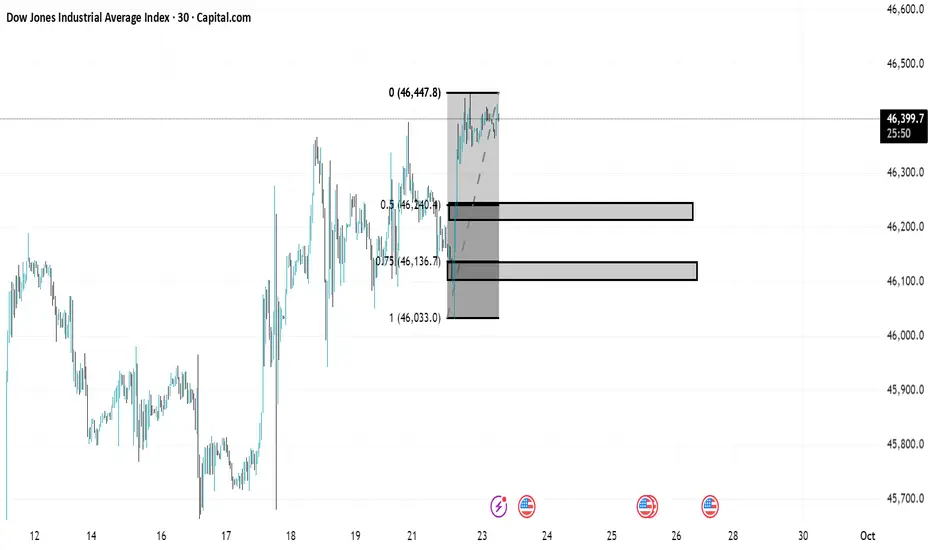
US30 TREND ANALYSISIn US30 there is a clear uptrend important areas are marked as always one is 50 percent area and the other one is 75 percent area .Once the market comeback for retest we will shift to smaller timeframe and look for trendshift after observing everything. When the market again comeback for the retest on smaller timeframe we will look for buy side trade.
important areas
50 percent zone(46245.3)
75 percent zone(46134.3)
bigger timeframe (30 minutes)
smaller timeframe(5 minutes)
US30 Short
Entry 46216.29
SL 46386.27
TP 45962.07
This is a short setup on US30:
The idea is to short at the rejection from the resistance zone / trendline.
Stop loss is placed safely above recent highs (46,386).
Target is near the previous support zone (46,091 → 45,962).
RSI momentum also supports bearish bias after rejection from overbought territory.
Fundamentally, the asset is currently overvalued against the Treasury Bond.
⚠️ Risk Note: US30 is highly volatile. Manage position sizing carefully.

Us30 1500 Pips Securedwww.tradingview.com
price swept SSL/PDL, created 1m IFVG and CISD, retested CISD, targeted BSL to secure 1500 pips!

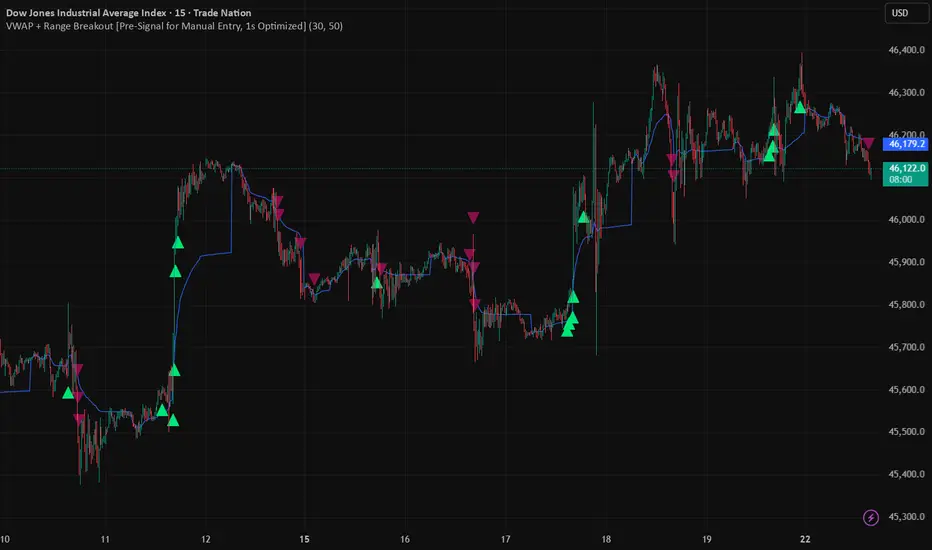
US30 NY Open | VWAP + Range Breakout Signal → Confirmed EntryWHAT THIS SHOWS
This idea highlights early pre-signals and confirmed breakout entries when price sweeps the previous day’s high or low (PDH/PDL) and aligns with VWAP and short-term range levels. Focus is on US30 around NY Open, when volume and liquidity are at peak levels.
HOW TO USE (NY OPEN FLOW)
1. Ahead of NY Open, mark PDH/PDL and watch how price builds a short-term range.
2. Best setups occur after liquidity is swept (PDH/PDL taken). Look for a pre-signal (early warning), then confirmation when a bar closes above/below the range and VWAP in the direction of trend.
3. Apply filters: SMA trend filter to stay aligned with bias; session filter to focus on London/NY hours.
4. Manage risk with stops beyond range edges or confirmation candle; partials at key intraday levels.
SETTINGS TIPS
Range Lookback → shorter for fast intraday charts, longer for higher TF.
SMA length → adapt to fit your bias framework.
Session filter → on for London/NY, off for continuous monitoring.
NOTES
Educational demonstration only. No financial advice.
For advanced versions with extra confirmations and filters → see my profile signature.
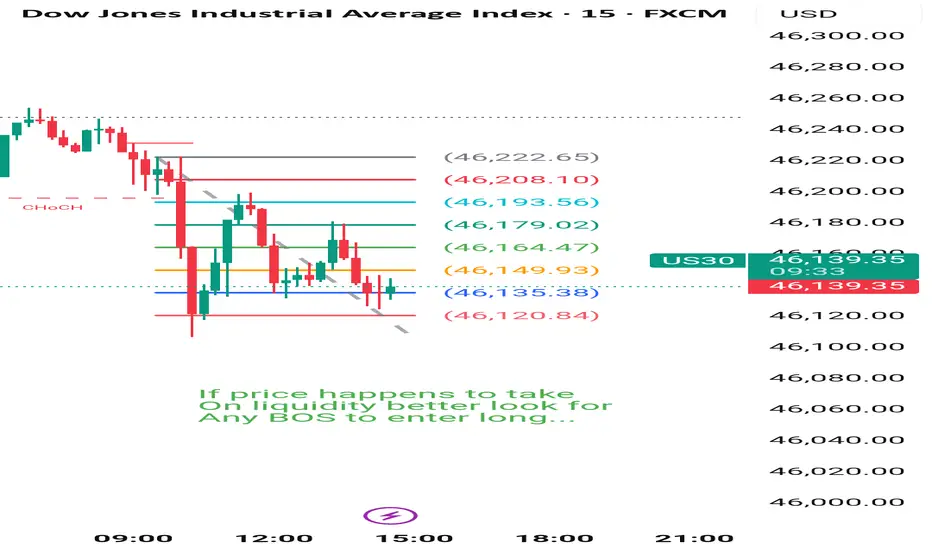
Us30 Trade Set Up Sep 22 www.tradingview.com
price is making LH/LL so overall it is bearish but it is approaching PDL so if price sweeps it and closes above i will look for a reversal IFVG on the 1m-2m to target the 4h FVG before looking for sells back down

US30 Day-trading Day 001Here we see price has been falling since the beginning of the day.
We can enter a short position on the
fib level ( .75 / .625 )
It all depends on your risk reward ratio.
Here price may also reverse only by targeting liquidity seen almost at the daily high.
Patience is key.
Lets wait for NY session where we may be able to have a clear confirmation of today's session.
US30 LongElite Analysis
Discretionary Trade with Confirmations
Targeting Structural liquidity at the top
US30 BEARISH SETUP After breaking into a new level, price managed to find resistance and made couple of attempts to break it but failed. A fall back to previously broken level is anticipated to test it as new support

[Short] Dow 30 (September 21, 2025)Entry: 46256.15
SL: 46288.65
TP: 46191.15
Trying another strategy what I found.
Backtest was done.
Live trade is on.

This may turn down soonThis channel is not providing individualized trading or investment advice, nor is it a banking service, brokerage service, trading service, investment service or money management service

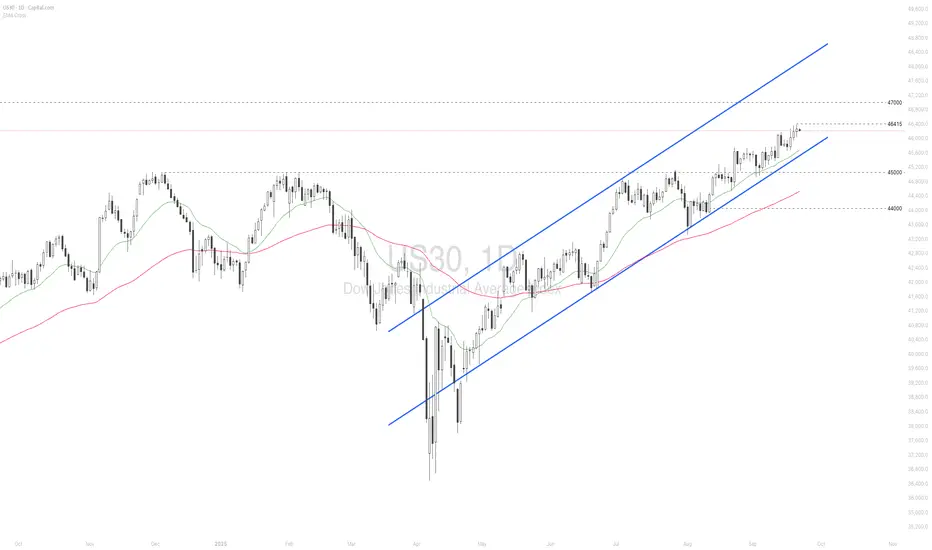
US30We looking for bullish momentum as we still inside the uptrend which results in bullish opportunities as long we are still inside the bullish trend| 1H Timeframe

US30 hits new all-time high amid robust AI fever
US equities rallied to fresh record highs, fueled by the Fed’s rate cut, resilient US economic data, and optimism over progress in US-China trade negotiations. Ongoing enthusiasm for AI also boosted technology stocks.
Nvidia (NVDA) drove the strongest market reaction after announcing a \$5 bln purchase of more than 4% of Intel (INTC). Sentiment was further buoyed by reports that Chinese regulators halted their antitrust probe into Google (GOOGL), ending a long-running investigation into Android’s dominance.
US30 maintained a solid uptrend within the ascending channel, setting a new high. The index holds above both EMAs, indicating the potential continuation of the bullish momentum. If US30 breaches above the 46415 high, the index may gain upward momentum toward the psychological resistance at 47000. Conversely, if US30 breaks below EMA21 and the channel’s lower bound, the index could retreat toward 45000.
Key Levels & Trend Confirmation – US30US30 Update
We use advanced data that counts the start of the cycle and all important key levels.
On the low time frame, US30 is holding above the breakout zone (46,177 – 46,214), showing early signs of continuation.
Key levels:
46,214 → first support on the low time frame. Holding this level keeps bullish momentum intact.
46,177 → important confirmation level for the main uptrend. If US30 closes below this, it could trigger a deeper pullback.
As long as price holds above these zones, US30 remains in a bullish structure with potential to push higher.
Downside risk: A breakdown below 46,177 would invalidate the current momentum and open space for correction toward 45,796 support.
Major cycle level: 41,097 remains the cycle start and must-hold support in the bigger picture. Losing this level would shift the cycle to red.
📌 Summary
Above 46,214 – 46,177 → bullish continuation remains in play.
Break below 46,177 → correction risk, watch 45,796 as next support.
Cycle start at 41,097 → key long-term level to keep the broader bullish cycle alive.
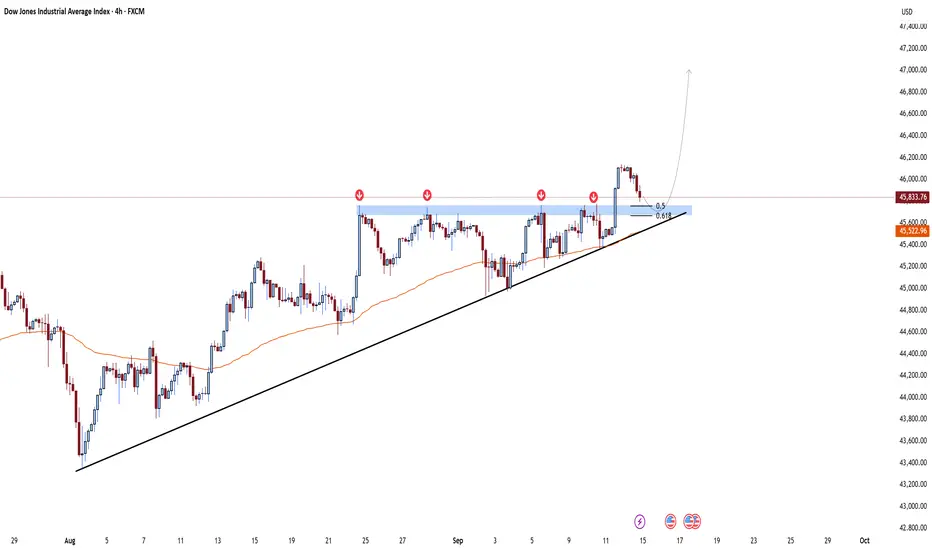
US30 4H📊 Dow Jones (4H) Analysis
The Dow just broke through the 45,700 resistance and is now pulling back to retest that same level as support.
✅ Key points:
The 45,700 zone, which acted as resistance before, could flip into strong support now.
Fibonacci retracements (0.5 & 0.618) line up right in this area, adding more confluence.
The ascending trendline and moving average are also sitting below price, keeping the bullish structure intact.
🎯 Targets:
Short-term: 46,200 – 46,400
Medium-term (measured move from the ascending triangle): 47,000 – 47,200
⚠️ Invalidation:
If price loses the 45,500 – 45,600 zone, we could see a deeper correction back to 45,000 – 45,200.
---
📌 Summary:
As long as the pullback into 45,700 holds, the bullish scenario stays in play and higher targets remain on the table.
---
🔥 What do you think? Is this just a clean retest before a push to 47,200, or will the Dow drop back below support?
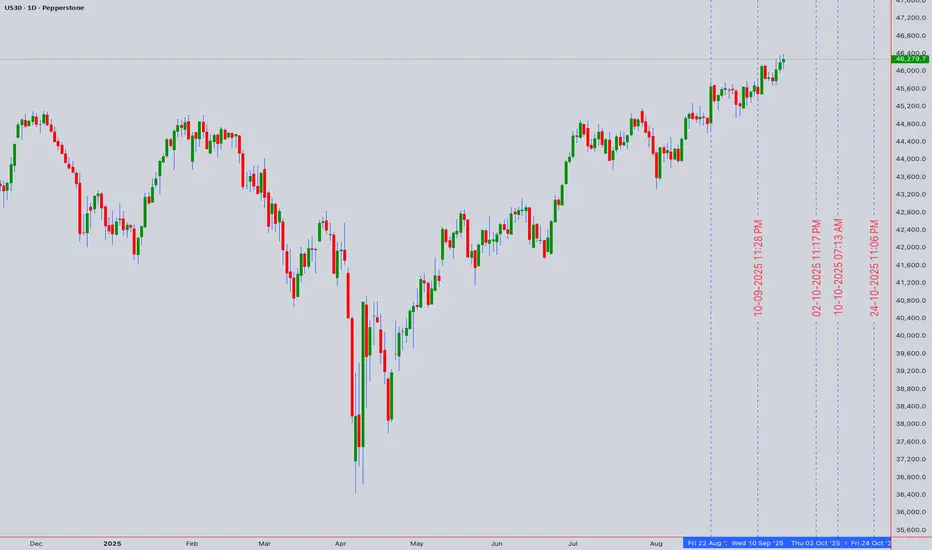
US30 (Dow Jones CFD) Forecast📊 US30 (Dow Jones CFD) Forecast 🔮
Closing Price: 46,279.7 (20th Sept 2025, 12:50 AM UTC+4)
🔥 Technical Outlook (Intraday + Swing)
⏱ Intraday Analysis (5m – 4H)
✅ Buy Zone: 46,050 – 46,150 🎯
🚀 Upside Targets: 46,420 → 46,580 → 46,750 🏆
❌ Sell Zone: 46,600 – 46,700 📉
📉 Downside Targets: 46,380 → 46,200 → 45,950 ⚠️
🔔 Watch for MA Golden Cross & VWAP bounce intraday.
📆 Swing Trading Analysis (Daily – Weekly)
🛡 Major Support: 45,800 – 45,500 🪙
📈 Swing Buy Entry: 45,600 – 45,800
🎯 Swing Bullish Targets: 46,950 → 47,320 → 47,900 🌟
📉 Swing Sell Entry: Below 45,480 ❗
🎯 Swing Bearish Targets: 45,200 → 44,780 → 44,350 🕳
📚 Methodology Applied
📌 Chart Patterns: Head & Shoulders ⚠️, potential Bull Trap 🚨.
📌 Harmonics & Fib Levels: 0.618 pullback aligns near 45,950.
📌 Elliott Wave Count: Wave 3 extension may still be active 🔄.
📌 Ichimoku Cloud: Price above Kumo = bullish bias ☁️✅.
📌 Wyckoff: Distribution signals visible at 46,700 zone 🏦.
📌 RSI: 63 intraday → nearing overbought, but not extreme.
📌 Bollinger Bands: Upper band hit near 46,750 = resistance 🎯.
📌 VWAP: Anchored VWAP support ~46,100 = key intraday pivot.
⚖️ Market Context
📰 US Fed stance & inflation numbers remain catalysts.
🌍 Geopolitical tensions add volatility risk.
💵 Dollar Index strength can cap upside.
🎯 Trading Plan Summary
📊 Intraday Bias: Range-bound → Scalps between 46,100 – 46,700.
🚀 Swing Bias: Bullish above 45,800, bearish below 45,500.
🔑 Risk Mgmt: Always apply SL 80–120 pts (intraday) & 200–300 pts (swing).
⚠️ Note: This analysis is for educational purposes 📚. Trade with discipline, risk management, and DYOR 🔍.
For individuals seeking to enhance their trading abilities based on the analyses provided, I recommend exploring the mentoring program offered by Shunya Trade. (Website: shunya dot trade)
I would appreciate your feedback on this analysis, as it will serve as a valuable resource for future endeavors.
Sincerely,
Shunya.Trade
Website: shunya dot trade
📝 TRADING CHECKLIST
Before entering any position:
- ✅ Confirm volume supports move
- ✅ Check RSI for divergences
- ✅ Verify multiple timeframe alignment
- ✅ Set stop loss before entry
- ✅ Calculate position size
- ✅ Review correlation with DXY/SPX
- ✅ Check economic calendar
- ✅ Assess market sentiment
⚠️Disclaimer: This post is intended solely for educational purposes and does not constitute investment advice, financial advice, or trading recommendations. The views expressed herein are derived from technical analysis and are shared for informational purposes only. The stock market inherently carries risks, including the potential for capital loss. Therefore, readers are strongly advised to exercise prudent judgment before making any investment decisions. We assume no liability for any actions taken based on this content. For personalized guidance, it is recommended to consult a certified financial advisor.
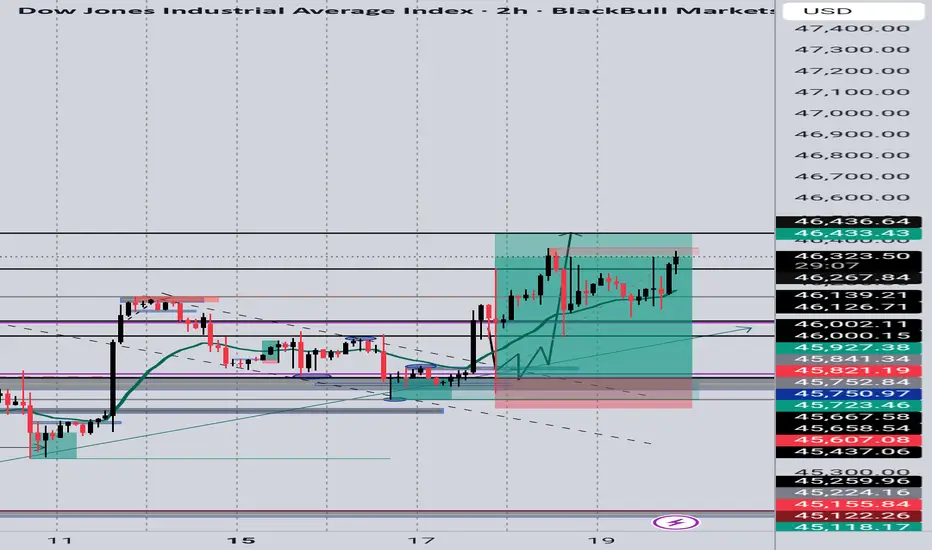
US30 (Dow Jones) Update
US30 (Dow Jones) Update
✅ Reversal entry played out perfectly from support around 45,750.
🎯 Target zone at 46,433 reached with precision.
📌 Clean bullish move respecting market structure – trade delivered perfect results.
📊 Professional Technical Style
US30 respected the reversal zone around 45,750 and pushed higher in line with expectations. Price action confirmed the bullish structure, leading to a strong rally into the 46,433 resistance area, successfully hitting target. A textbook reversal setup that delivered clean results.
Dow Jones is back in playThe rotation from tech stocks back to the industrial sector is the main trend in late September: Dow Jones gets back in play. The price consolidates in the ascending wedge, and ready to break it to the upside as shown on the chart, with a potential target area above $48000.
The alternative scenario would be a false breakout with a continuation of a consolidation and another attempt to break it closer to PCE index publication on September 25th, 2025.
Don't forget - this is just the idea, always do your own research and never forget to manage yoru risk.

US30 LONG SETUP Price has successfully broken into a new level 46.. First test of new support was clean and now we looking for a second test as it continues with an up trend
