SLP LIKELY MOVE - TO FALL TO $0.0145Please support this idea with a LIKE👍 if you find it useful🥳
Not a financial advice🙅🏼♂️
With Slp market price at $0.0160, price has been in a downtrend since it broke downward from the consolidation. It’s making it way towards the next available support which I think $0.0145 is the next support level.
What do you think?
Share your opinion in the comment section✍️
You can also demand for analysis of your preferred coin
Follow me stay updated about this coin and more helpful projects like this🎁
Happy Trading💰🥳🤗
Trade ideas

SLP Danger zone Not much has changed since I posted about SLP a few days ago. I have linked my previous post below as everything within it is still relevant in my opinion.
Take this into consideration:
1) SLP has now flipped the green box I had from support to resistance, so I have changed it to red in color indicating a zone of resistance.
2) The longer we hang out below this box the higher the likelihood becomes that situation 2 will play out, however situation 1 could still be on the table.
3) AS LONG AS SLP ISSUANCE STAYS 10-15X GREATER THAN THE BURN RATE, IT IS HIGHLY UNLIKELY WE WILL CONTINUE TO MOVE UPWARDS!!! This is a key component to the price everyone seems to be forgetting. SLP still has a big inflation problem right now. The only way we can officially move into an uptrend is if the mint rate decreases drastically, OR if the market cap increases at a rate that is greater than the average current mint/burn rate. You cannot keep increasing supply of a coin by 10-15x its burn rate and expect an uptrend unless there are a ton of buyers. Basic supply and demand.
4) I know Axie is aware of the mint/vs burn rate problems but as of today they still exist. Until this changes i'm relatively bearish on this coin.
5) Remember, this is not financial advice and always do your own analysis/research before making any decisions on the market.

SLP Bullish butterfly pattern appearing at 1H TF. We might bounce back again back to 0.0172 and retest the resistance. There is also a chance of a dip due to another hidden bearish divergence in the chart. If RSI goes below the green line then we might dip to 0.0155 or lower. As long as we stay above the green line in the RSI levels, SLP is still bullish.

SLP UpdateWe've expected the dip to 0.0165 and lower than that. Hidden bearish divergence appearing at 1H TF. We might dip more to below 0.0152 or possibly lower. From there it is a possible bounce play to go back to 0.0165. If we break the RSI resistance levels we will most likely retest the resistance of the falling wedge pattern which is around 0.0172.

SLP TP's ReviewHello Everyone
As promised, I specified the SLP targets after confirming the uptrend.
PLZ RDOR
Hoping for increasing success>>>>>>>>>>>>>>>>>>>>>>>>>>>

Smooth Love Potion Hits Support | Potential For ReversalSmooth Love Potion Hits Support | Potential For Reversal
SLPUSDT Just hit the 0.786 Fib. retracement support level for the February bullish wave breakout... This can lead to a price jump.
This level is marked light blue, see more details on the chart.
Namaste.

Slp CoinSo slp is moving down but the volume is going upwards. It is Important that slp holds the support and bounce back as forming Double Bottom. In that case scenario I have made a resistance. Follow for for Updates.

SLP BROKE SUPPORTPlease support this idea with a LIKE👍 if you find it useful🥳
Not a financial advice🙅🏼♂️
With respect to my previous analysis, the question asked has been answered, price broke support and started to fall.
Watch out for next forecast on slp🔥
What do you think?
Share your opinion in the comment section✍️
You can also demand for analysis of your preferred coin
Follow me stay updated about this coin and more helpful projects like this🎁
Happy Trading💰🥳🤗

Possible SLP PumpIn the 15M TF, we have a bullish falling wedge pattern which is going to be bullish for SLP in the long term. Right now, we have a hidden bearish divergence in 15M TF where we might dip to 0.0165 and we might bounce from that area back to 0.0174. If the candle closes above 0.0174, we might go higher up to 0.0191. There is also a possible dip lower than 0.0165 which is 0.0152 because of the hidden bearish divergence. Even if we dip to 0.0152, it will still bounce back to 0.0174. Tomorrow, we will see more signals due to the falling wedge pattern almost ending. When we see the pattern almost ending, we will know there if SLP will pump big or not. I will keep an eye for signals tomorrow so this post will be updated.


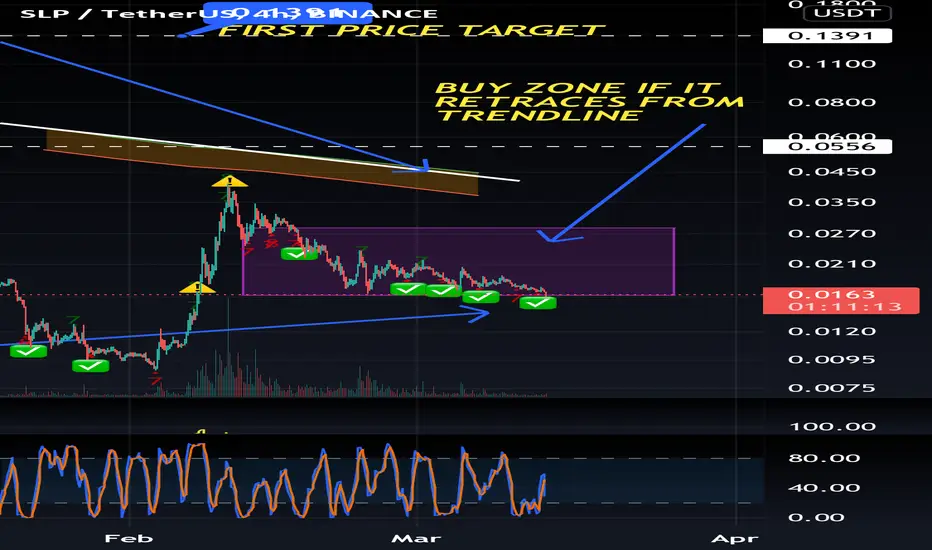
SLP is sitting right on support on 4hrTake a look at the buy zone for SLP on the 4hr…the DeMark 9 shows it’s go time, but if it were to break, $0.12 is next support.
SLP Bearish Before Origin Release, SHORTWeeks before origin release, SLP is still in a bearish trend breaking the descending triangle pattern heading towards 0.0128 support area. Towards the end of March, the trend may suddenly reverse with the optimism that Origin features and upcoming Land release will help the burning mechanism of Smooth Love Potion. Caveat!

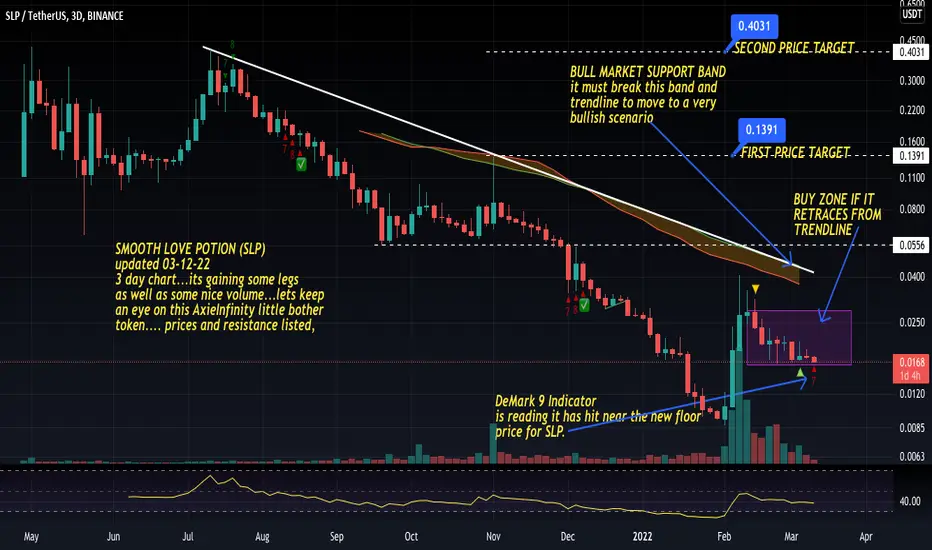
SLP smooth love potion 3 day chart in the buy zoneSMOOTH LOVE POTION (SLP)
updated 03-12-22
3 day chart...its gaining some legs
as well as some nice volume...lets keep
an eye on this AxieInfinity little bother
token.... prices and resistance listed,

SLP, whats next? BE CAUTIOUS!!!!When SLP was trading around the 0.023 range, I mentioned that we would likely come to the 0.018 cent region on SLP before experiencing some support. So what is next?
1) We have quite a large ichimoku cloud ahead of us. SLP would need to rally 190% from this point to have a bullish breakout from the cloud. As you can see SLP rejected almost too perfectly from the cloud at its recent high of 0.04 cents.
2) We have broken back below the daily ema ribbon. - Not a great sign IMO because this means we have flipped support into resistance.
3) The green box I have drawn is basically the last line of defense for SLP since it marks the only key area of support SLP has on this downwing we have been seeing. If it breaks this green box and flips it to resistance, its is very likely we go back to where it started before the pump around the 0.008 cent region.
4) Despite Axie claiming to reduce the minting of coins, the burn vs mint rate chart on their website indicates that there is substantially more SLP being minted than burned, at least to this date. This does not make for a bullish scenario as the market cap would have to continuously move upward at the same rate coins are being minted just to keep the current price action.
I have two scenarios on the chart. I am more inclined to believe we will see something like #2 play out, however 1 could very well be a posibility. A "final shakeout" before more downside.
I'm pretty bearish on this coin until the mint rate closer match the burn rate of these coins.
Remember, this is not financial advice and always do your own analysis/research before making any decisions on the market.

SLP We’ve now dipped to 0.0170 which is closed to my previous prediction. We might see a retest back to the previous high which is 0.0178. If we candle close above it, we might go higher up to 0.0191 or higher. Bullish butterfly pattern in 15M TF.


💥SLP CONSOLIDATION WITHIN 0.0168 & 0.0217 STILL ACTIVEPlease support this idea with a LIKE👍 if you find it useful🥳
Not a financial advice🙅🏼♂️
Price has been in this range since 23rd February till date within $0.0168 & $0.0217. Price has tested this price level serving as support and resistance twice.
Price is approaching the support at $0.0168 to test it the 3rd time. The question on our mind is will price break this support or rise to the resistance zone at $0.0217.
There’s no answer to that yet. We need to wait for what price is going to do. Therefore, this is the possible direction to which it can follow.
What do you think?
Share your opinion in the comment section✍️
You can also demand for analysis of your preferred coin
Follow me stay updated about this coin and more helpful projects like this🎁
Happy Trading💰🥳🤗

#SLP short (Smooth Love Potion)i think SLP is going to break out to the downside. doesnt look very promissing the whole market situation.

SLP will possibly go back to 0.0191SLP might go back to around 0.0184 if RSI breaks resistance. If not then it might dip further to 0.0170. If candle closes above 0.0184 then we might go higher back to the previous high which is 0.0191. I'm favorable on the bullish side due to the bullish butterfly pattern.

Possible slp dipIn 1H TF, SLP might dip around to 0.0174 or even lower.
- Hidden bearish divergence
- Bearish butterfly pattern
I’m just new to doing TA, so all i know right now are patterns mostly. Advices are appreciated in the comments, thanks!

SLP.USDT 🔴Hello dear friends, I hope you had a good day. I checked this currency and my opinion is that this currency has the potential for great growth.🔴
🟡Tp1: 0.0208
🔵Tp2: 0.03
🟥I hope the target is done correctly, just do not forget the stop loss🟥
I wish you success and a pocket full of money😁🌹

SLP may rally up to 570%After a swing failure pattern, SLP went into an 8 month long corrective wave pattern as you can see in the above given chart which ended with a 4x rally last month.
1) A daily close above 0.0195 can give you an entry.
2) A daily close below 0.01733 can get you out.
3) Stochastic has crossed up.
4) Accumulation and/or contraction zone is about reach a break point (based on volume)
5) Very high 24hr trading volume (see on CMC)
Targets can be seen as 0.618 the green box and further extension levels.
Trade Safe!
DYOR this is not a financial advice.
