SMH (Chips)I think over the next 2 months the chip sector under performs minimum and most likely has a 10+% correction
Monthly chart..
Rsi is 80+ usually when this happens on the monthly time frame chips under perform for the next 12-18months.
Add to the RSI is factor is the tag of its 17yr trendline res
Key stats
About VanEck Semiconductor ETF
Home page
Inception date
May 5, 2000
Structure
Open-Ended Fund
Replication method
Physical
Dividend treatment
Distributes
Distribution tax treatment
Qualified dividends
Income tax type
Capital Gains
Max ST capital gains rate
39.60%
Max LT capital gains rate
20.00%
Primary advisor
Van Eck Associates Corp.
Distributor
Van Eck Securities Corp.
Identifiers
3
ISIN US92189F6768
SMH is a highly concentrated fund that invests in common stocks and depositary receipts of US-listed semiconductor companies, similar to our benchmark. Midcap companies and foreign companies listed in the US can also be included. To be initially eligible, 50% of company revenues must be primarily in the production of semiconductors and semiconductor equipment. The top 50 eligible companies by market cap are then given two separate ranks based on free-float market capitalization in descending order and three-month average-daily-trading volume in descending order. Those two ranks are summed and the highest ranked 25 companies are selected. A capping scheme is applied to ensure diversification and more weight is given to the larger companies.
Related funds
Classification
What's in the fund
Exposure type
Electronic Technology
Producer Manufacturing
Stock breakdown by region
Top 10 holdings

Healthy Structure vs. Unhealthy Structure (Daily)Healthy Structure vs. Unhealthy Structure (Daily)
Both charts experienced volatility.
Only one maintained structural integrity.
Left: Microsoft (MSFT)
• 10 / 20 / 50 EMAs stacked below the 200 EMA
• Shorter-term EMAs still pointing downward
• Price trading below the long-term mean
Structure rema

Unlock the SMH Secret: Why Institutions Are Buying PUTSMH Weekly Signal | 2026-01-23
📊 TRADE DETAILS 📊
🎯 Instrument: SMH
🔀 Direction: PUT (SHORT)
🎯 Strike: 405.00
💵 Entry Price: 0.50
🎯 Profit Target: 0.70
🛑 Stop Loss: 0.35
📅 Expiry: 2026-01-30
📏 Size: 0.5
📈 Confidence: 56%
⏰ Entry Timing: N/A
🕒 Signal Time: 2026-01-23 17:01:08 EST
HIGH RISK WARNING:

Unlock the SMH Secret: Why Institutions Are Buying PUTsSMH Weekly Signal | 2026-01-23
📊 TRADE DETAILS 📊
🎯 Instrument: SMH
🔀 Direction: PUT (SHORT)
🎯 Strike: 405.00
💵 Entry Price: 0.50
🎯 Profit Target: 0.70
🛑 Stop Loss: 0.35
📅 Expiry: 2026-01-30
📏 Size: 0.5
📈 Confidence: 56%
HIGH RISK WARNING: Use only small position size due to lower confidence and hi

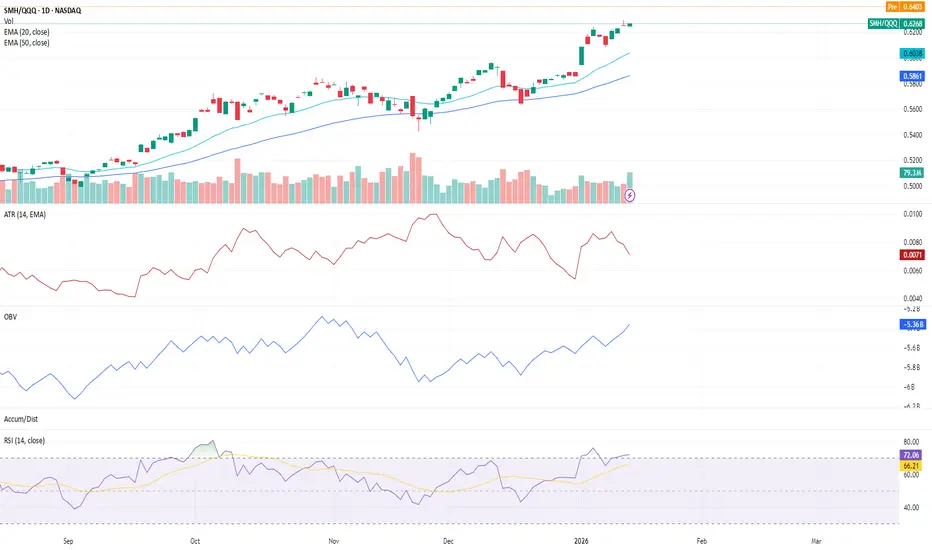
SMH/QQQ | Leadership Remains IntactOn the daily timeframe, the SMH/QQQ ratio continues to confirm semiconductor leadership within tech.
The 20 EMA remains in the lead with clean upward curvature, reflecting sustained momentum and trend control. While ATR has compressed, this appears to be a constructive pause rather than a loss of s

SMH/SPY | Semiconductor Leadership Remains IntactSMH continues to display sustained relative strength versus SPY, reinforcing its role as a leading risk-on signal within the broader market structure.
After a brief consolidation, the ratio has resumed its upward trajectory, with trend structure remaining clean and uninterrupted.
Key observations:

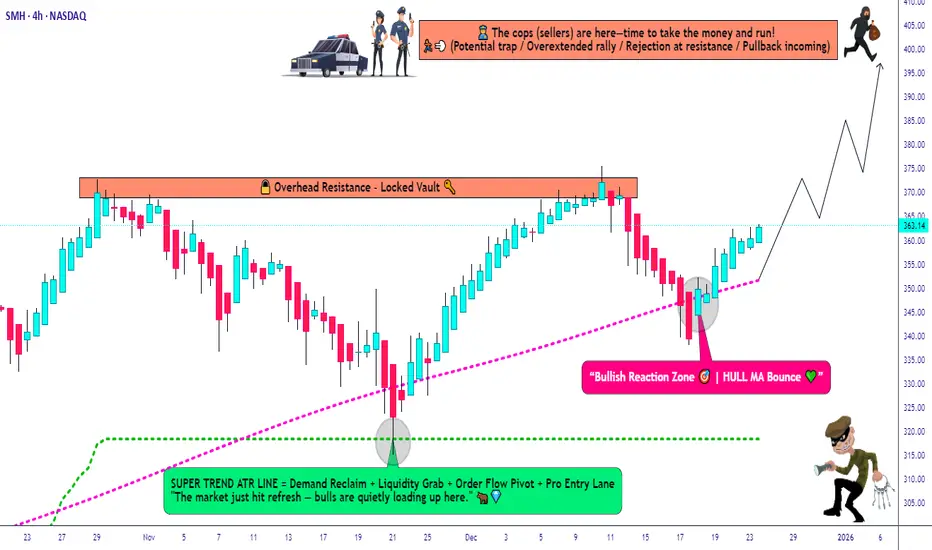
SMH Bullish Structure Confirmed — Pullback Strategy Active!🎯 SMH Semiconductor Heist: The $400 Target Caper 💰🚀
📊 Asset Overview
VanEck Semiconductor ETF (SMH) - NASDAQ Listed
Trade Type: Swing Trade (Bullish Setup)
Strategy Style: "The Thief Method" - Layered Entry Approach 🏴☠️
🔍 Technical Analysis Breakdown
📈 Bullish Confirmation Signals
✅ Supertrend AT
SMH/QQQ Leadership 1D Chart (Daily)
The SMH/QQQ ratio continues to hold a steady leadership trend, maintaining a firm upward trajectory above the 20 EMA. This reflects ongoing relative strength in semiconductors versus the broader tech sector.
ATR remains flat, signaling stable volatility conditions and suggesting t

SMH Is In Wave 5 Extension as Semiconductors Aim for 400 AreaSMH is the VanEck Semiconductor ETF, giving concentrated exposure to major global semiconductor companies like NVIDIA, TSMC, and Broadcom. It holds about 25 stocks and is known for higher volatility because a few large chipmakers dominate the fund. Investors use SMH to bet on long-term growth in chi

See all ideas
Summarizing what the indicators are suggesting.
Oscillators
Neutral
SellBuy
Strong sellStrong buy
Strong sellSellNeutralBuyStrong buy
Oscillators
Neutral
SellBuy
Strong sellStrong buy
Strong sellSellNeutralBuyStrong buy
Summary
Neutral
SellBuy
Strong sellStrong buy
Strong sellSellNeutralBuyStrong buy
Summary
Neutral
SellBuy
Strong sellStrong buy
Strong sellSellNeutralBuyStrong buy
Summary
Neutral
SellBuy
Strong sellStrong buy
Strong sellSellNeutralBuyStrong buy
Moving Averages
Neutral
SellBuy
Strong sellStrong buy
Strong sellSellNeutralBuyStrong buy
Moving Averages
Neutral
SellBuy
Strong sellStrong buy
Strong sellSellNeutralBuyStrong buy
Displays a symbol's price movements over previous years to identify recurring trends.
Frequently Asked Questions
An exchange-traded fund (ETF) is a collection of assets (stocks, bonds, commodities, etc.) that track an underlying index and can be bought on an exchange like individual stocks.
SMH trades at 401.65 USD today, its price has risen 5.40% in the past 24 hours. Track more dynamics on SMH price chart.
SMH net asset value is 401.70 today — it's risen 6.31% over the past month. NAV represents the total value of the fund's assets less liabilities and serves as a gauge of the fund's performance.
SMH assets under management is 40.98 B USD. AUM is an important metric as it reflects the fund's size and can serve as a gauge of how successful the fund is in attracting investors, which, in its turn, can influence decision-making.
SMH price has risen by 4.27% over the last month, and its yearly performance shows a 62.49% increase. See more dynamics on SMH price chart.
NAV returns, another gauge of an ETF dynamics, have risen by 6.31% over the last month, showed a 12.03% increase in three-month performance and has increased by 62.23% in a year.
NAV returns, another gauge of an ETF dynamics, have risen by 6.31% over the last month, showed a 12.03% increase in three-month performance and has increased by 62.23% in a year.
SMH fund flows account for 5.14 B USD (1 year). Many traders use this metric to get insight into investors' sentiment and evaluate whether it's time to buy or sell the fund.
Since ETFs work like an individual stock, they can be bought and sold on exchanges (e.g. NASDAQ, NYSE, EURONEXT). As it happens with stocks, you need to select a brokerage to access trading. Explore our list of available brokers to find the one to help execute your strategies. Don't forget to do your research before getting to trading. Explore ETFs metrics in our ETF screener to find a reliable opportunity.
SMH invests in stocks. See more details in our Analysis section.
SMH expense ratio is 0.35%. It's an important metric for helping traders understand the fund's operating costs relative to assets and how expensive it would be to hold the fund.
No, SMH isn't leveraged, meaning it doesn't use borrowings or financial derivatives to magnify the performance of the underlying assets or index it follows.
In some ways, ETFs are safe investments, but in a broader sense, they're not safer than any other asset, so it's crucial to analyze a fund before investing. But if your research gives a vague answer, you can always refer to technical analysis.
Today, SMH technical analysis shows the strong buy rating and its 1-week rating is buy. Since market conditions are prone to changes, it's worth looking a bit further into the future — according to the 1-month rating SMH shows the buy signal. See more of SMH technicals for a more comprehensive analysis.
Today, SMH technical analysis shows the strong buy rating and its 1-week rating is buy. Since market conditions are prone to changes, it's worth looking a bit further into the future — according to the 1-month rating SMH shows the buy signal. See more of SMH technicals for a more comprehensive analysis.
Yes, SMH pays dividends to its holders with the dividend yield of 0.29%.
SMH trades at a premium (0.01%).
Premium/discount to NAV expresses the difference between the ETF’s price and its NAV value. A positive percentage indicates a premium, meaning the ETF trades at a higher price than the calculated NAV. Conversely, a negative percentage indicates a discount, suggesting the ETF trades at a lower price than NAV.
Premium/discount to NAV expresses the difference between the ETF’s price and its NAV value. A positive percentage indicates a premium, meaning the ETF trades at a higher price than the calculated NAV. Conversely, a negative percentage indicates a discount, suggesting the ETF trades at a lower price than NAV.
SMH shares are issued by Van Eck Associates Corp.
SMH follows the MVIS US Listed Semiconductor 25. ETFs usually track some benchmark seeking to replicate its performance and guide asset selection and objectives.
The fund started trading on May 5, 2000.
The fund's management style is passive, meaning it's aiming to replicate the performance of the underlying index by holding assets in the same proportions as the index. The goal is to match the index's returns.