SNXUSDT — Pinned at the 0.66 FulcrumSNX price keeps orbiting 0.66 — rallies fade near 0.70, dips hold 0.64. Let’s break down the levels before a real move shows up.
High Timeframes (Weekly → 2D → 12H)
– Weekly: Basing 0.58–0.75 after Q4’24 downtrend. Supply 0.72–0.78; demand 0.58–0.62.
– 2D: Lower-highs since Aug, compressing under 0

SNX ; BEARISH!!!Hello friends
Given the growth we had, you can now see that the price ended the trend at the ceiling of a large candle and the sellers covered it with another large candle.
Now we have a resistance area in the middle of this candle from which the price is expected to correct and move to the specif

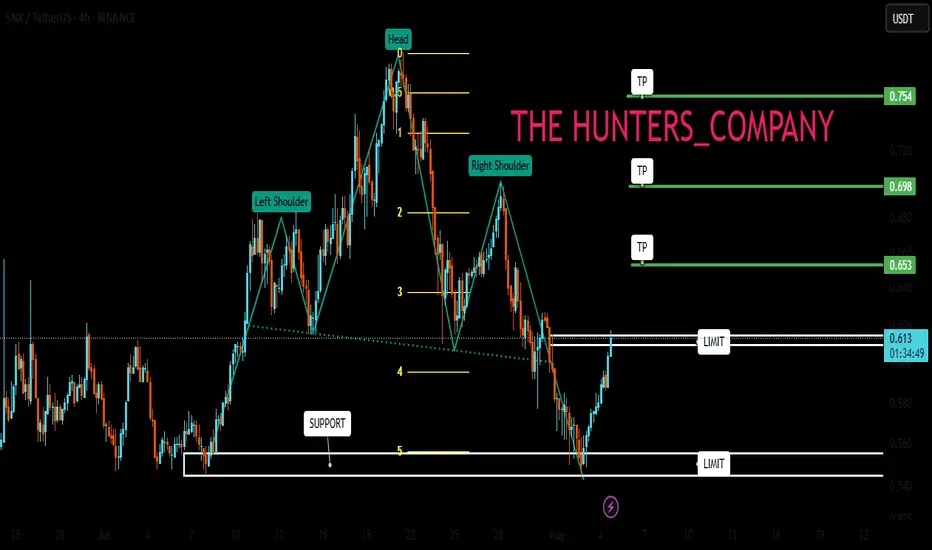
SNX : Has the climb started?Hello friends🙌
👀According to the shoulder and shoulder pattern that was formed and then the price fell in the support area that we identified for you with Fibonacci, buyers entered and provided good support for the price, which also broke our resistance, which creates a good opportunity to buy, of
Can #SNX Bulls Sustain the Current Momentum? Watch it CloselyYello, Paradisers! Is this #SNX setup just another fakeout in disguise, or is the market quietly setting up for a major bullish momentum shift? Let’s dissect what’s really happening on #SNXUSDT:
💎After moving through a falling wedge pattern for months, #Synthetix has already broken out above the de
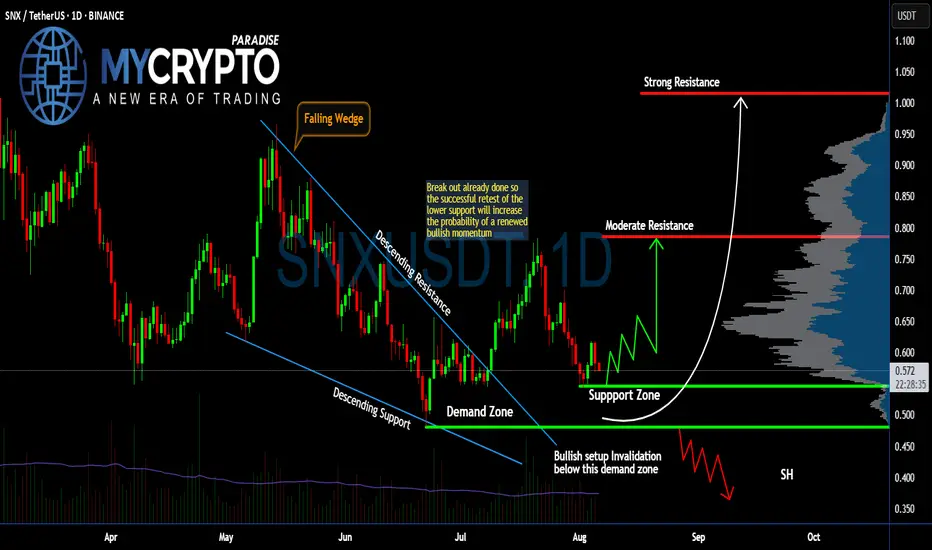
SNXUSDT 1D#SNX had a strong bullish rally after breaking out of the falling wedge. It is now in a corrective phase, and the support zone at $0.712–$0.661 is a good area to consider buying — especially since the daily SMA100 is within this zone.
In case of a deeper dip, we’ll look to buy around $0.594.
If a su

SNXUSDT Breakout Alert! Are We Witnessing the Early Stages?📌 🔍 Overview:
After months of relentless downward pressure, SNX has finally shown a strong technical breakout. The price has decisively broken above the long-term descending trendline, signaling a potential shift in structure from bearish to bullish. This could mark the beginning of a significant i

SNX/USDT | Long | Synthetic Derivatives| (July 2025)SNX/USDT | Long | Synthetic Derivatives Rebound with DAO-Driven Growth | (July 2025)
1️⃣ Short Insight Summary
SNX is showing signs of strength again with Perps V2 expanding and DAO governance maturing. With inflation removed and rewards now tied to protocol fees, real usage is starting to reflect

SNXUSDT UPDATE
Pattern: Falling Wedge Breakout
Current Price: \$0.605
Target Price: \$0.95
Target % Gain: 60.31%
Technical Analysis: SNX has broken out of a falling wedge on the 12H chart, signaling a bullish reversal. The breakout is confirmed with strong green candles, indicating momentum buildup and a potenti

SNX/USDT Short-Term Trade | Entry at 0.627 with Clear TargetsMidterm/Intra-day Setup
This is an intra-day (midterm) trading setup.
Entry Price: 0.627
Take Profits (TPs): Refer to the marked levels on the screen for target points.
Stay disciplined and manage your risk accordingly.

SNXUSDT Tracking Final Leg of Downtrend or Reversal SetupSNXUSDT remains in a downtrend despite breaking its trendline, with price action still dipping. The current focus is on the potential completion of Wave 5, targeting the projected re-accumulation zone but this setup only activates if $0.548 support breaks.
If this level holds, a rebound could drive

See all ideas
Summarizing what the indicators are suggesting.
Oscillators
Neutral
SellBuy
Strong sellStrong buy
Strong sellSellNeutralBuyStrong buy
Oscillators
Neutral
SellBuy
Strong sellStrong buy
Strong sellSellNeutralBuyStrong buy
Summary
Neutral
SellBuy
Strong sellStrong buy
Strong sellSellNeutralBuyStrong buy
Summary
Neutral
SellBuy
Strong sellStrong buy
Strong sellSellNeutralBuyStrong buy
Summary
Neutral
SellBuy
Strong sellStrong buy
Strong sellSellNeutralBuyStrong buy
Moving Averages
Neutral
SellBuy
Strong sellStrong buy
Strong sellSellNeutralBuyStrong buy
Moving Averages
Neutral
SellBuy
Strong sellStrong buy
Strong sellSellNeutralBuyStrong buy
Displays a symbol's price movements over previous years to identify recurring trends.